Cities with the Highest Percentage of Population with a Degree in Bio, Nature & Agricultural in Michigan
RELATED REPORTS & OPTIONS
Bio, Nature & Agricultural
Michigan
Compare Cities
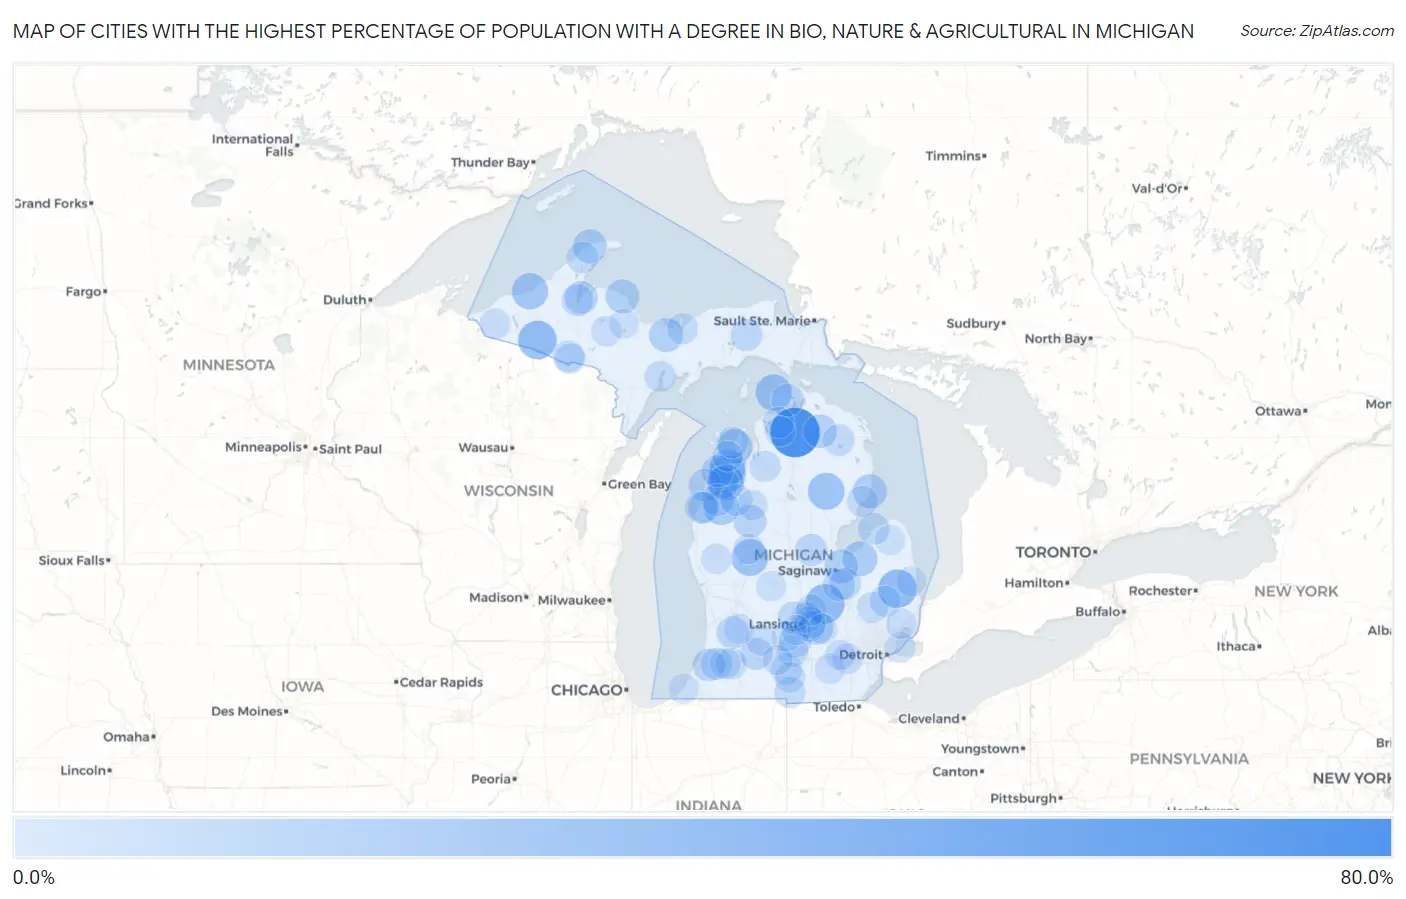
Map of Cities with the Highest Percentage of Population with a Degree in Bio, Nature & Agricultural in Michigan
0.0%
80.0%
Cities with the Highest Percentage of Population with a Degree in Bio, Nature & Agricultural in Michigan
| City | % Graduates | vs State | vs National | |
| 1. | Vanderbilt | 65.7% | 5.7%(+60.0)#1 | 6.4%(+59.4)#204 |
| 2. | Cannonsburg | 47.6% | 5.7%(+41.9)#2 | 6.4%(+41.3)#398 |
| 3. | Rock | 44.8% | 5.7%(+39.1)#3 | 6.4%(+38.5)#435 |
| 4. | Middletown | 35.1% | 5.7%(+29.4)#4 | 6.4%(+28.8)#700 |
| 5. | Palo | 33.3% | 5.7%(+27.6)#5 | 6.4%(+27.0)#758 |
| 6. | Watersmeet | 33.3% | 5.7%(+27.6)#6 | 6.4%(+27.0)#764 |
| 7. | Melvin | 33.3% | 5.7%(+27.6)#7 | 6.4%(+27.0)#777 |
| 8. | Stanwood | 28.6% | 5.7%(+22.8)#8 | 6.4%(+22.2)#1,065 |
| 9. | Rose City | 28.1% | 5.7%(+22.4)#9 | 6.4%(+21.8)#1,097 |
| 10. | Bendon | 28.0% | 5.7%(+22.3)#10 | 6.4%(+21.6)#1,106 |
| 11. | Cross Village | 27.3% | 5.7%(+21.5)#11 | 6.4%(+20.9)#1,159 |
| 12. | Maple Grove | 26.7% | 5.7%(+21.0)#12 | 6.4%(+20.4)#1,194 |
| 13. | Ontonagon | 26.4% | 5.7%(+20.7)#13 | 6.4%(+20.1)#1,240 |
| 14. | Nessen City | 25.0% | 5.7%(+19.3)#14 | 6.4%(+18.6)#1,415 |
| 15. | Wellston | 23.1% | 5.7%(+17.3)#15 | 6.4%(+16.7)#1,615 |
| 16. | Akron | 22.7% | 5.7%(+17.0)#16 | 6.4%(+16.4)#1,644 |
| 17. | Lake Leelanau | 21.7% | 5.7%(+16.0)#17 | 6.4%(+15.4)#1,783 |
| 18. | Oscoda | 20.8% | 5.7%(+15.1)#18 | 6.4%(+14.4)#1,913 |
| 19. | Williamston | 20.5% | 5.7%(+14.8)#19 | 6.4%(+14.2)#1,945 |
| 20. | Big Bay | 20.0% | 5.7%(+14.3)#20 | 6.4%(+13.6)#2,017 |
| 21. | Chatham | 20.0% | 5.7%(+14.3)#21 | 6.4%(+13.6)#2,071 |
| 22. | Eagle River | 20.0% | 5.7%(+14.3)#22 | 6.4%(+13.6)#2,084 |
| 23. | Robin Glen Indiantown | 19.4% | 5.7%(+13.7)#23 | 6.4%(+13.1)#2,160 |
| 24. | Canada Creek Ranch | 19.0% | 5.7%(+13.3)#24 | 6.4%(+12.7)#2,238 |
| 25. | Pittsford | 18.4% | 5.7%(+12.7)#25 | 6.4%(+12.0)#2,367 |
| 26. | Mohawk | 18.2% | 5.7%(+12.5)#26 | 6.4%(+11.8)#2,415 |
| 27. | Pellston | 16.8% | 5.7%(+11.1)#27 | 6.4%(+10.5)#2,676 |
| 28. | Zeba | 16.7% | 5.7%(+10.9)#28 | 6.4%(+10.3)#2,736 |
| 29. | Le Roy | 16.7% | 5.7%(+10.9)#29 | 6.4%(+10.3)#2,762 |
| 30. | Arcadia | 16.7% | 5.7%(+10.9)#30 | 6.4%(+10.3)#2,778 |
| 31. | Hartford | 16.0% | 5.7%(+10.3)#31 | 6.4%(+9.65)#2,946 |
| 32. | Shaftsburg | 15.6% | 5.7%(+9.90)#32 | 6.4%(+9.27)#3,054 |
| 33. | Skanee | 15.6% | 5.7%(+9.90)#33 | 6.4%(+9.27)#3,059 |
| 34. | Eaton Rapids | 15.6% | 5.7%(+9.88)#34 | 6.4%(+9.25)#3,060 |
| 35. | Hopkins | 15.5% | 5.7%(+9.80)#35 | 6.4%(+9.18)#3,084 |
| 36. | Sanford | 15.4% | 5.7%(+9.66)#36 | 6.4%(+9.03)#3,120 |
| 37. | Thompsonville | 15.2% | 5.7%(+9.42)#37 | 6.4%(+8.80)#3,202 |
| 38. | Augusta | 15.1% | 5.7%(+9.32)#38 | 6.4%(+8.70)#3,221 |
| 39. | Oak Hill | 15.0% | 5.7%(+9.27)#39 | 6.4%(+8.65)#3,235 |
| 40. | Brethren | 15.0% | 5.7%(+9.27)#40 | 6.4%(+8.65)#3,238 |
| 41. | Burt | 14.9% | 5.7%(+9.14)#41 | 6.4%(+8.51)#3,279 |
| 42. | Haslett | 14.6% | 5.7%(+8.87)#42 | 6.4%(+8.25)#3,356 |
| 43. | Newberry | 14.5% | 5.7%(+8.75)#43 | 6.4%(+8.13)#3,408 |
| 44. | Wacousta | 14.5% | 5.7%(+8.73)#44 | 6.4%(+8.10)#3,427 |
| 45. | Lawrence | 14.4% | 5.7%(+8.68)#45 | 6.4%(+8.05)#3,438 |
| 46. | Birch Run | 14.4% | 5.7%(+8.66)#46 | 6.4%(+8.04)#3,442 |
| 47. | Chassell | 14.3% | 5.7%(+8.56)#47 | 6.4%(+7.93)#3,488 |
| 48. | Harrietta | 14.3% | 5.7%(+8.56)#48 | 6.4%(+7.93)#3,535 |
| 49. | Honor | 14.3% | 5.7%(+8.56)#49 | 6.4%(+7.93)#3,550 |
| 50. | Baraga | 14.0% | 5.7%(+8.25)#50 | 6.4%(+7.63)#3,655 |
| 51. | Caseville | 13.7% | 5.7%(+7.97)#51 | 6.4%(+7.35)#3,769 |
| 52. | Three Lakes | 13.6% | 5.7%(+7.83)#52 | 6.4%(+7.21)#3,826 |
| 53. | Copper City | 13.3% | 5.7%(+7.60)#53 | 6.4%(+6.98)#3,930 |
| 54. | Iron River | 13.3% | 5.7%(+7.52)#54 | 6.4%(+6.90)#3,971 |
| 55. | Hillman | 13.1% | 5.7%(+7.39)#55 | 6.4%(+6.76)#4,027 |
| 56. | Homer | 12.9% | 5.7%(+7.20)#56 | 6.4%(+6.58)#4,111 |
| 57. | Stronach | 12.9% | 5.7%(+7.17)#57 | 6.4%(+6.55)#4,131 |
| 58. | Leland | 12.8% | 5.7%(+7.11)#58 | 6.4%(+6.48)#4,157 |
| 59. | Mattawan | 12.4% | 5.7%(+6.64)#59 | 6.4%(+6.02)#4,422 |
| 60. | East Tawas | 12.4% | 5.7%(+6.63)#60 | 6.4%(+6.01)#4,431 |
| 61. | Walloon Lake | 12.3% | 5.7%(+6.58)#61 | 6.4%(+5.95)#4,450 |
| 62. | Kalkaska | 12.2% | 5.7%(+6.50)#62 | 6.4%(+5.88)#4,493 |
| 63. | Metamora | 12.2% | 5.7%(+6.47)#63 | 6.4%(+5.84)#4,515 |
| 64. | Imlay City | 12.1% | 5.7%(+6.38)#64 | 6.4%(+5.75)#4,556 |
| 65. | Springport | 11.9% | 5.7%(+6.18)#65 | 6.4%(+5.55)#4,666 |
| 66. | Gladstone | 11.9% | 5.7%(+6.14)#66 | 6.4%(+5.52)#4,685 |
| 67. | Munising | 11.8% | 5.7%(+6.11)#67 | 6.4%(+5.49)#4,700 |
| 68. | Reading | 11.8% | 5.7%(+6.10)#68 | 6.4%(+5.47)#4,709 |
| 69. | Okemos | 11.8% | 5.7%(+6.06)#69 | 6.4%(+5.43)#4,725 |
| 70. | Bath | 11.6% | 5.7%(+5.86)#70 | 6.4%(+5.23)#4,850 |
| 71. | Dowling | 11.5% | 5.7%(+5.81)#71 | 6.4%(+5.18)#4,877 |
| 72. | Paw Paw | 11.2% | 5.7%(+5.47)#72 | 6.4%(+4.84)#5,072 |
| 73. | Lake Victoria | 11.2% | 5.7%(+5.44)#73 | 6.4%(+4.81)#5,087 |
| 74. | Litchfield | 11.0% | 5.7%(+5.23)#74 | 6.4%(+4.61)#5,247 |
| 75. | Ann Arbor | 10.9% | 5.7%(+5.21)#75 | 6.4%(+4.59)#5,260 |
| 76. | Brimley | 10.9% | 5.7%(+5.21)#76 | 6.4%(+4.58)#5,267 |
| 77. | Gaastra | 10.7% | 5.7%(+4.99)#77 | 6.4%(+4.36)#5,450 |
| 78. | Village Of Grosse Pointe Shores | 10.7% | 5.7%(+4.98)#78 | 6.4%(+4.36)#5,455 |
| 79. | Wakefield | 10.6% | 5.7%(+4.88)#79 | 6.4%(+4.25)#5,515 |
| 80. | New Haven | 10.5% | 5.7%(+4.82)#80 | 6.4%(+4.19)#5,553 |
| 81. | Hesperia | 10.5% | 5.7%(+4.80)#81 | 6.4%(+4.17)#5,572 |
| 82. | Republic | 10.5% | 5.7%(+4.80)#82 | 6.4%(+4.17)#5,586 |
| 83. | Cadillac | 10.4% | 5.7%(+4.66)#83 | 6.4%(+4.04)#5,691 |
| 84. | Maple City | 10.3% | 5.7%(+4.62)#84 | 6.4%(+3.99)#5,726 |
| 85. | Manchester | 10.2% | 5.7%(+4.51)#85 | 6.4%(+3.89)#5,800 |
| 86. | Dexter | 10.0% | 5.7%(+4.27)#86 | 6.4%(+3.64)#6,025 |
| 87. | Big Rapids | 9.9% | 5.7%(+4.15)#87 | 6.4%(+3.53)#6,086 |
| 88. | Ewen | 9.8% | 5.7%(+4.07)#88 | 6.4%(+3.45)#6,156 |
| 89. | Boyne Falls | 9.8% | 5.7%(+4.03)#89 | 6.4%(+3.40)#6,191 |
| 90. | Painesdale | 9.7% | 5.7%(+3.95)#90 | 6.4%(+3.32)#6,264 |
| 91. | Charlotte | 9.7% | 5.7%(+3.93)#91 | 6.4%(+3.31)#6,275 |
| 92. | Dimondale | 9.6% | 5.7%(+3.89)#92 | 6.4%(+3.27)#6,321 |
| 93. | Sheridan | 9.6% | 5.7%(+3.89)#93 | 6.4%(+3.26)#6,329 |
| 94. | Bad Axe | 9.5% | 5.7%(+3.79)#94 | 6.4%(+3.17)#6,394 |
| 95. | Shorewood Tower Hills Harbert | 9.5% | 5.7%(+3.79)#95 | 6.4%(+3.17)#6,398 |
| 96. | Marshall | 9.5% | 5.7%(+3.79)#96 | 6.4%(+3.17)#6,428 |
| 97. | Croswell | 9.5% | 5.7%(+3.72)#97 | 6.4%(+3.10)#6,488 |
| 98. | Ishpeming | 9.4% | 5.7%(+3.63)#98 | 6.4%(+3.01)#6,580 |
| 99. | Webberville | 9.3% | 5.7%(+3.59)#99 | 6.4%(+2.97)#6,628 |
| 100. | Wayland | 9.3% | 5.7%(+3.59)#100 | 6.4%(+2.97)#6,631 |
Common Questions
What are the Top 10 Cities with the Highest Percentage of Population with a Degree in Bio, Nature & Agricultural in Michigan?
Top 10 Cities with the Highest Percentage of Population with a Degree in Bio, Nature & Agricultural in Michigan are:
#1
65.7%
#2
35.1%
#3
33.3%
#4
33.3%
#5
28.6%
#6
28.1%
#7
28.0%
#8
27.3%
#9
26.7%
#10
26.4%
What city has the Highest Percentage of Population with a Degree in Bio, Nature & Agricultural in Michigan?
Vanderbilt has the Highest Percentage of Population with a Degree in Bio, Nature & Agricultural in Michigan with 65.7%.
What is the Percentage of Population with a Degree in Bio, Nature & Agricultural in the State of Michigan?
Percentage of Population with a Degree in Bio, Nature & Agricultural in Michigan is 5.7%.
What is the Percentage of Population with a Degree in Bio, Nature & Agricultural in the United States?
Percentage of Population with a Degree in Bio, Nature & Agricultural in the United States is 6.4%.