Cities with the Most Immigrants from Argentina in Michigan
RELATED REPORTS & OPTIONS
Argentina
Michigan
Compare Cities
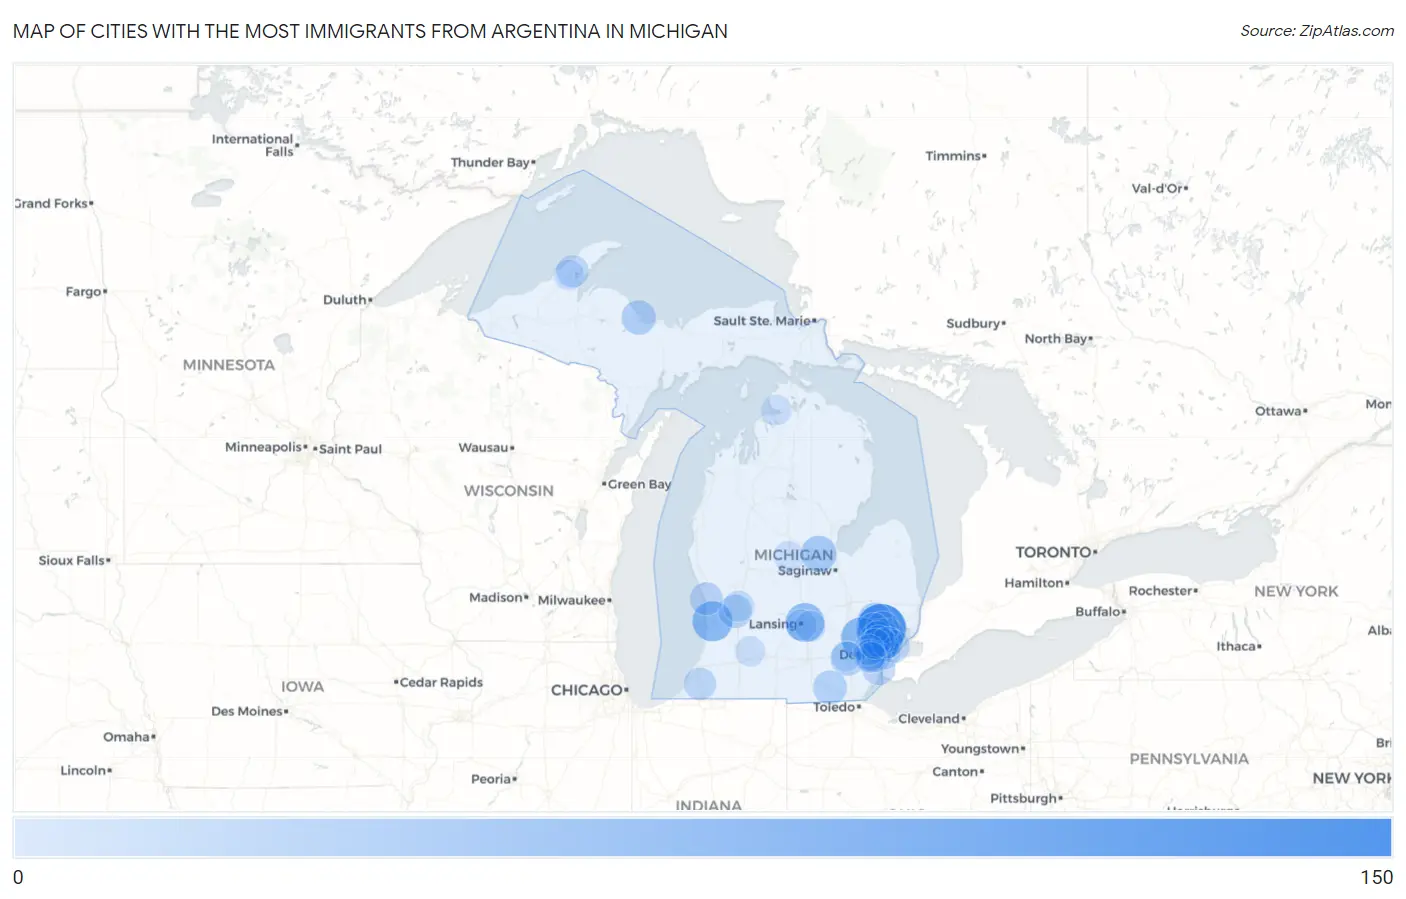
Map of Cities with the Most Immigrants from Argentina in Michigan
0
150
Cities with the Most Immigrants from Argentina in Michigan
| City | Argentina | vs State | vs National | |
| 1. | Rochester Hills | 141 | 1,346(10.48%)#1 | 200,110(0.07%)#229 |
| 2. | Royal Oak | 77 | 1,346(5.72%)#2 | 200,110(0.04%)#447 |
| 3. | Wolverine Lake | 72 | 1,346(5.35%)#3 | 200,110(0.04%)#479 |
| 4. | Holland | 71 | 1,346(5.27%)#4 | 200,110(0.04%)#482 |
| 5. | East Lansing | 62 | 1,346(4.61%)#5 | 200,110(0.03%)#542 |
| 6. | Midland | 40 | 1,346(2.97%)#6 | 200,110(0.02%)#782 |
| 7. | Lake Orion | 30 | 1,346(2.23%)#7 | 200,110(0.01%)#980 |
| 8. | Marquette | 29 | 1,346(2.15%)#8 | 200,110(0.01%)#991 |
| 9. | Ann Arbor | 26 | 1,346(1.93%)#9 | 200,110(0.01%)#1,041 |
| 10. | Adrian | 26 | 1,346(1.93%)#10 | 200,110(0.01%)#1,054 |
| 11. | Sterling Heights | 24 | 1,346(1.78%)#11 | 200,110(0.01%)#1,105 |
| 12. | Wyoming | 23 | 1,346(1.71%)#12 | 200,110(0.01%)#1,136 |
| 13. | Detroit | 22 | 1,346(1.63%)#13 | 200,110(0.01%)#1,163 |
| 14. | Trenton | 19 | 1,346(1.41%)#14 | 200,110(0.01%)#1,278 |
| 15. | Grand Haven | 19 | 1,346(1.41%)#15 | 200,110(0.01%)#1,282 |
| 16. | Troy | 16 | 1,346(1.19%)#16 | 200,110(0.01%)#1,375 |
| 17. | Birmingham | 16 | 1,346(1.19%)#17 | 200,110(0.01%)#1,393 |
| 18. | Harper Woods | 16 | 1,346(1.19%)#18 | 200,110(0.01%)#1,396 |
| 19. | Ferndale | 15 | 1,346(1.11%)#19 | 200,110(0.01%)#1,437 |
| 20. | Rochester | 15 | 1,346(1.11%)#20 | 200,110(0.01%)#1,442 |
| 21. | Houghton | 15 | 1,346(1.11%)#21 | 200,110(0.01%)#1,445 |
| 22. | Berrien Springs | 15 | 1,346(1.11%)#22 | 200,110(0.01%)#1,456 |
| 23. | Westland | 14 | 1,346(1.04%)#23 | 200,110(0.01%)#1,467 |
| 24. | Dearborn Heights | 11 | 1,346(0.82%)#24 | 200,110(0.01%)#1,617 |
| 25. | Auburn Hills | 11 | 1,346(0.82%)#25 | 200,110(0.01%)#1,627 |
| 26. | Berkley | 11 | 1,346(0.82%)#26 | 200,110(0.01%)#1,635 |
| 27. | Garden City | 9 | 1,346(0.67%)#27 | 200,110(0.00%)#1,746 |
| 28. | Warren | 8 | 1,346(0.59%)#28 | 200,110(0.00%)#1,786 |
| 29. | Grand Rapids | 6 | 1,346(0.45%)#29 | 200,110(0.00%)#1,909 |
| 30. | Lansing | 6 | 1,346(0.45%)#30 | 200,110(0.00%)#1,911 |
| 31. | Okemos | 6 | 1,346(0.45%)#31 | 200,110(0.00%)#1,926 |
| 32. | Livonia | 5 | 1,346(0.37%)#32 | 200,110(0.00%)#1,970 |
| 33. | Inkster | 4 | 1,346(0.30%)#33 | 200,110(0.00%)#2,022 |
| 34. | Mount Pleasant | 3 | 1,346(0.22%)#34 | 200,110(0.00%)#2,074 |
| 35. | Harbor Springs | 3 | 1,346(0.22%)#35 | 200,110(0.00%)#2,095 |
| 36. | Richland | 2 | 1,346(0.15%)#36 | 200,110(0.00%)#2,127 |
| 37. | South Range | 2 | 1,346(0.15%)#37 | 200,110(0.00%)#2,138 |
| 38. | Southfield | 1 | 1,346(0.07%)#38 | 200,110(0.00%)#2,150 |
| 39. | Barton Hills | 1 | 1,346(0.07%)#39 | 200,110(0.00%)#2,178 |
Common Questions
What are the Top 10 Cities with the Most Immigrants from Argentina in Michigan?
Top 10 Cities with the Most Immigrants from Argentina in Michigan are:
#1
141
#2
77
#3
72
#4
71
#5
62
#6
40
#7
30
#8
29
#9
26
#10
26
What city has the Most Immigrants from Argentina in Michigan?
Rochester Hills has the Most Immigrants from Argentina in Michigan with 141.
What is the Total Immigrants from Argentina in the State of Michigan?
Total Immigrants from Argentina in Michigan is 1,346.
What is the Total Immigrants from Argentina in the United States?
Total Immigrants from Argentina in the United States is 200,110.