Cities with the Highest Percentage of Immigrants from Europe in Michigan
RELATED REPORTS & OPTIONS
Europe
Michigan
Compare Cities
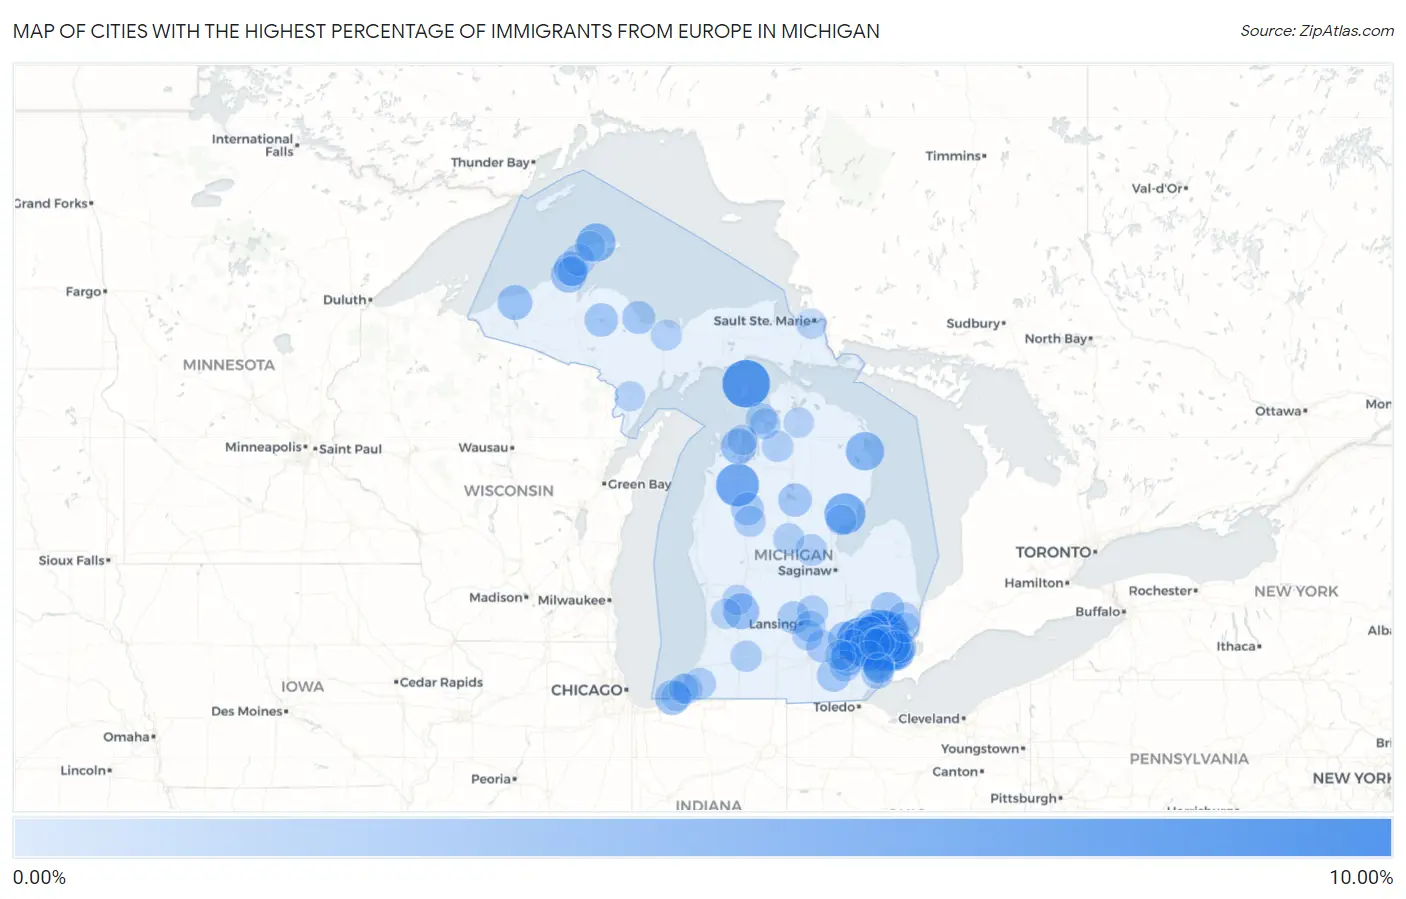
Map of Cities with the Highest Percentage of Immigrants from Europe in Michigan
0.00%
10.00%
Cities with the Highest Percentage of Immigrants from Europe in Michigan
| City | Europe | vs State | vs National | |
| 1. | Bingham Farms | 8.69% | 1.24%(+7.45)#1 | 1.46%(+7.23)#294 |
| 2. | St James | 7.96% | 1.24%(+6.72)#2 | 1.46%(+6.51)#363 |
| 3. | Wixom | 6.58% | 1.24%(+5.34)#3 | 1.46%(+5.12)#545 |
| 4. | Buckley | 6.18% | 1.24%(+4.94)#4 | 1.46%(+4.72)#629 |
| 5. | Hamtramck | 5.97% | 1.24%(+4.73)#5 | 1.46%(+4.51)#680 |
| 6. | Sterling Heights | 5.70% | 1.24%(+4.46)#6 | 1.46%(+4.24)#749 |
| 7. | Turner | 5.41% | 1.24%(+4.16)#7 | 1.46%(+3.95)#846 |
| 8. | Northville | 4.83% | 1.24%(+3.59)#8 | 1.46%(+3.37)#1,022 |
| 9. | Grosse Pointe | 4.82% | 1.24%(+3.58)#9 | 1.46%(+3.37)#1,026 |
| 10. | Utica | 4.75% | 1.24%(+3.51)#10 | 1.46%(+3.30)#1,061 |
| 11. | Eagle Harbor | 4.48% | 1.24%(+3.24)#11 | 1.46%(+3.02)#1,195 |
| 12. | Ossineke | 4.46% | 1.24%(+3.22)#12 | 1.46%(+3.00)#1,205 |
| 13. | Bloomfield Hills | 4.34% | 1.24%(+3.10)#13 | 1.46%(+2.88)#1,255 |
| 14. | Grosse Pointe Park | 4.20% | 1.24%(+2.96)#14 | 1.46%(+2.75)#1,307 |
| 15. | Walled Lake | 4.12% | 1.24%(+2.88)#15 | 1.46%(+2.66)#1,351 |
| 16. | Birmingham | 4.01% | 1.24%(+2.77)#16 | 1.46%(+2.56)#1,407 |
| 17. | Rochester Hills | 3.91% | 1.24%(+2.67)#17 | 1.46%(+2.45)#1,465 |
| 18. | Orchard Lake Village | 3.89% | 1.24%(+2.64)#18 | 1.46%(+2.43)#1,486 |
| 19. | Troy | 3.82% | 1.24%(+2.58)#19 | 1.46%(+2.36)#1,527 |
| 20. | Kentwood | 3.51% | 1.24%(+2.27)#20 | 1.46%(+2.06)#1,745 |
| 21. | Suttons Bay | 3.43% | 1.24%(+2.19)#21 | 1.46%(+1.97)#1,810 |
| 22. | South Range | 3.34% | 1.24%(+2.10)#22 | 1.46%(+1.88)#1,889 |
| 23. | Keego Harbor | 3.25% | 1.24%(+2.01)#23 | 1.46%(+1.79)#1,958 |
| 24. | Rochester | 3.20% | 1.24%(+1.96)#24 | 1.46%(+1.74)#2,002 |
| 25. | Michiana | 3.16% | 1.24%(+1.92)#25 | 1.46%(+1.70)#2,040 |
| 26. | White Pine | 3.13% | 1.24%(+1.89)#26 | 1.46%(+1.68)#2,060 |
| 27. | Fraser | 3.13% | 1.24%(+1.89)#27 | 1.46%(+1.67)#2,062 |
| 28. | Hancock | 3.03% | 1.24%(+1.79)#28 | 1.46%(+1.57)#2,168 |
| 29. | Novi | 3.02% | 1.24%(+1.78)#29 | 1.46%(+1.57)#2,172 |
| 30. | Brighton | 2.89% | 1.24%(+1.64)#30 | 1.46%(+1.43)#2,308 |
| 31. | Center Line | 2.88% | 1.24%(+1.64)#31 | 1.46%(+1.43)#2,310 |
| 32. | Lake Angelus | 2.79% | 1.24%(+1.55)#32 | 1.46%(+1.33)#2,431 |
| 33. | Ann Arbor | 2.78% | 1.24%(+1.54)#33 | 1.46%(+1.32)#2,440 |
| 34. | Farmington Hills | 2.68% | 1.24%(+1.44)#34 | 1.46%(+1.22)#2,555 |
| 35. | Clinton | 2.66% | 1.24%(+1.42)#35 | 1.46%(+1.21)#2,577 |
| 36. | Michigamme | 2.65% | 1.24%(+1.41)#36 | 1.46%(+1.20)#2,589 |
| 37. | Wolverine Lake | 2.65% | 1.24%(+1.41)#37 | 1.46%(+1.19)#2,600 |
| 38. | Prudenville | 2.62% | 1.24%(+1.38)#38 | 1.46%(+1.16)#2,638 |
| 39. | Almont | 2.62% | 1.24%(+1.38)#39 | 1.46%(+1.16)#2,640 |
| 40. | Farmington | 2.59% | 1.24%(+1.35)#40 | 1.46%(+1.14)#2,678 |
| 41. | Clawson | 2.56% | 1.24%(+1.32)#41 | 1.46%(+1.11)#2,722 |
| 42. | Pleasant Ridge | 2.49% | 1.24%(+1.25)#42 | 1.46%(+1.04)#2,820 |
| 43. | Livonia | 2.48% | 1.24%(+1.24)#43 | 1.46%(+1.02)#2,849 |
| 44. | Marquette | 2.45% | 1.24%(+1.21)#44 | 1.46%(+0.997)#2,880 |
| 45. | Franklin | 2.45% | 1.24%(+1.21)#45 | 1.46%(+0.994)#2,885 |
| 46. | Wedgewood | 2.40% | 1.24%(+1.16)#46 | 1.46%(+0.944)#2,935 |
| 47. | St Clair Shores | 2.38% | 1.24%(+1.14)#47 | 1.46%(+0.921)#2,971 |
| 48. | Beverly Hills | 2.37% | 1.24%(+1.13)#48 | 1.46%(+0.914)#2,978 |
| 49. | Auburn Hills | 2.32% | 1.24%(+1.08)#49 | 1.46%(+0.866)#3,061 |
| 50. | Stockbridge | 2.30% | 1.24%(+1.06)#50 | 1.46%(+0.848)#3,092 |
| 51. | Gibraltar | 2.28% | 1.24%(+1.04)#51 | 1.46%(+0.827)#3,121 |
| 52. | Warren | 2.27% | 1.24%(+1.03)#52 | 1.46%(+0.813)#3,138 |
| 53. | Dearborn Heights | 2.26% | 1.24%(+1.02)#53 | 1.46%(+0.807)#3,143 |
| 54. | Wacousta | 2.24% | 1.24%(+0.996)#54 | 1.46%(+0.781)#3,190 |
| 55. | Village Of Grosse Pointe Shores | 2.18% | 1.24%(+0.943)#55 | 1.46%(+0.728)#3,287 |
| 56. | Calumet | 2.09% | 1.24%(+0.845)#56 | 1.46%(+0.630)#3,441 |
| 57. | Berrien Springs | 2.08% | 1.24%(+0.836)#57 | 1.46%(+0.621)#3,460 |
| 58. | Southgate | 2.06% | 1.24%(+0.819)#58 | 1.46%(+0.604)#3,486 |
| 59. | Sylvan Lake | 2.02% | 1.24%(+0.784)#59 | 1.46%(+0.568)#3,554 |
| 60. | Sanford | 1.98% | 1.24%(+0.741)#60 | 1.46%(+0.526)#3,649 |
| 61. | Plymouth | 1.96% | 1.24%(+0.716)#61 | 1.46%(+0.501)#3,713 |
| 62. | Laingsburg | 1.89% | 1.24%(+0.653)#62 | 1.46%(+0.438)#3,831 |
| 63. | South Lyon | 1.89% | 1.24%(+0.651)#63 | 1.46%(+0.436)#3,836 |
| 64. | Le Roy | 1.88% | 1.24%(+0.637)#64 | 1.46%(+0.422)#3,860 |
| 65. | Comstock Northwest | 1.87% | 1.24%(+0.630)#65 | 1.46%(+0.415)#3,876 |
| 66. | Okemos | 1.87% | 1.24%(+0.630)#66 | 1.46%(+0.415)#3,877 |
| 67. | Madison Heights | 1.87% | 1.24%(+0.628)#67 | 1.46%(+0.413)#3,886 |
| 68. | Alba | 1.86% | 1.24%(+0.620)#68 | 1.46%(+0.405)#3,896 |
| 69. | Charlevoix | 1.86% | 1.24%(+0.619)#69 | 1.46%(+0.403)#3,898 |
| 70. | Huntington Woods | 1.84% | 1.24%(+0.597)#70 | 1.46%(+0.382)#3,951 |
| 71. | Clare | 1.81% | 1.24%(+0.571)#71 | 1.46%(+0.356)#4,012 |
| 72. | Royal Oak | 1.81% | 1.24%(+0.568)#72 | 1.46%(+0.353)#4,015 |
| 73. | Oak Park | 1.79% | 1.24%(+0.553)#73 | 1.46%(+0.338)#4,047 |
| 74. | Richmond | 1.78% | 1.24%(+0.536)#74 | 1.46%(+0.321)#4,080 |
| 75. | Grosse Pointe Woods | 1.78% | 1.24%(+0.534)#75 | 1.46%(+0.319)#4,090 |
| 76. | Mason | 1.77% | 1.24%(+0.534)#76 | 1.46%(+0.319)#4,092 |
| 77. | Ironton | 1.74% | 1.24%(+0.503)#77 | 1.46%(+0.288)#4,169 |
| 78. | Chatham | 1.72% | 1.24%(+0.483)#78 | 1.46%(+0.268)#4,207 |
| 79. | Westland | 1.71% | 1.24%(+0.473)#79 | 1.46%(+0.257)#4,229 |
| 80. | Mohawk | 1.71% | 1.24%(+0.469)#80 | 1.46%(+0.254)#4,242 |
| 81. | Saline | 1.69% | 1.24%(+0.453)#81 | 1.46%(+0.238)#4,287 |
| 82. | Trenton | 1.68% | 1.24%(+0.437)#82 | 1.46%(+0.222)#4,320 |
| 83. | New Troy | 1.63% | 1.24%(+0.394)#83 | 1.46%(+0.179)#4,417 |
| 84. | Omer | 1.63% | 1.24%(+0.392)#84 | 1.46%(+0.177)#4,424 |
| 85. | Omena | 1.60% | 1.24%(+0.359)#85 | 1.46%(+0.144)#4,513 |
| 86. | Eagle River | 1.59% | 1.24%(+0.347)#86 | 1.46%(+0.131)#4,567 |
| 87. | Barton Hills | 1.58% | 1.24%(+0.336)#87 | 1.46%(+0.121)#4,598 |
| 88. | Comstock Park | 1.53% | 1.24%(+0.291)#88 | 1.46%(+0.076)#4,711 |
| 89. | Riverview | 1.53% | 1.24%(+0.285)#89 | 1.46%(+0.070)#4,736 |
| 90. | Hartland | 1.52% | 1.24%(+0.276)#90 | 1.46%(+0.061)#4,765 |
| 91. | Dexter | 1.51% | 1.24%(+0.269)#91 | 1.46%(+0.054)#4,782 |
| 92. | Sault Ste Marie | 1.51% | 1.24%(+0.266)#92 | 1.46%(+0.051)#4,793 |
| 93. | Southfield | 1.50% | 1.24%(+0.254)#93 | 1.46%(+0.039)#4,829 |
| 94. | Hudsonville | 1.49% | 1.24%(+0.253)#94 | 1.46%(+0.038)#4,838 |
| 95. | Houghton | 1.49% | 1.24%(+0.253)#95 | 1.46%(+0.038)#4,839 |
| 96. | New Baltimore | 1.47% | 1.24%(+0.230)#96 | 1.46%(+0.015)#4,905 |
| 97. | Carney | 1.47% | 1.24%(+0.230)#97 | 1.46%(+0.015)#4,911 |
| 98. | New Buffalo | 1.47% | 1.24%(+0.228)#98 | 1.46%(+0.013)#4,919 |
| 99. | Shorewood Tower Hills Harbert | 1.47% | 1.24%(+0.225)#99 | 1.46%(+0.010)#4,928 |
| 100. | Wolverine | 1.46% | 1.24%(+0.223)#100 | 1.46%(+0.008)#4,934 |
Common Questions
What are the Top 10 Cities with the Highest Percentage of Immigrants from Europe in Michigan?
Top 10 Cities with the Highest Percentage of Immigrants from Europe in Michigan are:
#1
8.69%
#2
7.96%
#3
6.58%
#4
6.18%
#5
5.97%
#6
5.70%
#7
5.41%
#8
4.83%
#9
4.82%
#10
4.75%
What city has the Highest Percentage of Immigrants from Europe in Michigan?
Bingham Farms has the Highest Percentage of Immigrants from Europe in Michigan with 8.69%.
What is the Percentage of Immigrants from Europe in the State of Michigan?
Percentage of Immigrants from Europe in Michigan is 1.24%.
What is the Percentage of Immigrants from Europe in the United States?
Percentage of Immigrants from Europe in the United States is 1.46%.