Cities with the Highest Percentage of Immigrants from Latin America in Michigan
RELATED REPORTS & OPTIONS
Latin America
Michigan
Compare Cities
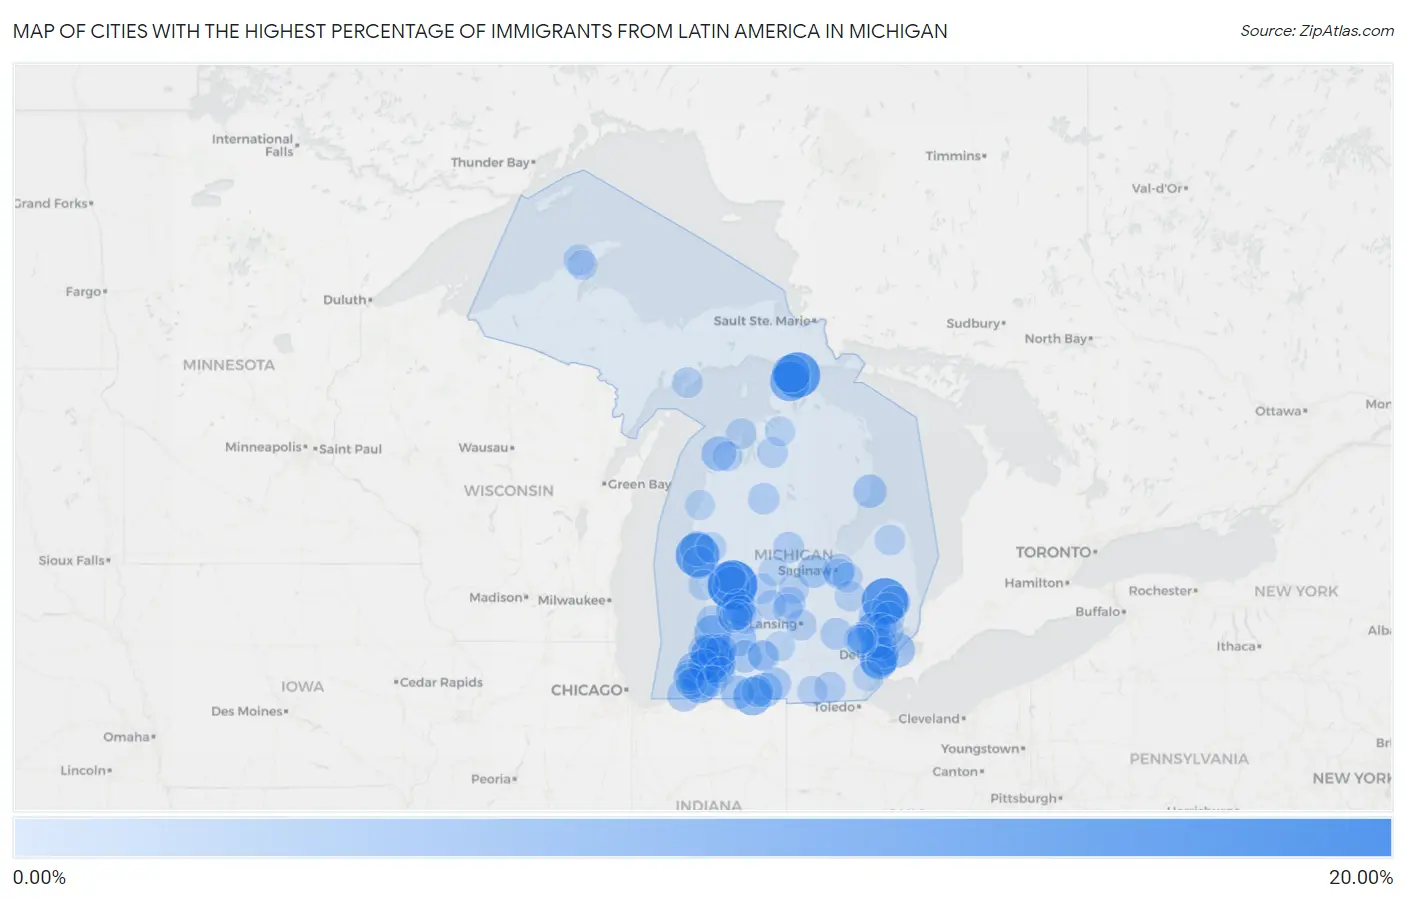
Map of Cities with the Highest Percentage of Immigrants from Latin America in Michigan
0.00%
20.00%
Cities with the Highest Percentage of Immigrants from Latin America in Michigan
| City | Latin America | vs State | vs National | |
| 1. | Kent City | 19.80% | 1.29%(+18.5)#-1 | 6.84%(+13.0)#0 |
| 2. | Imlay City | 16.71% | 1.29%(+15.4)#0 | 6.84%(+9.87)#1 |
| 3. | Mackinac Island | 16.03% | 1.29%(+14.7)#14 | 6.84%(+9.19)#958 |
| 4. | Shelby | 14.37% | 1.29%(+13.1)#15 | 6.84%(+7.52)#959 |
| 5. | Bangor | 14.02% | 1.29%(+12.7)#16 | 6.84%(+7.18)#960 |
| 6. | Mackinaw City | 10.84% | 1.29%(+9.55)#17 | 6.84%(+4.00)#961 |
| 7. | Berrien Springs | 9.64% | 1.29%(+8.36)#18 | 6.84%(+2.80)#962 |
| 8. | Sturgis | 9.27% | 1.29%(+7.98)#19 | 6.84%(+2.43)#963 |
| 9. | Lawrence | 9.24% | 1.29%(+7.95)#20 | 6.84%(+2.39)#964 |
| 10. | St Ignace | 9.05% | 1.29%(+7.76)#21 | 6.84%(+2.21)#965 |
| 11. | Melvindale | 8.89% | 1.29%(+7.60)#22 | 6.84%(+2.05)#966 |
| 12. | Wyoming | 8.61% | 1.29%(+7.32)#23 | 6.84%(+1.77)#967 |
| 13. | Falmouth | 8.30% | 1.29%(+7.01)#24 | 6.84%(+1.46)#968 |
| 14. | Casnovia | 8.03% | 1.29%(+6.74)#25 | 6.84%(+1.19)#969 |
| 15. | Hartford | 7.99% | 1.29%(+6.70)#26 | 6.84%(+1.15)#970 |
| 16. | Fennville | 7.89% | 1.29%(+6.60)#27 | 6.84%(+1.05)#971 |
| 17. | Lincoln Park | 7.66% | 1.29%(+6.37)#36 | 6.84%(+0.819)#2,307 |
| 18. | Benton Heights | 7.36% | 1.29%(+6.07)#37 | 6.84%(+0.520)#2,308 |
| 19. | Grosse Pointe Farms | 6.29% | 1.29%(+5.00)#38 | 6.84%(-0.552)#2,309 |
| 20. | Hart | 6.17% | 1.29%(+4.88)#39 | 6.84%(-0.674)#2,310 |
| 21. | Glen Arbor | 5.90% | 1.29%(+4.62)#40 | 6.84%(-0.937)#2,311 |
| 22. | Martin | 5.85% | 1.29%(+4.56)#41 | 6.84%(-0.992)#2,312 |
| 23. | Bronson | 5.72% | 1.29%(+4.43)#42 | 6.84%(-1.12)#2,313 |
| 24. | Eau Claire | 5.63% | 1.29%(+4.34)#43 | 6.84%(-1.21)#2,314 |
| 25. | Pontiac | 5.38% | 1.29%(+4.09)#51 | 6.84%(-1.46)#2,818 |
| 26. | Grand Rapids | 5.25% | 1.29%(+3.96)#52 | 6.84%(-1.59)#2,819 |
| 27. | Palo | 5.16% | 1.29%(+3.87)#53 | 6.84%(-1.68)#2,820 |
| 28. | Constantine | 5.01% | 1.29%(+3.72)#54 | 6.84%(-1.83)#2,821 |
| 29. | Oscoda | 4.79% | 1.29%(+3.50)#55 | 6.84%(-2.05)#2,822 |
| 30. | Capac | 4.74% | 1.29%(+3.45)#56 | 6.84%(-2.10)#2,823 |
| 31. | Breedsville | 4.67% | 1.29%(+3.38)#57 | 6.84%(-2.17)#2,824 |
| 32. | Three Oaks | 4.56% | 1.29%(+3.27)#58 | 6.84%(-2.28)#2,825 |
| 33. | Merrill | 4.45% | 1.29%(+3.17)#59 | 6.84%(-2.39)#2,826 |
| 34. | Mears | 4.35% | 1.29%(+3.06)#60 | 6.84%(-2.49)#2,827 |
| 35. | Rothbury | 4.23% | 1.29%(+2.94)#61 | 6.84%(-2.62)#2,828 |
| 36. | Eastwood | 4.08% | 1.29%(+2.79)#62 | 6.84%(-2.76)#2,829 |
| 37. | Buena Vista | 4.04% | 1.29%(+2.75)#63 | 6.84%(-2.80)#2,830 |
| 38. | Auburn Hills | 4.03% | 1.29%(+2.75)#64 | 6.84%(-2.81)#2,996 |
| 39. | River Rouge | 3.97% | 1.29%(+2.68)#65 | 6.84%(-2.87)#2,997 |
| 40. | Coldwater | 3.90% | 1.29%(+2.61)#66 | 6.84%(-2.94)#2,998 |
| 41. | Oxford | 3.76% | 1.29%(+2.47)#67 | 6.84%(-3.08)#2,999 |
| 42. | Ramsay | 3.68% | 1.29%(+2.39)#68 | 6.84%(-3.16)#3,000 |
| 43. | Almont | 3.61% | 1.29%(+2.32)#69 | 6.84%(-3.23)#3,001 |
| 44. | Burr Oak | 3.54% | 1.29%(+2.25)#70 | 6.84%(-3.30)#3,002 |
| 45. | Howell | 3.32% | 1.29%(+2.03)#71 | 6.84%(-3.52)#3,003 |
| 46. | Holland | 3.28% | 1.29%(+1.99)#72 | 6.84%(-3.56)#3,004 |
| 47. | Shoreham | 3.26% | 1.29%(+1.97)#73 | 6.84%(-3.58)#3,005 |
| 48. | Pleasant Ridge | 3.18% | 1.29%(+1.89)#74 | 6.84%(-3.66)#3,006 |
| 49. | Cambria | 3.14% | 1.29%(+1.85)#75 | 6.84%(-3.70)#3,007 |
| 50. | Romeo | 3.14% | 1.29%(+1.85)#76 | 6.84%(-3.70)#3,008 |
| 51. | Lake City | 3.13% | 1.29%(+1.85)#77 | 6.84%(-3.71)#3,009 |
| 52. | Grant | 3.04% | 1.29%(+1.76)#78 | 6.84%(-3.80)#3,010 |
| 53. | Rosebush | 2.96% | 1.29%(+1.67)#79 | 6.84%(-3.89)#3,011 |
| 54. | Bloomingdale | 2.92% | 1.29%(+1.64)#80 | 6.84%(-3.92)#3,012 |
| 55. | Adrian | 2.91% | 1.29%(+1.62)#81 | 6.84%(-3.93)#3,013 |
| 56. | Fowler | 2.84% | 1.29%(+1.55)#82 | 6.84%(-4.00)#3,014 |
| 57. | Watervliet | 2.76% | 1.29%(+1.47)#83 | 6.84%(-4.08)#3,015 |
| 58. | Lathrup Village | 2.67% | 1.29%(+1.39)#84 | 6.84%(-4.17)#3,016 |
| 59. | Rochester Hills | 2.65% | 1.29%(+1.36)#85 | 6.84%(-4.19)#3,017 |
| 60. | Calumet | 2.64% | 1.29%(+1.35)#86 | 6.84%(-4.20)#3,018 |
| 61. | Detroit | 2.58% | 1.29%(+1.29)#87 | 6.84%(-4.26)#3,139 |
| 62. | Stevensville | 2.58% | 1.29%(+1.29)#88 | 6.84%(-4.27)#3,140 |
| 63. | Lansing | 2.57% | 1.29%(+1.28)#89 | 6.84%(-4.27)#3,174 |
| 64. | South Haven | 2.53% | 1.29%(+1.24)#90 | 6.84%(-4.32)#3,175 |
| 65. | Kentwood | 2.52% | 1.29%(+1.24)#91 | 6.84%(-4.32)#3,176 |
| 66. | Decatur | 2.49% | 1.29%(+1.20)#92 | 6.84%(-4.35)#3,177 |
| 67. | Mancelona | 2.40% | 1.29%(+1.12)#93 | 6.84%(-4.44)#3,178 |
| 68. | Battle Creek | 2.38% | 1.29%(+1.09)#94 | 6.84%(-4.46)#3,179 |
| 69. | Garden | 2.37% | 1.29%(+1.08)#95 | 6.84%(-4.47)#3,180 |
| 70. | Walkerville | 2.36% | 1.29%(+1.07)#96 | 6.84%(-4.48)#3,181 |
| 71. | Baroda | 2.34% | 1.29%(+1.06)#97 | 6.84%(-4.50)#3,182 |
| 72. | Northport | 2.34% | 1.29%(+1.05)#98 | 6.84%(-4.50)#3,183 |
| 73. | Dowagiac | 2.31% | 1.29%(+1.02)#99 | 6.84%(-4.53)#3,184 |
| 74. | Bad Axe | 2.28% | 1.29%(+0.992)#100 | 6.84%(-4.56)#3,185 |
| 75. | Wolverine Lake | 2.27% | 1.29%(+0.982)#101 | 6.84%(-4.57)#3,186 |
| 76. | Bridgeport | 2.23% | 1.29%(+0.944)#102 | 6.84%(-4.61)#3,187 |
| 77. | Greenville | 2.21% | 1.29%(+0.922)#103 | 6.84%(-4.63)#3,188 |
| 78. | Muskegon | 2.19% | 1.29%(+0.903)#104 | 6.84%(-4.65)#3,189 |
| 79. | Wixom | 2.16% | 1.29%(+0.875)#105 | 6.84%(-4.68)#3,190 |
| 80. | Caledonia | 2.16% | 1.29%(+0.869)#106 | 6.84%(-4.68)#3,191 |
| 81. | Hudson | 2.14% | 1.29%(+0.849)#107 | 6.84%(-4.70)#3,192 |
| 82. | Perrinton | 2.13% | 1.29%(+0.839)#108 | 6.84%(-4.71)#3,193 |
| 83. | Byron Center | 2.10% | 1.29%(+0.815)#109 | 6.84%(-4.74)#3,194 |
| 84. | Beecher | 2.07% | 1.29%(+0.781)#110 | 6.84%(-4.77)#3,195 |
| 85. | Utica | 2.06% | 1.29%(+0.771)#111 | 6.84%(-4.78)#3,196 |
| 86. | Ecorse | 1.99% | 1.29%(+0.702)#112 | 6.84%(-4.85)#3,197 |
| 87. | Lake Linden | 1.86% | 1.29%(+0.571)#113 | 6.84%(-4.98)#3,198 |
| 88. | Ionia | 1.86% | 1.29%(+0.569)#114 | 6.84%(-4.98)#3,199 |
| 89. | Frankenmuth | 1.84% | 1.29%(+0.548)#115 | 6.84%(-5.00)#3,200 |
| 90. | Maple City | 1.83% | 1.29%(+0.541)#116 | 6.84%(-5.01)#3,201 |
| 91. | Springfield | 1.82% | 1.29%(+0.534)#117 | 6.84%(-5.02)#3,202 |
| 92. | Cutlerville | 1.79% | 1.29%(+0.506)#118 | 6.84%(-5.05)#3,203 |
| 93. | Westphalia | 1.79% | 1.29%(+0.497)#119 | 6.84%(-5.06)#3,204 |
| 94. | Edmore | 1.76% | 1.29%(+0.475)#120 | 6.84%(-5.08)#3,205 |
| 95. | Novi | 1.76% | 1.29%(+0.472)#121 | 6.84%(-5.08)#3,206 |
| 96. | Boyne Falls | 1.76% | 1.29%(+0.471)#122 | 6.84%(-5.08)#3,207 |
| 97. | Olivet | 1.75% | 1.29%(+0.466)#123 | 6.84%(-5.09)#3,208 |
| 98. | Manistee | 1.74% | 1.29%(+0.456)#124 | 6.84%(-5.10)#3,209 |
| 99. | Carleton | 1.73% | 1.29%(+0.444)#125 | 6.84%(-5.11)#3,210 |
| 100. | Walled Lake | 1.72% | 1.29%(+0.433)#126 | 6.84%(-5.12)#3,211 |
Common Questions
What are the Top 10 Cities with the Highest Percentage of Immigrants from Latin America in Michigan?
Top 10 Cities with the Highest Percentage of Immigrants from Latin America in Michigan are:
#1
19.80%
#2
16.71%
#3
16.03%
#4
14.37%
#5
14.02%
#6
10.84%
#7
9.64%
#8
9.27%
#9
9.24%
#10
9.05%
What city has the Highest Percentage of Immigrants from Latin America in Michigan?
Kent City has the Highest Percentage of Immigrants from Latin America in Michigan with 19.80%.
What is the Percentage of Immigrants from Latin America in the State of Michigan?
Percentage of Immigrants from Latin America in Michigan is 1.29%.
What is the Percentage of Immigrants from Latin America in the United States?
Percentage of Immigrants from Latin America in the United States is 6.84%.