Cities with the Lowest Unemployment Rate Amomg Youth Under the Age of 25 in Michigan
RELATED REPORTS & OPTIONS
Lowest Unemployment | Youth < 25
Michigan
Compare Cities
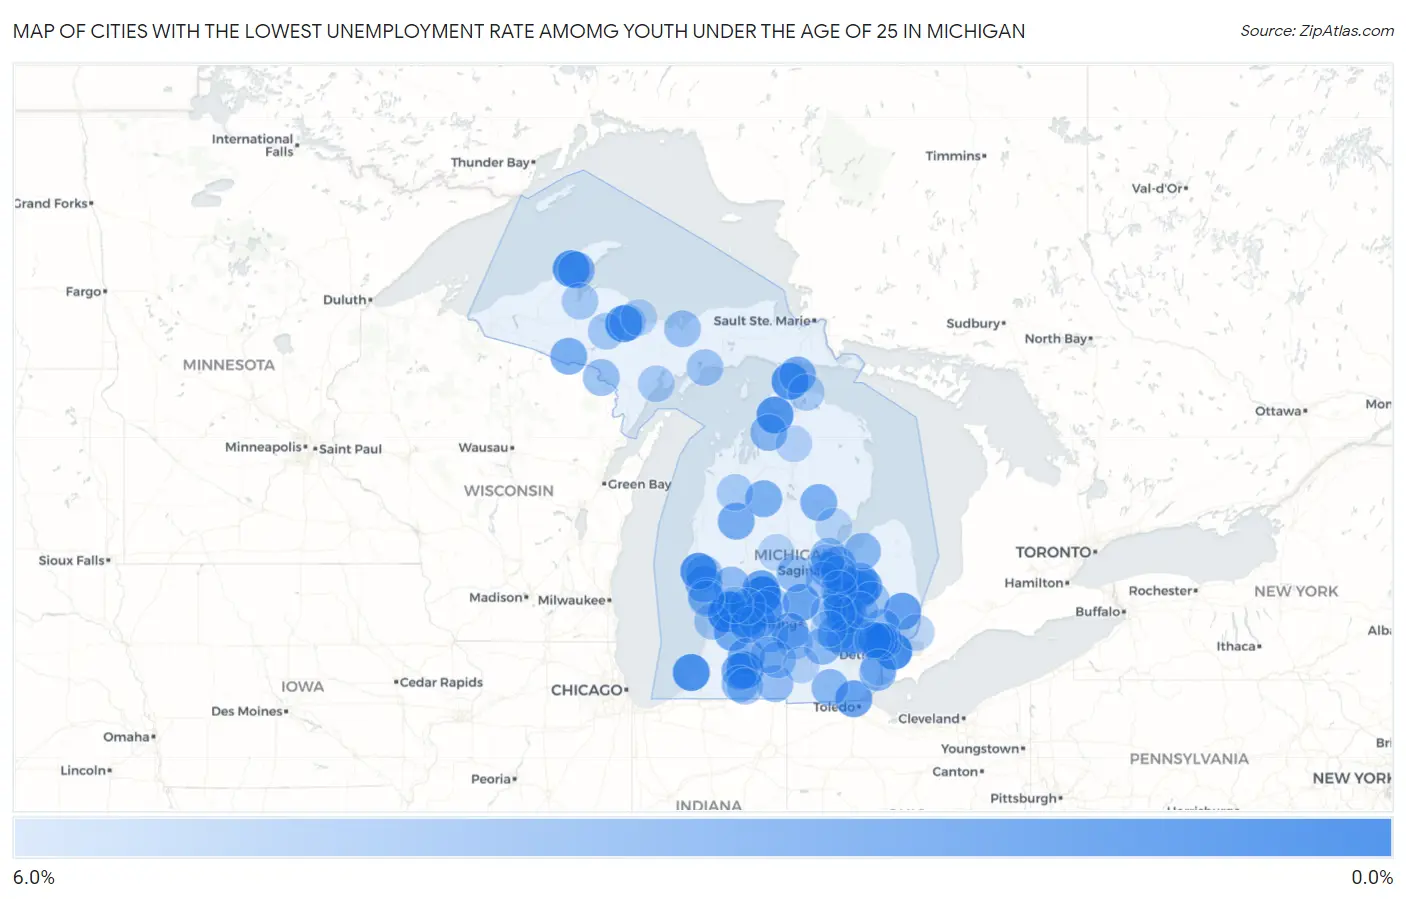
Map of Cities with the Lowest Unemployment Rate Amomg Youth Under the Age of 25 in Michigan
6.0%
0.0%
Cities with the Lowest Unemployment Rate Amomg Youth Under the Age of 25 in Michigan
| City | Youth Unemployment | vs State | vs National | |
| 1. | Belding | 0.60% | 11.6%(-11.0)#1 | 10.9%(-10.3)#55 |
| 2. | Grosse Pointe Park | 1.1% | 11.6%(-10.5)#2 | 10.9%(-9.80)#148 |
| 3. | Hudsonville | 1.1% | 11.6%(-10.5)#3 | 10.9%(-9.80)#152 |
| 4. | St Joseph | 1.4% | 11.6%(-10.2)#4 | 10.9%(-9.50)#222 |
| 5. | Ishpeming | 1.6% | 11.6%(-10.00)#5 | 10.9%(-9.30)#285 |
| 6. | Hancock | 1.6% | 11.6%(-10.00)#6 | 10.9%(-9.30)#287 |
| 7. | Birch Run | 1.6% | 11.6%(-10.00)#7 | 10.9%(-9.30)#292 |
| 8. | Petoskey | 1.7% | 11.6%(-9.90)#8 | 10.9%(-9.20)#324 |
| 9. | Vicksburg | 1.7% | 11.6%(-9.90)#9 | 10.9%(-9.20)#329 |
| 10. | Caledonia | 1.7% | 11.6%(-9.90)#10 | 10.9%(-9.20)#339 |
| 11. | Mackinaw City | 1.7% | 11.6%(-9.90)#11 | 10.9%(-9.20)#348 |
| 12. | Grandville | 1.9% | 11.6%(-9.70)#12 | 10.9%(-9.00)#403 |
| 13. | Jenison | 2.3% | 11.6%(-9.30)#13 | 10.9%(-8.60)#583 |
| 14. | Milford | 2.3% | 11.6%(-9.30)#14 | 10.9%(-8.60)#602 |
| 15. | Swartz Creek | 2.3% | 11.6%(-9.30)#15 | 10.9%(-8.60)#607 |
| 16. | Otisville | 2.3% | 11.6%(-9.30)#16 | 10.9%(-8.60)#625 |
| 17. | Memphis | 2.4% | 11.6%(-9.20)#17 | 10.9%(-8.50)#690 |
| 18. | Otter Lake | 2.4% | 11.6%(-9.20)#18 | 10.9%(-8.50)#697 |
| 19. | Lambertville | 2.5% | 11.6%(-9.10)#19 | 10.9%(-8.40)#707 |
| 20. | Greenville | 2.5% | 11.6%(-9.10)#20 | 10.9%(-8.40)#708 |
| 21. | St Johns | 2.5% | 11.6%(-9.10)#21 | 10.9%(-8.40)#711 |
| 22. | Dorr | 2.5% | 11.6%(-9.10)#22 | 10.9%(-8.40)#721 |
| 23. | Saranac | 2.5% | 11.6%(-9.10)#23 | 10.9%(-8.40)#738 |
| 24. | Potterville | 2.7% | 11.6%(-8.90)#24 | 10.9%(-8.20)#852 |
| 25. | Montague | 2.8% | 11.6%(-8.80)#25 | 10.9%(-8.10)#930 |
| 26. | Hopkins | 2.8% | 11.6%(-8.80)#26 | 10.9%(-8.10)#949 |
| 27. | North Muskegon | 2.9% | 11.6%(-8.70)#27 | 10.9%(-8.00)#978 |
| 28. | Linden | 3.0% | 11.6%(-8.60)#28 | 10.9%(-7.90)#1,035 |
| 29. | Comstock Northwest | 3.1% | 11.6%(-8.50)#29 | 10.9%(-7.80)#1,099 |
| 30. | Schoolcraft | 3.1% | 11.6%(-8.50)#30 | 10.9%(-7.80)#1,129 |
| 31. | Luther | 3.1% | 11.6%(-8.50)#31 | 10.9%(-7.80)#1,148 |
| 32. | Iron River | 3.2% | 11.6%(-8.40)#32 | 10.9%(-7.70)#1,187 |
| 33. | Zilwaukee | 3.2% | 11.6%(-8.40)#33 | 10.9%(-7.70)#1,200 |
| 34. | Flushing | 3.3% | 11.6%(-8.30)#34 | 10.9%(-7.60)#1,243 |
| 35. | Mackinac Island | 3.3% | 11.6%(-8.30)#35 | 10.9%(-7.60)#1,269 |
| 36. | Lake City | 3.3% | 11.6%(-8.30)#36 | 10.9%(-7.60)#1,276 |
| 37. | Huntington Woods | 3.4% | 11.6%(-8.20)#37 | 10.9%(-7.50)#1,308 |
| 38. | West Branch | 3.4% | 11.6%(-8.20)#38 | 10.9%(-7.50)#1,329 |
| 39. | Dollar Bay | 3.4% | 11.6%(-8.20)#39 | 10.9%(-7.50)#1,338 |
| 40. | Howell | 3.5% | 11.6%(-8.10)#40 | 10.9%(-7.40)#1,357 |
| 41. | Berkley | 3.6% | 11.6%(-8.00)#41 | 10.9%(-7.30)#1,427 |
| 42. | Shields | 3.6% | 11.6%(-8.00)#42 | 10.9%(-7.30)#1,438 |
| 43. | Lake Fenton | 3.6% | 11.6%(-8.00)#43 | 10.9%(-7.30)#1,439 |
| 44. | East Jordan | 3.6% | 11.6%(-8.00)#44 | 10.9%(-7.30)#1,458 |
| 45. | Royal Oak | 3.7% | 11.6%(-7.90)#45 | 10.9%(-7.20)#1,471 |
| 46. | Rochester | 3.7% | 11.6%(-7.90)#46 | 10.9%(-7.20)#1,477 |
| 47. | Gibraltar | 3.7% | 11.6%(-7.90)#47 | 10.9%(-7.20)#1,496 |
| 48. | Nashville | 3.7% | 11.6%(-7.90)#48 | 10.9%(-7.20)#1,523 |
| 49. | Adrian | 3.8% | 11.6%(-7.80)#49 | 10.9%(-7.10)#1,548 |
| 50. | Brighton | 3.8% | 11.6%(-7.80)#50 | 10.9%(-7.10)#1,566 |
| 51. | Stockbridge | 3.8% | 11.6%(-7.80)#51 | 10.9%(-7.10)#1,597 |
| 52. | Millington | 3.9% | 11.6%(-7.70)#52 | 10.9%(-7.00)#1,659 |
| 53. | Freeport | 3.9% | 11.6%(-7.70)#53 | 10.9%(-7.00)#1,663 |
| 54. | Unionville | 3.9% | 11.6%(-7.70)#54 | 10.9%(-7.00)#1,664 |
| 55. | Madison Heights | 4.1% | 11.6%(-7.50)#55 | 10.9%(-6.80)#1,755 |
| 56. | Three Rivers | 4.1% | 11.6%(-7.50)#56 | 10.9%(-6.80)#1,773 |
| 57. | Lakewood Club | 4.1% | 11.6%(-7.50)#57 | 10.9%(-6.80)#1,797 |
| 58. | Casnovia | 4.1% | 11.6%(-7.50)#58 | 10.9%(-6.80)#1,811 |
| 59. | Coldwater | 4.2% | 11.6%(-7.40)#59 | 10.9%(-6.70)#1,830 |
| 60. | Beverly Hills | 4.2% | 11.6%(-7.40)#60 | 10.9%(-6.70)#1,837 |
| 61. | Auburn | 4.2% | 11.6%(-7.40)#61 | 10.9%(-6.70)#1,862 |
| 62. | Alma | 4.3% | 11.6%(-7.30)#62 | 10.9%(-6.60)#1,901 |
| 63. | Iron Mountain | 4.3% | 11.6%(-7.30)#63 | 10.9%(-6.60)#1,905 |
| 64. | Marshall | 4.3% | 11.6%(-7.30)#64 | 10.9%(-6.60)#1,908 |
| 65. | Ferrysburg | 4.3% | 11.6%(-7.30)#65 | 10.9%(-6.60)#1,917 |
| 66. | St Charles | 4.4% | 11.6%(-7.20)#66 | 10.9%(-6.50)#1,997 |
| 67. | Munising | 4.4% | 11.6%(-7.20)#67 | 10.9%(-6.50)#1,998 |
| 68. | Lapeer | 4.5% | 11.6%(-7.10)#68 | 10.9%(-6.40)#2,043 |
| 69. | Bridgeport | 4.5% | 11.6%(-7.10)#69 | 10.9%(-6.40)#2,054 |
| 70. | Holland | 4.6% | 11.6%(-7.00)#70 | 10.9%(-6.30)#2,113 |
| 71. | Manistique | 4.6% | 11.6%(-7.00)#71 | 10.9%(-6.30)#2,151 |
| 72. | Centreville | 4.7% | 11.6%(-6.90)#72 | 10.9%(-6.20)#2,234 |
| 73. | Whitehall | 4.8% | 11.6%(-6.80)#73 | 10.9%(-6.10)#2,296 |
| 74. | Franklin | 4.8% | 11.6%(-6.80)#74 | 10.9%(-6.10)#2,298 |
| 75. | Republic | 4.8% | 11.6%(-6.80)#75 | 10.9%(-6.10)#2,327 |
| 76. | Escanaba | 4.9% | 11.6%(-6.70)#76 | 10.9%(-6.00)#2,347 |
| 77. | L Anse | 4.9% | 11.6%(-6.70)#77 | 10.9%(-6.00)#2,375 |
| 78. | Bancroft | 4.9% | 11.6%(-6.70)#78 | 10.9%(-6.00)#2,396 |
| 79. | Mesick | 4.9% | 11.6%(-6.70)#79 | 10.9%(-6.00)#2,400 |
| 80. | Ionia | 5.0% | 11.6%(-6.60)#80 | 10.9%(-5.90)#2,419 |
| 81. | Eaton Rapids | 5.0% | 11.6%(-6.60)#81 | 10.9%(-5.90)#2,435 |
| 82. | Cheboygan | 5.0% | 11.6%(-6.60)#82 | 10.9%(-5.90)#2,436 |
| 83. | Negaunee | 5.0% | 11.6%(-6.60)#83 | 10.9%(-5.90)#2,437 |
| 84. | Goodrich | 5.0% | 11.6%(-6.60)#84 | 10.9%(-5.90)#2,445 |
| 85. | Middleville | 5.1% | 11.6%(-6.50)#85 | 10.9%(-5.80)#2,496 |
| 86. | Algonac | 5.2% | 11.6%(-6.40)#86 | 10.9%(-5.70)#2,568 |
| 87. | Brownlee Park | 5.2% | 11.6%(-6.40)#87 | 10.9%(-5.70)#2,582 |
| 88. | Freeland | 5.3% | 11.6%(-6.30)#88 | 10.9%(-5.60)#2,650 |
| 89. | Gaylord | 5.3% | 11.6%(-6.30)#89 | 10.9%(-5.60)#2,660 |
| 90. | Spring Arbor | 5.3% | 11.6%(-6.30)#90 | 10.9%(-5.60)#2,673 |
| 91. | Montrose | 5.3% | 11.6%(-6.30)#91 | 10.9%(-5.60)#2,676 |
| 92. | Forest Hills | 5.4% | 11.6%(-6.20)#92 | 10.9%(-5.50)#2,697 |
| 93. | Marquette | 5.4% | 11.6%(-6.20)#93 | 10.9%(-5.50)#2,704 |
| 94. | Riverview | 5.4% | 11.6%(-6.20)#94 | 10.9%(-5.50)#2,710 |
| 95. | Standish | 5.4% | 11.6%(-6.20)#95 | 10.9%(-5.50)#2,749 |
| 96. | Lake Isabella | 5.4% | 11.6%(-6.20)#96 | 10.9%(-5.50)#2,750 |
| 97. | Gaines | 5.4% | 11.6%(-6.20)#97 | 10.9%(-5.50)#2,768 |
| 98. | Walker | 5.5% | 11.6%(-6.10)#98 | 10.9%(-5.40)#2,779 |
| 99. | Grand Haven | 5.5% | 11.6%(-6.10)#99 | 10.9%(-5.40)#2,790 |
| 100. | Fowlerville | 5.5% | 11.6%(-6.10)#100 | 10.9%(-5.40)#2,813 |
Common Questions
What are the Top 10 Cities with the Lowest Unemployment Rate Amomg Youth Under the Age of 25 in Michigan?
Top 10 Cities with the Lowest Unemployment Rate Amomg Youth Under the Age of 25 in Michigan are:
#1
0.60%
#2
1.1%
#3
1.1%
#4
1.4%
#5
1.6%
#6
1.6%
#7
1.6%
#8
1.7%
#9
1.7%
#10
1.7%
What city has the Lowest Unemployment Rate Amomg Youth Under the Age of 25 in Michigan?
Belding has the Lowest Unemployment Rate Amomg Youth Under the Age of 25 in Michigan with 0.60%.
What is the Unemployment Rate Amomg Youth Under the Age of 25 in the State of Michigan?
Unemployment Rate Amomg Youth Under the Age of 25 in Michigan is 11.6%.
What is the Unemployment Rate Amomg Youth Under the Age of 25 in the United States?
Unemployment Rate Amomg Youth Under the Age of 25 in the United States is 10.9%.