Cities with the Most Immigrants from Syria in Michigan
RELATED REPORTS & OPTIONS
Syria
Michigan
Compare Cities
Map of Cities with the Most Immigrants from Syria in Michigan
0
800
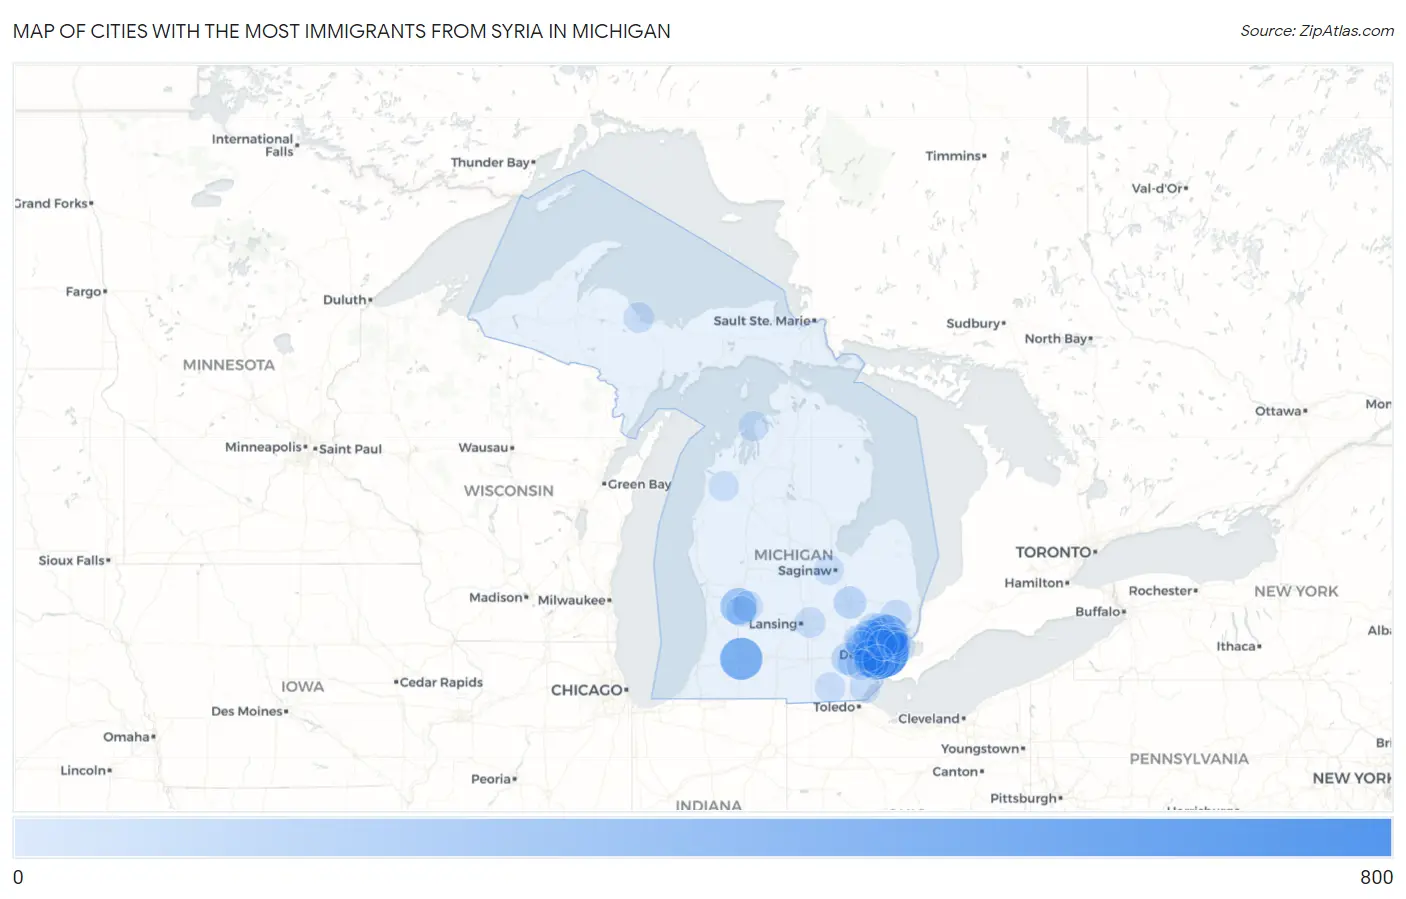
Cities with the Most Immigrants from Syria in Michigan
| City | Syria | vs State | vs National | |
| 1. | Detroit | 749 | 5,978(12.53%)#1 | 108,470(0.69%)#14 |
| 2. | Dearborn | 639 | 5,978(10.69%)#2 | 108,470(0.59%)#16 |
| 3. | Kalamazoo | 458 | 5,978(7.66%)#3 | 108,470(0.42%)#28 |
| 4. | Sterling Heights | 380 | 5,978(6.36%)#4 | 108,470(0.35%)#39 |
| 5. | Grand Rapids | 235 | 5,978(3.93%)#5 | 108,470(0.22%)#80 |
| 6. | Oak Park | 234 | 5,978(3.91%)#6 | 108,470(0.22%)#81 |
| 7. | Troy | 177 | 5,978(2.96%)#7 | 108,470(0.16%)#118 |
| 8. | Warren | 161 | 5,978(2.69%)#8 | 108,470(0.15%)#132 |
| 9. | Dearborn Heights | 149 | 5,978(2.49%)#9 | 108,470(0.14%)#150 |
| 10. | Eastpointe | 100 | 5,978(1.67%)#10 | 108,470(0.09%)#214 |
| 11. | Livonia | 91 | 5,978(1.52%)#11 | 108,470(0.08%)#228 |
| 12. | Flint | 88 | 5,978(1.47%)#12 | 108,470(0.08%)#236 |
| 13. | Ypsilanti | 78 | 5,978(1.30%)#13 | 108,470(0.07%)#271 |
| 14. | Ann Arbor | 75 | 5,978(1.25%)#14 | 108,470(0.07%)#281 |
| 15. | Bloomfield Hills | 64 | 5,978(1.07%)#15 | 108,470(0.06%)#323 |
| 16. | Farmington Hills | 57 | 5,978(0.95%)#16 | 108,470(0.05%)#346 |
| 17. | Rochester Hills | 52 | 5,978(0.87%)#17 | 108,470(0.05%)#362 |
| 18. | Novi | 45 | 5,978(0.75%)#18 | 108,470(0.04%)#397 |
| 19. | Auburn Hills | 45 | 5,978(0.75%)#19 | 108,470(0.04%)#400 |
| 20. | Madison Heights | 37 | 5,978(0.62%)#20 | 108,470(0.03%)#460 |
| 21. | Lincoln Park | 36 | 5,978(0.60%)#21 | 108,470(0.03%)#469 |
| 22. | Birmingham | 32 | 5,978(0.54%)#22 | 108,470(0.03%)#509 |
| 23. | Forest Hills | 26 | 5,978(0.43%)#23 | 108,470(0.02%)#569 |
| 24. | Garden City | 25 | 5,978(0.42%)#24 | 108,470(0.02%)#586 |
| 25. | South Monroe | 25 | 5,978(0.42%)#25 | 108,470(0.02%)#590 |
| 26. | St Clair Shores | 23 | 5,978(0.38%)#26 | 108,470(0.02%)#612 |
| 27. | Kentwood | 23 | 5,978(0.38%)#27 | 108,470(0.02%)#614 |
| 28. | Haslett | 21 | 5,978(0.35%)#28 | 108,470(0.02%)#658 |
| 29. | Armada | 21 | 5,978(0.35%)#29 | 108,470(0.02%)#662 |
| 30. | Taylor | 19 | 5,978(0.32%)#30 | 108,470(0.02%)#683 |
| 31. | Wixom | 17 | 5,978(0.28%)#31 | 108,470(0.02%)#735 |
| 32. | Hazel Park | 16 | 5,978(0.27%)#32 | 108,470(0.01%)#759 |
| 33. | Orchard Lake Village | 15 | 5,978(0.25%)#33 | 108,470(0.01%)#792 |
| 34. | Marquette | 13 | 5,978(0.22%)#34 | 108,470(0.01%)#825 |
| 35. | Westland | 12 | 5,978(0.20%)#35 | 108,470(0.01%)#842 |
| 36. | Northville | 11 | 5,978(0.18%)#36 | 108,470(0.01%)#882 |
| 37. | Roseville | 10 | 5,978(0.17%)#37 | 108,470(0.01%)#891 |
| 38. | Romulus | 10 | 5,978(0.17%)#38 | 108,470(0.01%)#896 |
| 39. | Adrian | 10 | 5,978(0.17%)#39 | 108,470(0.01%)#900 |
| 40. | Grosse Pointe Woods | 10 | 5,978(0.17%)#40 | 108,470(0.01%)#903 |
| 41. | Royal Oak | 9 | 5,978(0.15%)#41 | 108,470(0.01%)#921 |
| 42. | Ferndale | 9 | 5,978(0.15%)#42 | 108,470(0.01%)#933 |
| 43. | Fraser | 7 | 5,978(0.12%)#43 | 108,470(0.01%)#984 |
| 44. | Village Of Grosse Pointe Shores | 7 | 5,978(0.12%)#44 | 108,470(0.01%)#990 |
| 45. | Copemish | 6 | 5,978(0.10%)#45 | 108,470(0.01%)#1,023 |
| 46. | Norwood | 6 | 5,978(0.10%)#46 | 108,470(0.01%)#1,024 |
| 47. | Shields | 5 | 5,978(0.08%)#47 | 108,470(0.00%)#1,037 |
| 48. | Belleville | 5 | 5,978(0.08%)#48 | 108,470(0.00%)#1,040 |
| 49. | Allen Park | 1 | 5,978(0.02%)#49 | 108,470(0.00%)#1,078 |
Common Questions
What are the Top 10 Cities with the Most Immigrants from Syria in Michigan?
Top 10 Cities with the Most Immigrants from Syria in Michigan are:
#1
749
#2
639
#3
458
#4
380
#5
235
#6
234
#7
177
#8
161
#9
149
#10
100
What city has the Most Immigrants from Syria in Michigan?
Detroit has the Most Immigrants from Syria in Michigan with 749.
What is the Total Immigrants from Syria in the State of Michigan?
Total Immigrants from Syria in Michigan is 5,978.
What is the Total Immigrants from Syria in the United States?
Total Immigrants from Syria in the United States is 108,470.