Cities with the Highest Percentage of Immigrants from Brazil in Michigan
RELATED REPORTS & OPTIONS
Brazil
Michigan
Compare Cities
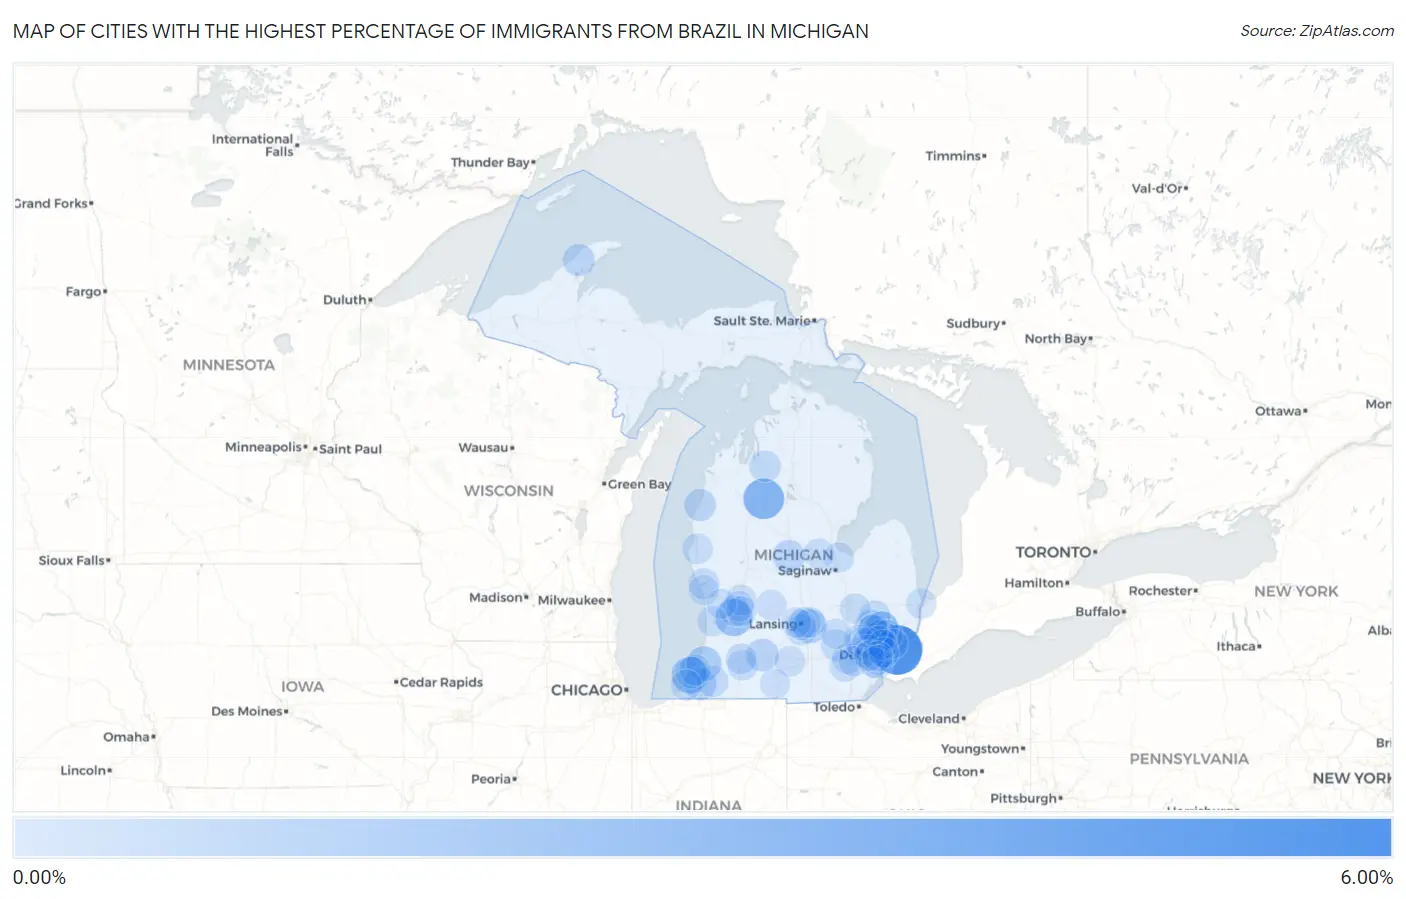
Map of Cities with the Highest Percentage of Immigrants from Brazil in Michigan
0.00%
6.00%
Cities with the Highest Percentage of Immigrants from Brazil in Michigan
| City | Brazil | vs State | vs National | |
| 1. | Grosse Pointe Farms | 5.88% | 0.074%(+5.80)#-1 | 0.17%(+5.71)#0 |
| 2. | Lake City | 3.13% | 0.074%(+3.06)#0 | 0.17%(+2.97)#1 |
| 3. | Byron Center | 2.10% | 0.074%(+2.03)#1 | 0.17%(+1.94)#2 |
| 4. | Shoreham | 1.95% | 0.074%(+1.88)#2 | 0.17%(+1.79)#3 |
| 5. | Paw Paw Lake | 1.37% | 0.074%(+1.30)#3 | 0.17%(+1.21)#4 |
| 6. | Rochester Hills | 1.14% | 0.074%(+1.06)#30 | 0.17%(+0.972)#3,861 |
| 7. | Birmingham | 1.13% | 0.074%(+1.06)#31 | 0.17%(+0.965)#3,862 |
| 8. | Okemos | 1.10% | 0.074%(+1.03)#32 | 0.17%(+0.933)#3,863 |
| 9. | Berrien Springs | 0.74% | 0.074%(+0.667)#33 | 0.17%(+0.575)#3,864 |
| 10. | Springfield | 0.74% | 0.074%(+0.666)#34 | 0.17%(+0.573)#3,865 |
| 11. | Lake Angelus | 0.70% | 0.074%(+0.622)#35 | 0.17%(+0.530)#3,866 |
| 12. | Mount Pleasant | 0.67% | 0.074%(+0.595)#36 | 0.17%(+0.502)#3,867 |
| 13. | Rochester | 0.56% | 0.074%(+0.488)#37 | 0.17%(+0.396)#3,868 |
| 14. | Calumet | 0.56% | 0.074%(+0.482)#38 | 0.17%(+0.389)#3,869 |
| 15. | Manistee | 0.54% | 0.074%(+0.470)#39 | 0.17%(+0.377)#3,870 |
| 16. | Dowagiac | 0.44% | 0.074%(+0.366)#40 | 0.17%(+0.273)#3,871 |
| 17. | Kalkaska | 0.39% | 0.074%(+0.316)#41 | 0.17%(+0.223)#3,872 |
| 18. | Oxford | 0.34% | 0.074%(+0.270)#42 | 0.17%(+0.177)#3,873 |
| 19. | St Joseph | 0.34% | 0.074%(+0.269)#43 | 0.17%(+0.177)#3,874 |
| 20. | Pinckney | 0.31% | 0.074%(+0.233)#44 | 0.17%(+0.141)#3,875 |
| 21. | Pleasant Ridge | 0.31% | 0.074%(+0.232)#45 | 0.17%(+0.140)#3,876 |
| 22. | Royal Oak | 0.30% | 0.074%(+0.230)#46 | 0.17%(+0.138)#3,877 |
| 23. | Benton Heights | 0.27% | 0.074%(+0.191)#47 | 0.17%(+0.099)#3,878 |
| 24. | Bridgman | 0.25% | 0.074%(+0.178)#48 | 0.17%(+0.085)#3,879 |
| 25. | North Muskegon | 0.25% | 0.074%(+0.171)#49 | 0.17%(+0.079)#3,880 |
| 26. | Troy | 0.24% | 0.074%(+0.168)#50 | 0.17%(+0.075)#3,894 |
| 27. | Saline | 0.23% | 0.074%(+0.160)#51 | 0.17%(+0.067)#3,895 |
| 28. | Holt | 0.19% | 0.074%(+0.111)#52 | 0.17%(+0.018)#3,896 |
| 29. | Hart | 0.18% | 0.074%(+0.110)#53 | 0.17%(+0.017)#3,897 |
| 30. | Portage | 0.18% | 0.074%(+0.105)#54 | 0.17%(+0.013)#3,898 |
| 31. | Plymouth | 0.17% | 0.074%(+0.098)#55 | 0.17%(+0.005)#3,899 |
| 32. | Ann Arbor | 0.17% | 0.074%(+0.097)#56 | 0.17%(+0.004)#3,900 |
| 33. | Kalamazoo | 0.17% | 0.074%(+0.093)#57 | 0.17%(+0.001)#3,901 |
| 34. | East Lansing | 0.17% | 0.074%(+0.091)#58 | 0.17%(-0.002)#3,902 |
| 35. | Grand Blanc | 0.15% | 0.074%(+0.075)#59 | 0.17%(-0.017)#3,903 |
| 36. | Ionia | 0.15% | 0.074%(+0.071)#60 | 0.17%(-0.022)#3,904 |
| 37. | Wixom | 0.14% | 0.074%(+0.067)#61 | 0.17%(-0.026)#3,905 |
| 38. | Sterling Heights | 0.097% | 0.074%(+0.023)#62 | 0.17%(-0.070)#3,906 |
| 39. | Berkley | 0.092% | 0.074%(+0.018)#63 | 0.17%(-0.074)#3,907 |
| 40. | Northview | 0.091% | 0.074%(+0.016)#64 | 0.17%(-0.076)#3,908 |
| 41. | Novi | 0.090% | 0.074%(+0.015)#65 | 0.17%(-0.077)#3,909 |
| 42. | Haslett | 0.084% | 0.074%(+0.009)#66 | 0.17%(-0.083)#3,910 |
| 43. | Southgate | 0.080% | 0.074%(+0.006)#67 | 0.17%(-0.087)#3,911 |
| 44. | Livonia | 0.077% | 0.074%(+0.002)#68 | 0.17%(-0.090)#3,912 |
| 45. | Wyoming | 0.074% | 0.074%(-0.000)#69 | 0.17%(-0.093)#3,913 |
| 46. | Port Huron | 0.069% | 0.074%(-0.005)#70 | 0.17%(-0.098)#3,914 |
| 47. | Midland | 0.066% | 0.074%(-0.008)#71 | 0.17%(-0.101)#3,915 |
| 48. | Farmington Hills | 0.065% | 0.074%(-0.010)#72 | 0.17%(-0.102)#3,916 |
| 49. | Bay City | 0.064% | 0.074%(-0.010)#73 | 0.17%(-0.103)#3,917 |
| 50. | Howell | 0.060% | 0.074%(-0.015)#74 | 0.17%(-0.107)#3,918 |
| 51. | Grand Rapids | 0.059% | 0.074%(-0.016)#75 | 0.17%(-0.108)#3,919 |
| 52. | Holland | 0.056% | 0.074%(-0.019)#76 | 0.17%(-0.111)#3,920 |
| 53. | Ypsilanti | 0.054% | 0.074%(-0.020)#77 | 0.17%(-0.112)#3,921 |
| 54. | Auburn Hills | 0.053% | 0.074%(-0.022)#78 | 0.17%(-0.114)#3,922 |
| 55. | Albion | 0.052% | 0.074%(-0.023)#79 | 0.17%(-0.115)#3,923 |
| 56. | Garden City | 0.044% | 0.074%(-0.030)#80 | 0.17%(-0.123)#3,924 |
| 57. | Kentwood | 0.039% | 0.074%(-0.036)#81 | 0.17%(-0.128)#3,925 |
| 58. | Ferndale | 0.036% | 0.074%(-0.038)#82 | 0.17%(-0.130)#3,926 |
| 59. | Eastpointe | 0.035% | 0.074%(-0.039)#83 | 0.17%(-0.132)#3,927 |
| 60. | Lansing | 0.033% | 0.074%(-0.042)#84 | 0.17%(-0.134)#3,928 |
| 61. | Waverly | 0.030% | 0.074%(-0.045)#85 | 0.17%(-0.137)#3,929 |
| 62. | Allen Park | 0.028% | 0.074%(-0.046)#86 | 0.17%(-0.139)#3,930 |
| 63. | Norton Shores | 0.028% | 0.074%(-0.046)#87 | 0.17%(-0.139)#3,931 |
| 64. | Taylor | 0.025% | 0.074%(-0.049)#88 | 0.17%(-0.141)#3,932 |
| 65. | Westland | 0.018% | 0.074%(-0.057)#89 | 0.17%(-0.149)#3,933 |
| 66. | Detroit | 0.016% | 0.074%(-0.058)#90 | 0.17%(-0.150)#3,934 |
| 67. | Allendale | 0.016% | 0.074%(-0.059)#91 | 0.17%(-0.151)#3,935 |
| 68. | Dearborn | 0.016% | 0.074%(-0.059)#92 | 0.17%(-0.151)#3,936 |
| 69. | Pontiac | 0.011% | 0.074%(-0.063)#93 | 0.17%(-0.156)#3,937 |
| 70. | Coldwater | 0.0073% | 0.074%(-0.067)#94 | 0.17%(-0.160)#3,938 |
Common Questions
What are the Top 10 Cities with the Highest Percentage of Immigrants from Brazil in Michigan?
Top 10 Cities with the Highest Percentage of Immigrants from Brazil in Michigan are:
#1
5.88%
#2
3.13%
#3
2.10%
#4
1.95%
#5
1.37%
#6
1.14%
#7
1.13%
#8
1.10%
#9
0.74%
#10
0.74%
What city has the Highest Percentage of Immigrants from Brazil in Michigan?
Grosse Pointe Farms has the Highest Percentage of Immigrants from Brazil in Michigan with 5.88%.
What is the Percentage of Immigrants from Brazil in the State of Michigan?
Percentage of Immigrants from Brazil in Michigan is 0.074%.
What is the Percentage of Immigrants from Brazil in the United States?
Percentage of Immigrants from Brazil in the United States is 0.17%.