Cities with the Highest Percentage of Population Employed in Administrative & Support Services in Michigan
RELATED REPORTS & OPTIONS
Administrative & Support Services
Michigan
Compare Cities
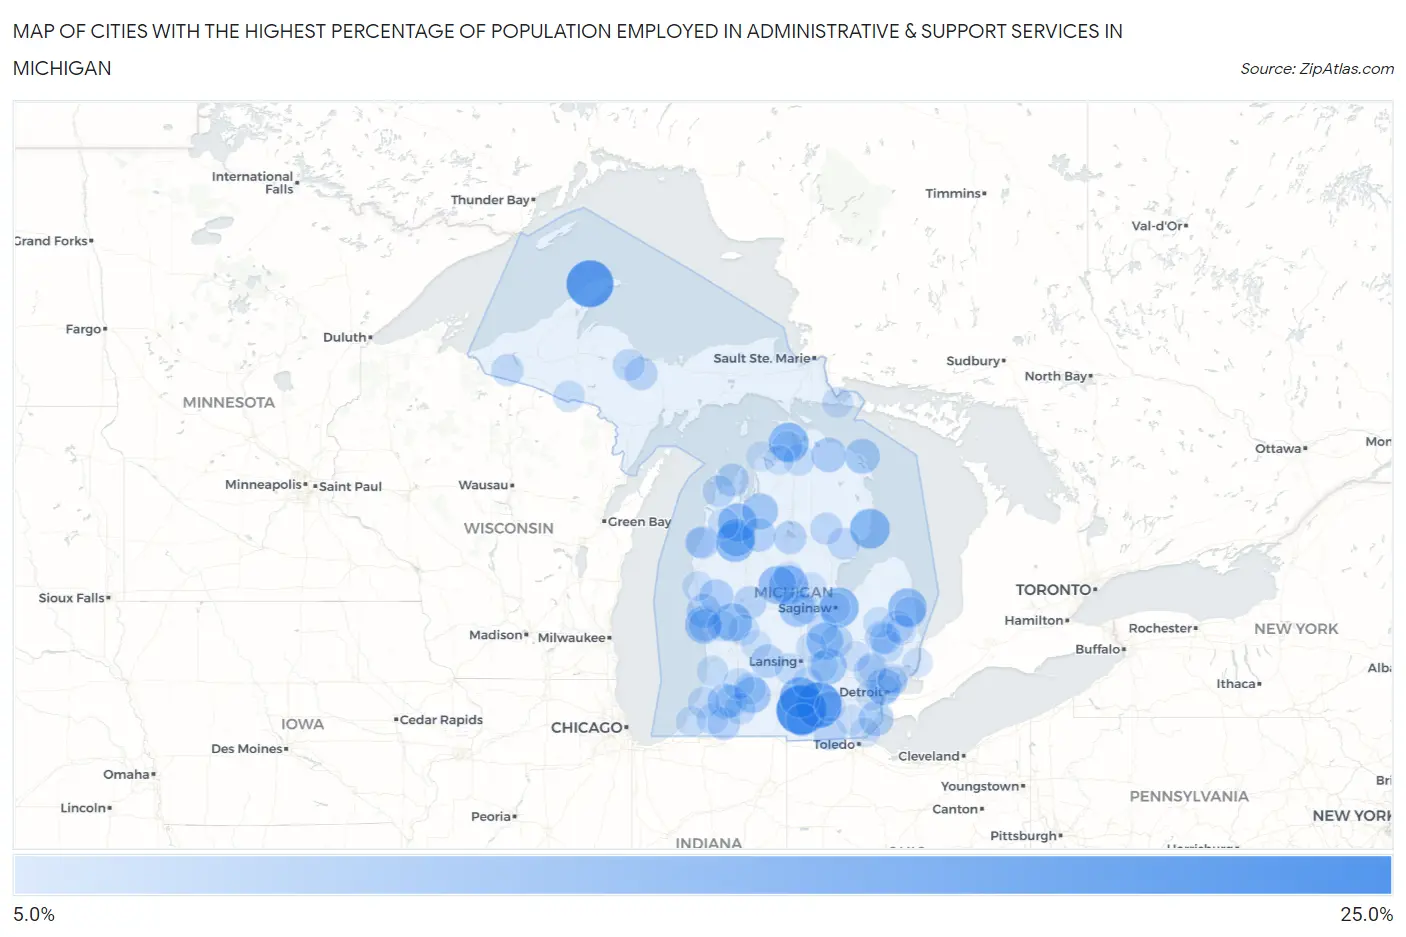
Map of Cities with the Highest Percentage of Population Employed in Administrative & Support Services in Michigan
0.0%
25.0%
Cities with the Highest Percentage of Population Employed in Administrative & Support Services in Michigan
| City | % Employed | vs State | vs National | |
| 1. | Hanover | 23.9% | 3.7%(+20.1)#1 | 4.1%(+19.7)#311 |
| 2. | Eagle River | 21.4% | 3.7%(+17.7)#2 | 4.1%(+17.3)#396 |
| 3. | Napoleon | 20.4% | 3.7%(+16.7)#3 | 4.1%(+16.2)#426 |
| 4. | Rockland | 16.7% | 3.7%(+12.9)#4 | 4.1%(+12.5)#632 |
| 5. | Parma | 15.5% | 3.7%(+11.8)#5 | 4.1%(+11.3)#736 |
| 6. | Brutus | 15.0% | 3.7%(+11.2)#6 | 4.1%(+10.8)#796 |
| 7. | Oscoda | 14.9% | 3.7%(+11.2)#7 | 4.1%(+10.8)#802 |
| 8. | Buena Vista | 14.9% | 3.7%(+11.2)#8 | 4.1%(+10.7)#809 |
| 9. | Elm Hall | 14.8% | 3.7%(+11.0)#9 | 4.1%(+10.6)#831 |
| 10. | Caberfae | 13.9% | 3.7%(+10.2)#10 | 4.1%(+9.74)#961 |
| 11. | Rosebush | 13.9% | 3.7%(+10.1)#11 | 4.1%(+9.71)#965 |
| 12. | Buckley | 13.7% | 3.7%(+10.00)#12 | 4.1%(+9.58)#986 |
| 13. | Kent City | 13.7% | 3.7%(+9.98)#13 | 4.1%(+9.55)#994 |
| 14. | Carsonville | 13.6% | 3.7%(+9.91)#14 | 4.1%(+9.49)#1,005 |
| 15. | Ida | 13.2% | 3.7%(+9.50)#15 | 4.1%(+9.07)#1,076 |
| 16. | Weidman | 13.2% | 3.7%(+9.49)#16 | 4.1%(+9.07)#1,078 |
| 17. | Harrietta | 12.9% | 3.7%(+9.18)#17 | 4.1%(+8.75)#1,136 |
| 18. | Roosevelt Park | 12.8% | 3.7%(+9.06)#18 | 4.1%(+8.63)#1,157 |
| 19. | Middletown | 12.2% | 3.7%(+8.50)#19 | 4.1%(+8.08)#1,260 |
| 20. | Galesburg | 11.6% | 3.7%(+7.91)#20 | 4.1%(+7.49)#1,398 |
| 21. | St Louis | 11.5% | 3.7%(+7.73)#21 | 4.1%(+7.31)#1,434 |
| 22. | South Boardman | 11.4% | 3.7%(+7.71)#22 | 4.1%(+7.29)#1,437 |
| 23. | Fowlerville | 11.3% | 3.7%(+7.53)#23 | 4.1%(+7.11)#1,473 |
| 24. | Highland Park | 10.7% | 3.7%(+6.99)#24 | 4.1%(+6.56)#1,632 |
| 25. | Presque Isle Harbor | 10.6% | 3.7%(+6.85)#25 | 4.1%(+6.42)#1,673 |
| 26. | Paw Paw | 10.6% | 3.7%(+6.82)#26 | 4.1%(+6.40)#1,679 |
| 27. | Millersburg | 10.2% | 3.7%(+6.48)#27 | 4.1%(+6.05)#1,815 |
| 28. | Estral Beach | 10.1% | 3.7%(+6.37)#28 | 4.1%(+5.95)#1,860 |
| 29. | Eureka | 9.8% | 3.7%(+6.11)#29 | 4.1%(+5.69)#1,978 |
| 30. | Lakewood Club | 9.8% | 3.7%(+6.04)#30 | 4.1%(+5.62)#2,004 |
| 31. | Hesperia | 9.6% | 3.7%(+5.87)#31 | 4.1%(+5.45)#2,076 |
| 32. | Jennings | 9.4% | 3.7%(+5.68)#32 | 4.1%(+5.26)#2,162 |
| 33. | Woodland | 9.2% | 3.7%(+5.52)#33 | 4.1%(+5.10)#2,238 |
| 34. | Leland | 9.1% | 3.7%(+5.36)#34 | 4.1%(+4.94)#2,315 |
| 35. | Houghton Lake | 8.9% | 3.7%(+5.18)#35 | 4.1%(+4.76)#2,429 |
| 36. | Morley | 8.8% | 3.7%(+5.07)#36 | 4.1%(+4.65)#2,497 |
| 37. | North Adams | 8.7% | 3.7%(+5.02)#37 | 4.1%(+4.60)#2,524 |
| 38. | Eastlake | 8.7% | 3.7%(+5.00)#38 | 4.1%(+4.58)#2,537 |
| 39. | K I Sawyer | 8.7% | 3.7%(+4.96)#39 | 4.1%(+4.54)#2,567 |
| 40. | Millers Lake | 8.6% | 3.7%(+4.89)#40 | 4.1%(+4.47)#2,607 |
| 41. | Jasper | 8.6% | 3.7%(+4.83)#41 | 4.1%(+4.41)#2,647 |
| 42. | Vandalia | 8.5% | 3.7%(+4.80)#42 | 4.1%(+4.37)#2,667 |
| 43. | Muskegon Heights | 8.4% | 3.7%(+4.70)#43 | 4.1%(+4.27)#2,720 |
| 44. | Mattawan | 8.3% | 3.7%(+4.62)#44 | 4.1%(+4.20)#2,766 |
| 45. | Attica | 8.2% | 3.7%(+4.51)#45 | 4.1%(+4.09)#2,840 |
| 46. | Lennon | 8.2% | 3.7%(+4.46)#46 | 4.1%(+4.04)#2,876 |
| 47. | Keego Harbor | 8.2% | 3.7%(+4.44)#47 | 4.1%(+4.01)#2,894 |
| 48. | Whittemore | 8.0% | 3.7%(+4.27)#48 | 4.1%(+3.85)#2,987 |
| 49. | Glen Arbor | 8.0% | 3.7%(+4.24)#49 | 4.1%(+3.81)#3,017 |
| 50. | Palmer | 7.9% | 3.7%(+4.21)#50 | 4.1%(+3.79)#3,041 |
| 51. | Melvin | 7.9% | 3.7%(+4.17)#51 | 4.1%(+3.74)#3,071 |
| 52. | Rose City | 7.9% | 3.7%(+4.14)#52 | 4.1%(+3.72)#3,094 |
| 53. | Applegate | 7.8% | 3.7%(+4.10)#53 | 4.1%(+3.68)#3,127 |
| 54. | Marenisco | 7.8% | 3.7%(+4.06)#54 | 4.1%(+3.64)#3,150 |
| 55. | Richland | 7.8% | 3.7%(+4.05)#55 | 4.1%(+3.62)#3,166 |
| 56. | Almont | 7.7% | 3.7%(+3.98)#56 | 4.1%(+3.56)#3,210 |
| 57. | Watervliet | 7.6% | 3.7%(+3.91)#57 | 4.1%(+3.49)#3,284 |
| 58. | Hartland | 7.6% | 3.7%(+3.91)#58 | 4.1%(+3.49)#3,286 |
| 59. | Imlay City | 7.6% | 3.7%(+3.82)#59 | 4.1%(+3.40)#3,336 |
| 60. | Ruby | 7.5% | 3.7%(+3.81)#60 | 4.1%(+3.39)#3,348 |
| 61. | Wolverine | 7.5% | 3.7%(+3.80)#61 | 4.1%(+3.38)#3,367 |
| 62. | Schoolcraft | 7.5% | 3.7%(+3.78)#62 | 4.1%(+3.35)#3,386 |
| 63. | Plainwell | 7.5% | 3.7%(+3.77)#63 | 4.1%(+3.35)#3,405 |
| 64. | Dowagiac | 7.4% | 3.7%(+3.63)#64 | 4.1%(+3.20)#3,541 |
| 65. | Caspian | 7.3% | 3.7%(+3.54)#65 | 4.1%(+3.12)#3,618 |
| 66. | Fennville | 7.2% | 3.7%(+3.51)#66 | 4.1%(+3.09)#3,651 |
| 67. | Detroit | 7.2% | 3.7%(+3.48)#67 | 4.1%(+3.06)#3,677 |
| 68. | Potterville | 7.1% | 3.7%(+3.39)#68 | 4.1%(+2.97)#3,780 |
| 69. | Rockford | 7.1% | 3.7%(+3.39)#69 | 4.1%(+2.97)#3,782 |
| 70. | Oakley | 7.1% | 3.7%(+3.35)#70 | 4.1%(+2.93)#3,813 |
| 71. | Copemish | 7.1% | 3.7%(+3.33)#71 | 4.1%(+2.91)#3,840 |
| 72. | North Branch | 7.0% | 3.7%(+3.32)#72 | 4.1%(+2.90)#3,859 |
| 73. | Leslie | 7.0% | 3.7%(+3.28)#73 | 4.1%(+2.85)#3,907 |
| 74. | Webberville | 7.0% | 3.7%(+3.27)#74 | 4.1%(+2.84)#3,914 |
| 75. | Inkster | 6.9% | 3.7%(+3.17)#75 | 4.1%(+2.74)#4,001 |
| 76. | De Tour Village | 6.8% | 3.7%(+3.12)#76 | 4.1%(+2.70)#4,049 |
| 77. | Ravenna | 6.8% | 3.7%(+3.10)#77 | 4.1%(+2.68)#4,066 |
| 78. | Saginaw | 6.8% | 3.7%(+3.08)#78 | 4.1%(+2.66)#4,088 |
| 79. | Lake Victoria | 6.7% | 3.7%(+2.99)#79 | 4.1%(+2.56)#4,182 |
| 80. | Manchester | 6.7% | 3.7%(+2.93)#80 | 4.1%(+2.51)#4,244 |
| 81. | Baroda | 6.7% | 3.7%(+2.93)#81 | 4.1%(+2.50)#4,254 |
| 82. | Alanson | 6.6% | 3.7%(+2.90)#82 | 4.1%(+2.48)#4,284 |
| 83. | Manistee | 6.6% | 3.7%(+2.88)#83 | 4.1%(+2.46)#4,305 |
| 84. | Yale | 6.6% | 3.7%(+2.86)#84 | 4.1%(+2.43)#4,342 |
| 85. | Pontiac | 6.5% | 3.7%(+2.81)#85 | 4.1%(+2.39)#4,383 |
| 86. | Sanford | 6.5% | 3.7%(+2.81)#86 | 4.1%(+2.39)#4,387 |
| 87. | Marine City | 6.5% | 3.7%(+2.80)#87 | 4.1%(+2.37)#4,405 |
| 88. | Holly | 6.5% | 3.7%(+2.79)#88 | 4.1%(+2.37)#4,427 |
| 89. | Hart | 6.5% | 3.7%(+2.79)#89 | 4.1%(+2.37)#4,428 |
| 90. | Dundee | 6.5% | 3.7%(+2.77)#90 | 4.1%(+2.35)#4,442 |
| 91. | Roseville | 6.5% | 3.7%(+2.76)#91 | 4.1%(+2.34)#4,457 |
| 92. | Luna Pier | 6.4% | 3.7%(+2.70)#92 | 4.1%(+2.28)#4,528 |
| 93. | Breckenridge | 6.4% | 3.7%(+2.70)#93 | 4.1%(+2.28)#4,535 |
| 94. | Kincheloe | 6.3% | 3.7%(+2.61)#94 | 4.1%(+2.19)#4,635 |
| 95. | Charlevoix | 6.3% | 3.7%(+2.61)#95 | 4.1%(+2.19)#4,640 |
| 96. | Lowell | 6.3% | 3.7%(+2.61)#96 | 4.1%(+2.18)#4,650 |
| 97. | Eastpointe | 6.3% | 3.7%(+2.60)#97 | 4.1%(+2.18)#4,662 |
| 98. | Clare | 6.2% | 3.7%(+2.51)#98 | 4.1%(+2.09)#4,787 |
| 99. | Atlantic Mine | 6.2% | 3.7%(+2.50)#99 | 4.1%(+2.08)#4,799 |
| 100. | Walloon Lake | 6.2% | 3.7%(+2.48)#100 | 4.1%(+2.06)#4,814 |
Common Questions
What are the Top 10 Cities with the Highest Percentage of Population Employed in Administrative & Support Services in Michigan?
Top 10 Cities with the Highest Percentage of Population Employed in Administrative & Support Services in Michigan are:
#1
23.9%
#2
21.4%
#3
20.4%
#4
15.5%
#5
15.0%
#6
14.9%
#7
14.9%
#8
13.9%
#9
13.9%
#10
13.7%
What city has the Highest Percentage of Population Employed in Administrative & Support Services in Michigan?
Hanover has the Highest Percentage of Population Employed in Administrative & Support Services in Michigan with 23.9%.
What is the Percentage of Population Employed in Administrative & Support Services in the State of Michigan?
Percentage of Population Employed in Administrative & Support Services in Michigan is 3.7%.
What is the Percentage of Population Employed in Administrative & Support Services in the United States?
Percentage of Population Employed in Administrative & Support Services in the United States is 4.1%.