Cities with the Highest Percentage of African Population in Michigan
RELATED REPORTS & OPTIONS
African
Michigan
Compare Cities
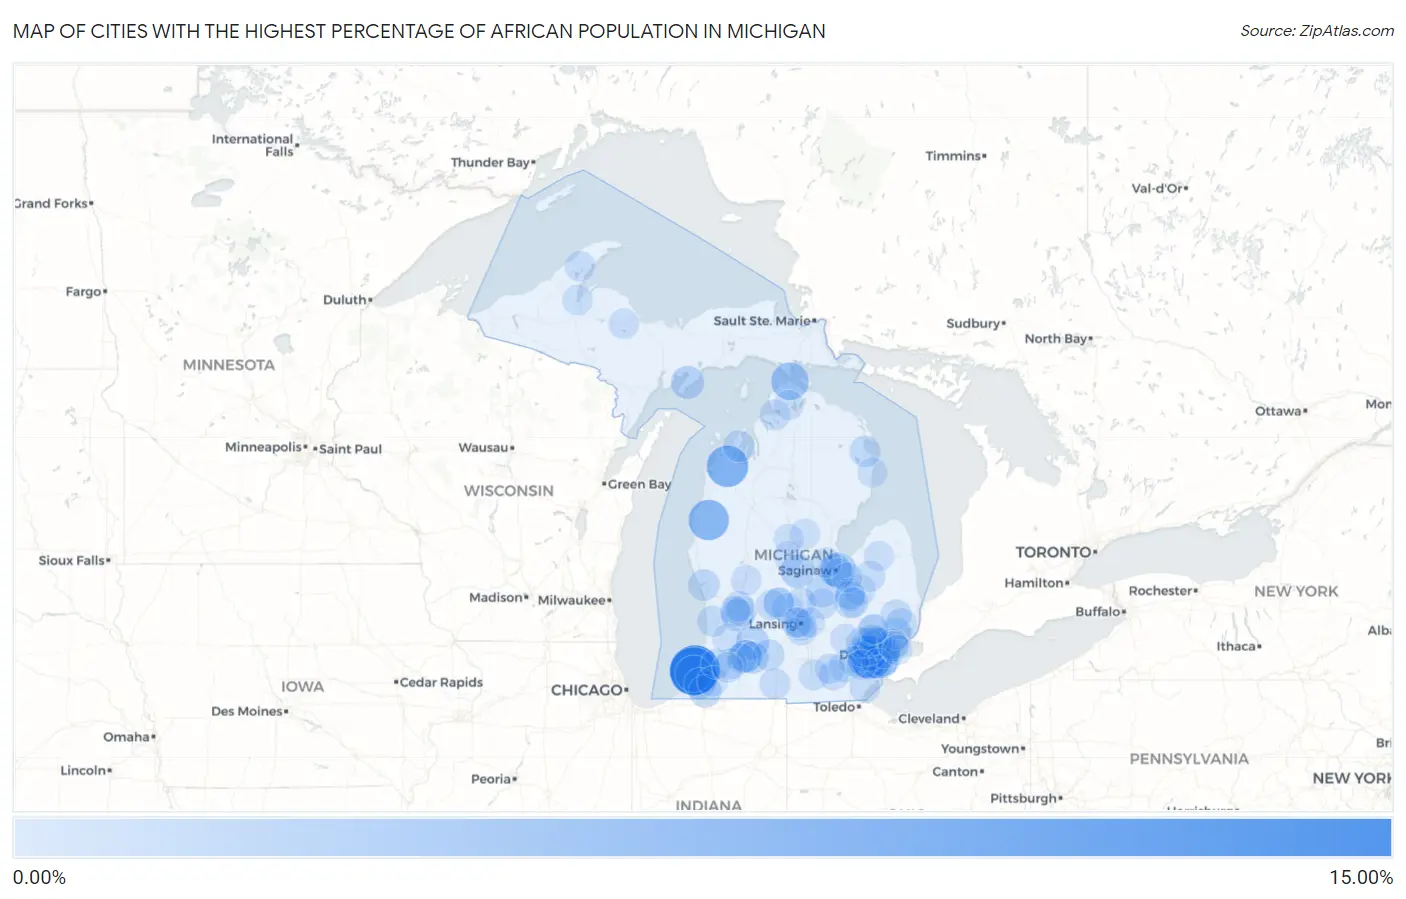
Map of Cities with the Highest Percentage of African Population in Michigan
0.00%
15.00%
Cities with the Highest Percentage of African Population in Michigan
| City | African | vs State | vs National | |
| 1. | Benton Heights | 13.29% | 0.48%(+12.8)#1 | 0.57%(+12.7)#64 |
| 2. | Benton Harbor | 12.23% | 0.48%(+11.7)#2 | 0.57%(+11.7)#68 |
| 3. | Inkster | 7.88% | 0.48%(+7.40)#3 | 0.57%(+7.31)#160 |
| 4. | Lake Ann | 7.80% | 0.48%(+7.32)#4 | 0.57%(+7.24)#164 |
| 5. | Fountain | 7.01% | 0.48%(+6.52)#5 | 0.57%(+6.44)#195 |
| 6. | Wayne | 5.90% | 0.48%(+5.41)#6 | 0.57%(+5.33)#249 |
| 7. | Mackinaw City | 5.19% | 0.48%(+4.71)#7 | 0.57%(+4.63)#302 |
| 8. | Fair Plain | 4.64% | 0.48%(+4.15)#8 | 0.57%(+4.07)#362 |
| 9. | Buena Vista | 3.58% | 0.48%(+3.09)#9 | 0.57%(+3.01)#494 |
| 10. | River Rouge | 3.25% | 0.48%(+2.77)#10 | 0.57%(+2.68)#552 |
| 11. | Highland Park | 3.06% | 0.48%(+2.57)#11 | 0.57%(+2.49)#610 |
| 12. | St Louis | 2.67% | 0.48%(+2.18)#12 | 0.57%(+2.10)#725 |
| 13. | Westland | 2.61% | 0.48%(+2.13)#13 | 0.57%(+2.05)#740 |
| 14. | Ecorse | 2.52% | 0.48%(+2.03)#14 | 0.57%(+1.95)#778 |
| 15. | Garden | 2.37% | 0.48%(+1.88)#15 | 0.57%(+1.80)#834 |
| 16. | Delton | 2.31% | 0.48%(+1.83)#16 | 0.57%(+1.75)#862 |
| 17. | Romulus | 2.25% | 0.48%(+1.77)#17 | 0.57%(+1.69)#881 |
| 18. | Saginaw | 2.24% | 0.48%(+1.75)#18 | 0.57%(+1.67)#890 |
| 19. | Eastwood | 2.09% | 0.48%(+1.61)#19 | 0.57%(+1.53)#973 |
| 20. | Niles | 1.92% | 0.48%(+1.44)#20 | 0.57%(+1.36)#1,078 |
| 21. | Cutlerville | 1.89% | 0.48%(+1.40)#21 | 0.57%(+1.32)#1,099 |
| 22. | Oakley | 1.85% | 0.48%(+1.37)#22 | 0.57%(+1.29)#1,119 |
| 23. | Southfield | 1.67% | 0.48%(+1.19)#23 | 0.57%(+1.11)#1,248 |
| 24. | Comstock Northwest | 1.66% | 0.48%(+1.17)#24 | 0.57%(+1.09)#1,266 |
| 25. | Galesburg | 1.64% | 0.48%(+1.16)#25 | 0.57%(+1.08)#1,284 |
| 26. | Berrien Springs | 1.43% | 0.48%(+0.950)#26 | 0.57%(+0.869)#1,493 |
| 27. | Taylor | 1.43% | 0.48%(+0.946)#27 | 0.57%(+0.865)#1,500 |
| 28. | Suttons Bay | 1.40% | 0.48%(+0.917)#28 | 0.57%(+0.837)#1,539 |
| 29. | Muskegon | 1.39% | 0.48%(+0.908)#29 | 0.57%(+0.827)#1,555 |
| 30. | Garden City | 1.32% | 0.48%(+0.839)#30 | 0.57%(+0.758)#1,640 |
| 31. | Oak Park | 1.32% | 0.48%(+0.834)#31 | 0.57%(+0.754)#1,648 |
| 32. | Flint | 1.31% | 0.48%(+0.830)#32 | 0.57%(+0.749)#1,660 |
| 33. | Brownlee Park | 1.29% | 0.48%(+0.810)#33 | 0.57%(+0.729)#1,686 |
| 34. | Detroit | 1.29% | 0.48%(+0.809)#34 | 0.57%(+0.728)#1,689 |
| 35. | Mount Clemens | 1.28% | 0.48%(+0.797)#35 | 0.57%(+0.717)#1,705 |
| 36. | Saline | 1.28% | 0.48%(+0.797)#36 | 0.57%(+0.716)#1,706 |
| 37. | Lyons | 1.19% | 0.48%(+0.705)#37 | 0.57%(+0.624)#1,822 |
| 38. | Ossineke | 1.17% | 0.48%(+0.689)#38 | 0.57%(+0.608)#1,849 |
| 39. | Lathrup Village | 1.15% | 0.48%(+0.669)#39 | 0.57%(+0.588)#1,878 |
| 40. | Lansing | 1.12% | 0.48%(+0.636)#40 | 0.57%(+0.555)#1,926 |
| 41. | Kentwood | 1.08% | 0.48%(+0.596)#41 | 0.57%(+0.515)#1,994 |
| 42. | Plymouth | 1.08% | 0.48%(+0.591)#42 | 0.57%(+0.510)#2,007 |
| 43. | Livonia | 1.05% | 0.48%(+0.563)#43 | 0.57%(+0.482)#2,058 |
| 44. | New Haven | 0.98% | 0.48%(+0.499)#44 | 0.57%(+0.419)#2,164 |
| 45. | Armada | 0.98% | 0.48%(+0.496)#45 | 0.57%(+0.416)#2,170 |
| 46. | Holland | 0.98% | 0.48%(+0.495)#46 | 0.57%(+0.415)#2,173 |
| 47. | Mattawan | 0.97% | 0.48%(+0.490)#47 | 0.57%(+0.409)#2,187 |
| 48. | Cement City | 0.91% | 0.48%(+0.423)#48 | 0.57%(+0.342)#2,329 |
| 49. | Petoskey | 0.90% | 0.48%(+0.420)#49 | 0.57%(+0.339)#2,334 |
| 50. | Otisville | 0.88% | 0.48%(+0.395)#50 | 0.57%(+0.314)#2,383 |
| 51. | Coldwater | 0.88% | 0.48%(+0.391)#51 | 0.57%(+0.310)#2,393 |
| 52. | Mayville | 0.86% | 0.48%(+0.372)#52 | 0.57%(+0.292)#2,443 |
| 53. | Farmington Hills | 0.85% | 0.48%(+0.368)#53 | 0.57%(+0.287)#2,453 |
| 54. | Westphalia | 0.84% | 0.48%(+0.356)#54 | 0.57%(+0.275)#2,479 |
| 55. | Eastpointe | 0.84% | 0.48%(+0.352)#55 | 0.57%(+0.271)#2,492 |
| 56. | Holt | 0.83% | 0.48%(+0.347)#56 | 0.57%(+0.266)#2,503 |
| 57. | Ionia | 0.83% | 0.48%(+0.341)#57 | 0.57%(+0.260)#2,516 |
| 58. | Bridgeport | 0.82% | 0.48%(+0.332)#58 | 0.57%(+0.251)#2,544 |
| 59. | Grand Marais | 0.78% | 0.48%(+0.297)#59 | 0.57%(+0.216)#2,640 |
| 60. | Freeland | 0.75% | 0.48%(+0.263)#60 | 0.57%(+0.182)#2,748 |
| 61. | Grand Rapids | 0.73% | 0.48%(+0.247)#61 | 0.57%(+0.166)#2,792 |
| 62. | South Monroe | 0.72% | 0.48%(+0.236)#62 | 0.57%(+0.156)#2,814 |
| 63. | Franklin | 0.72% | 0.48%(+0.232)#63 | 0.57%(+0.151)#2,836 |
| 64. | Ishpeming | 0.69% | 0.48%(+0.210)#64 | 0.57%(+0.129)#2,900 |
| 65. | Baraga | 0.69% | 0.48%(+0.209)#65 | 0.57%(+0.128)#2,907 |
| 66. | Novi | 0.68% | 0.48%(+0.199)#66 | 0.57%(+0.118)#2,939 |
| 67. | Owosso | 0.67% | 0.48%(+0.190)#67 | 0.57%(+0.109)#2,959 |
| 68. | Mount Morris | 0.67% | 0.48%(+0.183)#68 | 0.57%(+0.102)#2,989 |
| 69. | Southgate | 0.66% | 0.48%(+0.177)#69 | 0.57%(+0.096)#3,007 |
| 70. | Hubbell | 0.65% | 0.48%(+0.166)#70 | 0.57%(+0.085)#3,045 |
| 71. | Edgemont Park | 0.61% | 0.48%(+0.129)#71 | 0.57%(+0.048)#3,182 |
| 72. | Wyoming | 0.61% | 0.48%(+0.125)#72 | 0.57%(+0.045)#3,199 |
| 73. | Sand Lake | 0.61% | 0.48%(+0.125)#73 | 0.57%(+0.044)#3,200 |
| 74. | Lawrence | 0.60% | 0.48%(+0.111)#74 | 0.57%(+0.030)#3,252 |
| 75. | Mount Pleasant | 0.59% | 0.48%(+0.102)#75 | 0.57%(+0.021)#3,285 |
| 76. | Beecher | 0.58% | 0.48%(+0.099)#76 | 0.57%(+0.018)#3,298 |
| 77. | Clinton | 0.58% | 0.48%(+0.096)#77 | 0.57%(+0.015)#3,310 |
| 78. | Harper Woods | 0.56% | 0.48%(+0.071)#78 | 0.57%(-0.010)#3,415 |
| 79. | Dowagiac | 0.55% | 0.48%(+0.061)#79 | 0.57%(-0.020)#3,455 |
| 80. | St Johns | 0.54% | 0.48%(+0.060)#80 | 0.57%(-0.021)#3,458 |
| 81. | Waverly | 0.54% | 0.48%(+0.059)#81 | 0.57%(-0.022)#3,462 |
| 82. | Pontiac | 0.54% | 0.48%(+0.058)#82 | 0.57%(-0.023)#3,469 |
| 83. | Manchester | 0.53% | 0.48%(+0.046)#83 | 0.57%(-0.035)#3,506 |
| 84. | Muir | 0.51% | 0.48%(+0.023)#84 | 0.57%(-0.058)#3,607 |
| 85. | Beaverton | 0.50% | 0.48%(+0.018)#85 | 0.57%(-0.063)#3,625 |
| 86. | Kalamazoo | 0.50% | 0.48%(+0.017)#86 | 0.57%(-0.064)#3,632 |
| 87. | Ypsilanti | 0.49% | 0.48%(+0.001)#87 | 0.57%(-0.080)#3,710 |
| 88. | Cass City | 0.48% | 0.48%(-0.001)#88 | 0.57%(-0.082)#3,714 |
| 89. | Allegan | 0.48% | 0.48%(-0.002)#89 | 0.57%(-0.083)#3,724 |
| 90. | Lawton | 0.48% | 0.48%(-0.003)#90 | 0.57%(-0.084)#3,730 |
| 91. | Brutus | 0.47% | 0.48%(-0.011)#91 | 0.57%(-0.091)#3,760 |
| 92. | Grosse Pointe Farms | 0.45% | 0.48%(-0.035)#92 | 0.57%(-0.116)#3,891 |
| 93. | Clare | 0.45% | 0.48%(-0.039)#93 | 0.57%(-0.120)#3,910 |
| 94. | Brighton | 0.44% | 0.48%(-0.044)#94 | 0.57%(-0.125)#3,934 |
| 95. | Belleville | 0.43% | 0.48%(-0.057)#95 | 0.57%(-0.138)#4,014 |
| 96. | Frankenmuth | 0.41% | 0.48%(-0.070)#96 | 0.57%(-0.151)#4,085 |
| 97. | Burton | 0.41% | 0.48%(-0.079)#97 | 0.57%(-0.160)#4,127 |
| 98. | Haslett | 0.40% | 0.48%(-0.081)#98 | 0.57%(-0.162)#4,136 |
| 99. | Harrisville | 0.40% | 0.48%(-0.084)#99 | 0.57%(-0.165)#4,150 |
| 100. | Auburn Hills | 0.40% | 0.48%(-0.086)#100 | 0.57%(-0.167)#4,158 |
Common Questions
What are the Top 10 Cities with the Highest Percentage of African Population in Michigan?
Top 10 Cities with the Highest Percentage of African Population in Michigan are:
#1
13.29%
#2
12.23%
#3
7.88%
#4
7.80%
#5
7.01%
#6
5.90%
#7
5.19%
#8
4.64%
#9
3.58%
#10
3.25%
What city has the Highest Percentage of African Population in Michigan?
Benton Heights has the Highest Percentage of African Population in Michigan with 13.29%.
What is the Percentage of African Population in the State of Michigan?
Percentage of African Population in Michigan is 0.48%.
What is the Percentage of African Population in the United States?
Percentage of African Population in the United States is 0.57%.