Cities with the Highest Percentage of Immigrants from Iraq in Michigan
RELATED REPORTS & OPTIONS
Iraq
Michigan
Compare Cities
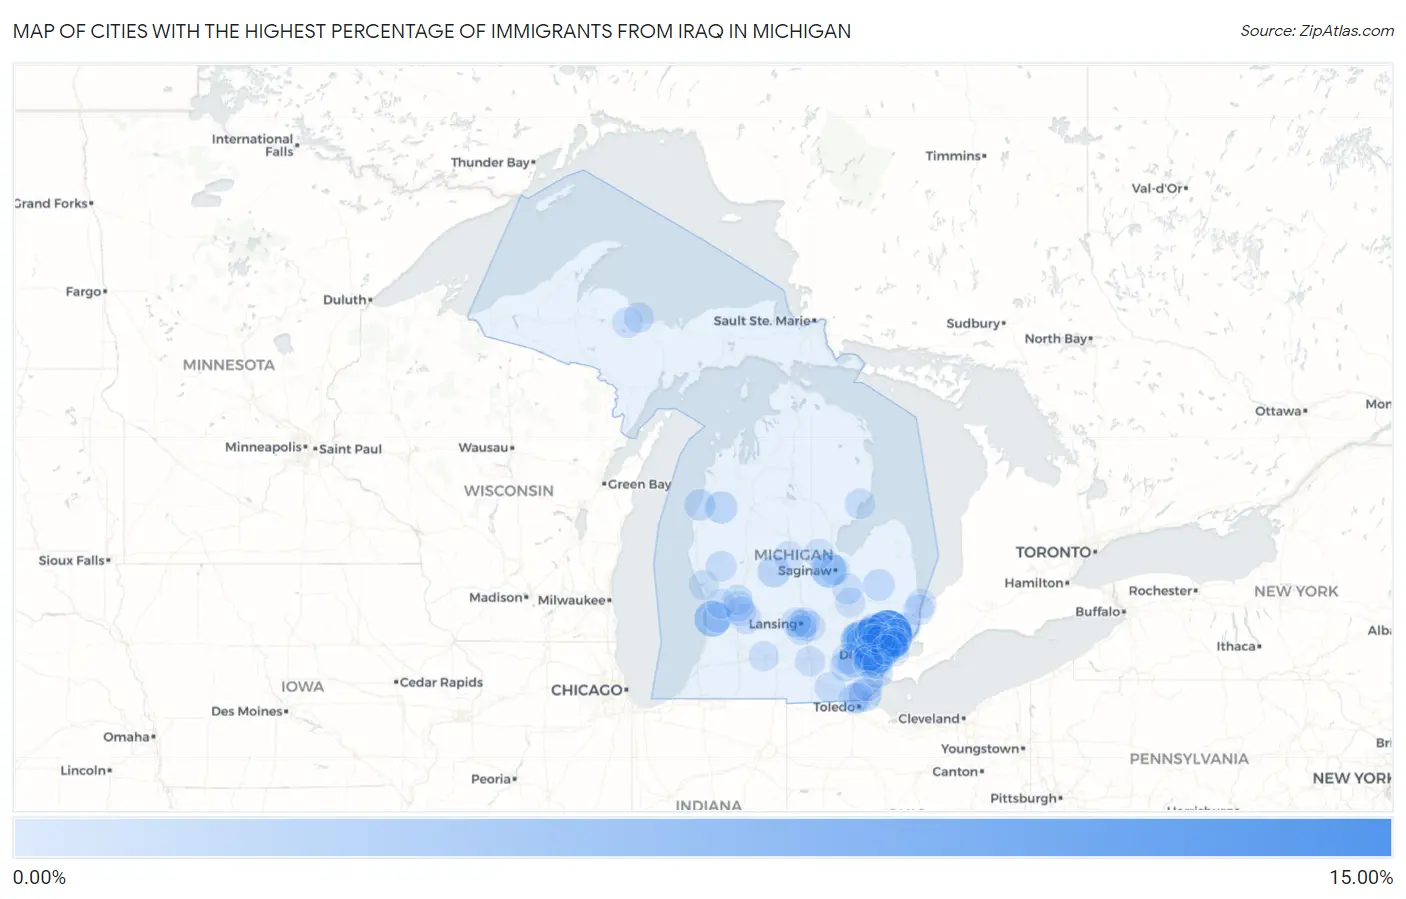
Map of Cities with the Highest Percentage of Immigrants from Iraq in Michigan
0.00%
15.00%
Cities with the Highest Percentage of Immigrants from Iraq in Michigan
| City | Iraq | vs State | vs National | |
| 1. | Sterling Heights | 13.14% | 0.56%(+12.6)#8 | 0.071%(+13.1)#316 |
| 2. | Walled Lake | 4.90% | 0.56%(+4.35)#9 | 0.071%(+4.83)#317 |
| 3. | Dearborn Heights | 4.05% | 0.56%(+3.49)#10 | 0.071%(+3.98)#318 |
| 4. | Beechwood | 4.00% | 0.56%(+3.44)#11 | 0.071%(+3.93)#319 |
| 5. | Wixom | 3.93% | 0.56%(+3.37)#12 | 0.071%(+3.86)#320 |
| 6. | Madison Heights | 3.91% | 0.56%(+3.35)#13 | 0.071%(+3.84)#321 |
| 7. | Shields | 3.34% | 0.56%(+2.79)#14 | 0.071%(+3.27)#322 |
| 8. | Warren | 2.98% | 0.56%(+2.42)#15 | 0.071%(+2.90)#323 |
| 9. | Dearborn | 2.88% | 0.56%(+2.33)#16 | 0.071%(+2.81)#324 |
| 10. | Farmington Hills | 2.56% | 0.56%(+2.00)#17 | 0.071%(+2.49)#325 |
| 11. | Hazel Park | 2.56% | 0.56%(+2.00)#18 | 0.071%(+2.48)#326 |
| 12. | Orchard Lake Village | 2.39% | 0.56%(+1.83)#19 | 0.071%(+2.32)#327 |
| 13. | Troy | 2.20% | 0.56%(+1.65)#20 | 0.071%(+2.13)#328 |
| 14. | Luna Pier | 1.71% | 0.56%(+1.16)#21 | 0.071%(+1.64)#329 |
| 15. | Edmore | 1.56% | 0.56%(+1.00)#22 | 0.071%(+1.49)#330 |
| 16. | Ypsilanti | 1.42% | 0.56%(+0.864)#23 | 0.071%(+1.35)#331 |
| 17. | Wellston | 1.34% | 0.56%(+0.783)#24 | 0.071%(+1.27)#332 |
| 18. | Bloomfield Hills | 1.32% | 0.56%(+0.761)#25 | 0.071%(+1.25)#333 |
| 19. | Ida | 1.17% | 0.56%(+0.610)#26 | 0.071%(+1.10)#334 |
| 20. | Southfield | 1.12% | 0.56%(+0.564)#27 | 0.071%(+1.05)#335 |
| 21. | Oak Park | 1.11% | 0.56%(+0.549)#28 | 0.071%(+1.03)#336 |
| 22. | Fraser | 1.08% | 0.56%(+0.521)#29 | 0.071%(+1.01)#337 |
| 23. | Inkster | 1.08% | 0.56%(+0.520)#30 | 0.071%(+1.01)#338 |
| 24. | Center Line | 1.04% | 0.56%(+0.480)#31 | 0.071%(+0.965)#339 |
| 25. | Garden City | 1.00% | 0.56%(+0.447)#32 | 0.071%(+0.933)#340 |
| 26. | Novi | 0.94% | 0.56%(+0.388)#33 | 0.071%(+0.874)#341 |
| 27. | Manistee | 0.91% | 0.56%(+0.356)#34 | 0.071%(+0.842)#342 |
| 28. | North Branch | 0.90% | 0.56%(+0.345)#35 | 0.071%(+0.830)#343 |
| 29. | Taylor | 0.70% | 0.56%(+0.143)#36 | 0.071%(+0.628)#344 |
| 30. | Rochester Hills | 0.69% | 0.56%(+0.134)#37 | 0.071%(+0.620)#345 |
| 31. | Berkley | 0.61% | 0.56%(+0.058)#38 | 0.071%(+0.543)#346 |
| 32. | Gibraltar | 0.48% | 0.56%(-0.071)#39 | 0.071%(+0.414)#347 |
| 33. | Marysville | 0.48% | 0.56%(-0.075)#40 | 0.071%(+0.411)#348 |
| 34. | Adrian | 0.45% | 0.56%(-0.110)#41 | 0.071%(+0.376)#349 |
| 35. | Utica | 0.44% | 0.56%(-0.114)#42 | 0.071%(+0.372)#350 |
| 36. | Wolverine Lake | 0.42% | 0.56%(-0.133)#43 | 0.071%(+0.352)#351 |
| 37. | Auburn Hills | 0.40% | 0.56%(-0.158)#44 | 0.071%(+0.328)#352 |
| 38. | Clio | 0.40% | 0.56%(-0.161)#45 | 0.071%(+0.325)#353 |
| 39. | Fremont | 0.38% | 0.56%(-0.179)#46 | 0.071%(+0.306)#354 |
| 40. | Bingham Farms | 0.37% | 0.56%(-0.187)#47 | 0.071%(+0.299)#355 |
| 41. | Lathrup Village | 0.37% | 0.56%(-0.188)#48 | 0.071%(+0.297)#356 |
| 42. | Sylvan Lake | 0.35% | 0.56%(-0.209)#49 | 0.071%(+0.276)#357 |
| 43. | Lambertville | 0.35% | 0.56%(-0.211)#50 | 0.071%(+0.275)#358 |
| 44. | Ann Arbor | 0.33% | 0.56%(-0.223)#51 | 0.071%(+0.262)#359 |
| 45. | Highland Park | 0.32% | 0.56%(-0.235)#52 | 0.071%(+0.250)#360 |
| 46. | Okemos | 0.32% | 0.56%(-0.235)#53 | 0.071%(+0.250)#361 |
| 47. | Royal Oak | 0.32% | 0.56%(-0.238)#54 | 0.071%(+0.248)#362 |
| 48. | Zeeland | 0.32% | 0.56%(-0.241)#55 | 0.071%(+0.245)#363 |
| 49. | Negaunee | 0.30% | 0.56%(-0.255)#56 | 0.071%(+0.230)#364 |
| 50. | Keego Harbor | 0.29% | 0.56%(-0.268)#57 | 0.071%(+0.218)#365 |
| 51. | Tawas City | 0.29% | 0.56%(-0.270)#58 | 0.071%(+0.215)#366 |
| 52. | Caledonia | 0.28% | 0.56%(-0.280)#59 | 0.071%(+0.206)#367 |
| 53. | Lansing | 0.27% | 0.56%(-0.288)#60 | 0.071%(+0.197)#412 |
| 54. | Westland | 0.25% | 0.56%(-0.308)#61 | 0.071%(+0.178)#413 |
| 55. | Grosse Pointe Park | 0.23% | 0.56%(-0.322)#62 | 0.071%(+0.164)#414 |
| 56. | Saline | 0.20% | 0.56%(-0.356)#63 | 0.071%(+0.130)#415 |
| 57. | Detroit | 0.20% | 0.56%(-0.357)#64 | 0.071%(+0.129)#416 |
| 58. | Grand Rapids | 0.18% | 0.56%(-0.379)#65 | 0.071%(+0.107)#417 |
| 59. | Marquette | 0.17% | 0.56%(-0.382)#66 | 0.071%(+0.103)#418 |
| 60. | Jackson | 0.16% | 0.56%(-0.394)#67 | 0.071%(+0.092)#419 |
| 61. | Rochester | 0.16% | 0.56%(-0.395)#68 | 0.071%(+0.091)#420 |
| 62. | Beverly Hills | 0.16% | 0.56%(-0.395)#69 | 0.071%(+0.090)#421 |
| 63. | Ferndale | 0.16% | 0.56%(-0.395)#70 | 0.071%(+0.090)#422 |
| 64. | Roseville | 0.16% | 0.56%(-0.398)#71 | 0.071%(+0.087)#423 |
| 65. | New Baltimore | 0.16% | 0.56%(-0.399)#72 | 0.071%(+0.086)#424 |
| 66. | Temperance | 0.15% | 0.56%(-0.403)#73 | 0.071%(+0.083)#425 |
| 67. | Franklin | 0.15% | 0.56%(-0.406)#74 | 0.071%(+0.080)#426 |
| 68. | Livonia | 0.15% | 0.56%(-0.407)#75 | 0.071%(+0.079)#427 |
| 69. | Holt | 0.15% | 0.56%(-0.410)#76 | 0.071%(+0.075)#428 |
| 70. | Muskegon | 0.14% | 0.56%(-0.418)#77 | 0.071%(+0.068)#429 |
| 71. | Clawson | 0.13% | 0.56%(-0.425)#78 | 0.071%(+0.061)#430 |
| 72. | Comstock Park | 0.12% | 0.56%(-0.441)#79 | 0.071%(+0.045)#431 |
| 73. | East Lansing | 0.10% | 0.56%(-0.453)#80 | 0.071%(+0.033)#432 |
| 74. | Wayne | 0.10% | 0.56%(-0.454)#81 | 0.071%(+0.032)#433 |
| 75. | Romulus | 0.092% | 0.56%(-0.465)#82 | 0.071%(+0.021)#434 |
| 76. | Harper Woods | 0.092% | 0.56%(-0.465)#83 | 0.071%(+0.021)#435 |
| 77. | Birmingham | 0.078% | 0.56%(-0.478)#84 | 0.071%(+0.008)#436 |
| 78. | Mount Clemens | 0.077% | 0.56%(-0.480)#85 | 0.071%(+0.006)#437 |
| 79. | Port Huron | 0.066% | 0.56%(-0.491)#86 | 0.071%(-0.005)#438 |
| 80. | Eastpointe | 0.059% | 0.56%(-0.498)#87 | 0.071%(-0.012)#439 |
| 81. | Pontiac | 0.055% | 0.56%(-0.501)#88 | 0.071%(-0.016)#440 |
| 82. | Kentwood | 0.054% | 0.56%(-0.503)#89 | 0.071%(-0.017)#441 |
| 83. | Southgate | 0.053% | 0.56%(-0.503)#90 | 0.071%(-0.017)#442 |
| 84. | Waverly | 0.051% | 0.56%(-0.506)#91 | 0.071%(-0.020)#443 |
| 85. | Saginaw | 0.050% | 0.56%(-0.507)#92 | 0.071%(-0.021)#444 |
| 86. | Flint | 0.037% | 0.56%(-0.520)#93 | 0.071%(-0.034)#445 |
| 87. | Monroe | 0.034% | 0.56%(-0.522)#94 | 0.071%(-0.036)#446 |
| 88. | St Clair Shores | 0.027% | 0.56%(-0.529)#95 | 0.071%(-0.043)#447 |
| 89. | Mount Pleasant | 0.023% | 0.56%(-0.533)#96 | 0.071%(-0.048)#448 |
| 90. | Hamtramck | 0.022% | 0.56%(-0.535)#97 | 0.071%(-0.049)#449 |
| 91. | Battle Creek | 0.017% | 0.56%(-0.539)#98 | 0.071%(-0.054)#450 |
| 92. | Allendale | 0.012% | 0.56%(-0.544)#99 | 0.071%(-0.059)#451 |
| 93. | Midland | 0.0094% | 0.56%(-0.547)#100 | 0.071%(-0.061)#452 |
Common Questions
What are the Top 10 Cities with the Highest Percentage of Immigrants from Iraq in Michigan?
Top 10 Cities with the Highest Percentage of Immigrants from Iraq in Michigan are:
#1
13.14%
#2
4.90%
#3
4.05%
#4
4.00%
#5
3.93%
#6
3.91%
#7
3.34%
#8
2.98%
#9
2.88%
#10
2.56%
What city has the Highest Percentage of Immigrants from Iraq in Michigan?
Sterling Heights has the Highest Percentage of Immigrants from Iraq in Michigan with 13.14%.
What is the Percentage of Immigrants from Iraq in the State of Michigan?
Percentage of Immigrants from Iraq in Michigan is 0.56%.
What is the Percentage of Immigrants from Iraq in the United States?
Percentage of Immigrants from Iraq in the United States is 0.071%.