Cities with the Highest Poverty Level Among Children Under the Age of 5 in Michigan
RELATED REPORTS & OPTIONS
Highest Poverty | Child 0-5
Michigan
Compare Cities
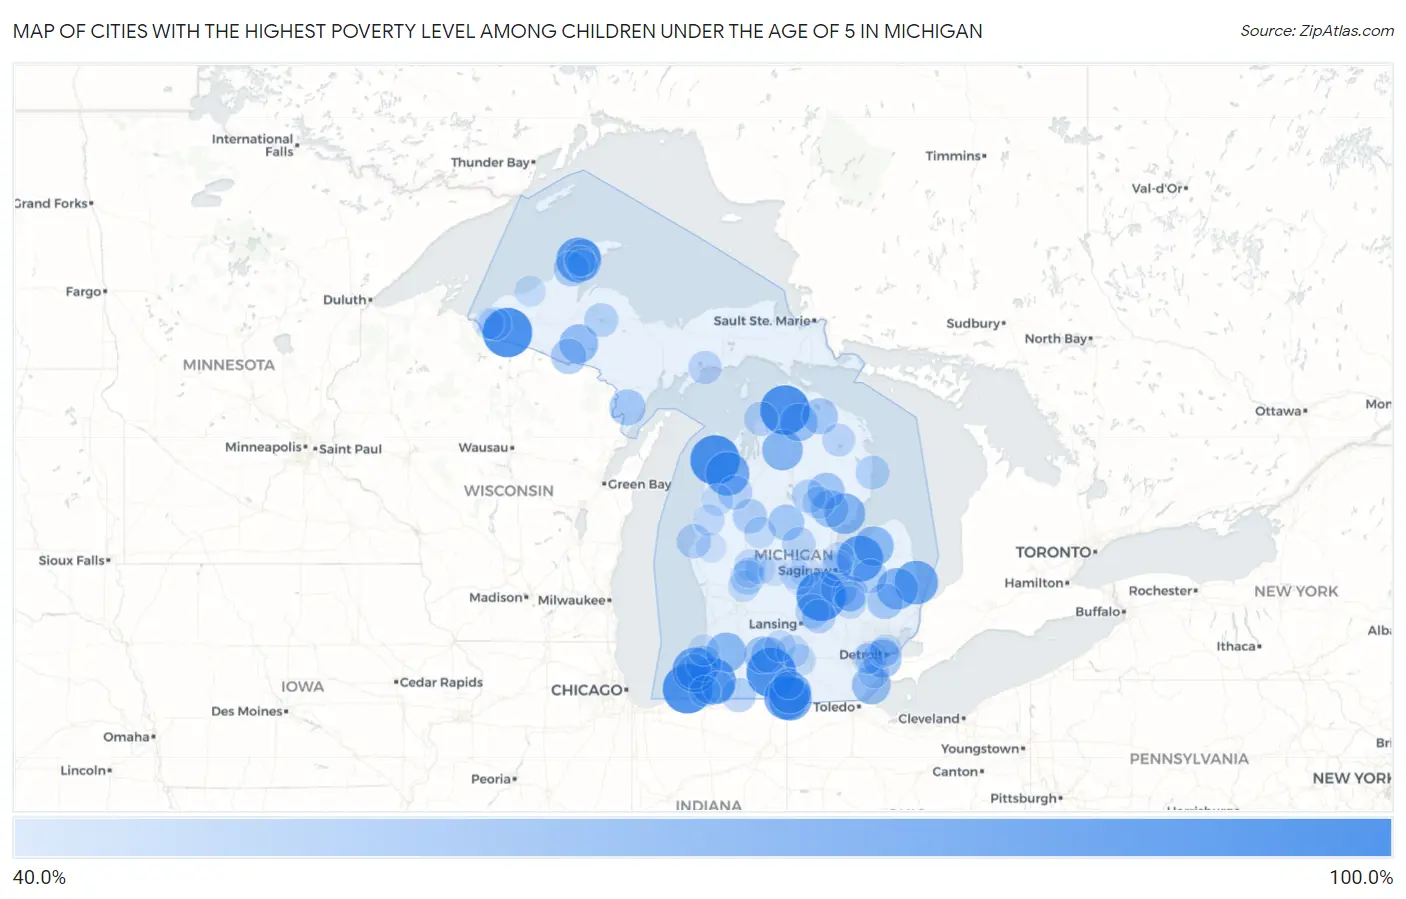
Map of Cities with the Highest Poverty Level Among Children Under the Age of 5 in Michigan
0.0%
100.0%
Cities with the Highest Poverty Level Among Children Under the Age of 5 in Michigan
| City | Child Poverty | vs State | vs National | |
| 1. | Millburg | 100.0% | 20.1%(+79.9)#1 | 18.1%(+81.9)#327 |
| 2. | Shaftsburg | 100.0% | 20.1%(+79.9)#2 | 18.1%(+81.9)#359 |
| 3. | Empire | 100.0% | 20.1%(+79.9)#3 | 18.1%(+81.9)#375 |
| 4. | New Troy | 100.0% | 20.1%(+79.9)#4 | 18.1%(+81.9)#393 |
| 5. | Oden | 100.0% | 20.1%(+79.9)#5 | 18.1%(+81.9)#436 |
| 6. | Tower | 100.0% | 20.1%(+79.9)#6 | 18.1%(+81.9)#441 |
| 7. | Henderson | 100.0% | 20.1%(+79.9)#7 | 18.1%(+81.9)#465 |
| 8. | Paris | 100.0% | 20.1%(+79.9)#8 | 18.1%(+81.9)#475 |
| 9. | Winn | 100.0% | 20.1%(+79.9)#9 | 18.1%(+81.9)#486 |
| 10. | Marenisco | 100.0% | 20.1%(+79.9)#10 | 18.1%(+81.9)#502 |
| 11. | Burlington | 100.0% | 20.1%(+79.9)#11 | 18.1%(+81.9)#523 |
| 12. | Naubinway | 100.0% | 20.1%(+79.9)#12 | 18.1%(+81.9)#819 |
| 13. | Dowagiac | 91.5% | 20.1%(+71.4)#13 | 18.1%(+73.5)#997 |
| 14. | Akron | 90.0% | 20.1%(+69.9)#14 | 18.1%(+71.9)#1,028 |
| 15. | Calumet | 87.0% | 20.1%(+66.9)#15 | 18.1%(+69.0)#1,098 |
| 16. | Benton Heights | 87.0% | 20.1%(+66.9)#16 | 18.1%(+68.9)#1,101 |
| 17. | Montgomery | 84.6% | 20.1%(+64.5)#17 | 18.1%(+66.6)#1,166 |
| 18. | Bendon | 83.7% | 20.1%(+63.6)#18 | 18.1%(+65.7)#1,199 |
| 19. | Lexington | 83.3% | 20.1%(+63.2)#19 | 18.1%(+65.3)#1,208 |
| 20. | Camden | 83.3% | 20.1%(+63.2)#20 | 18.1%(+65.3)#1,210 |
| 21. | Reading | 78.8% | 20.1%(+58.7)#21 | 18.1%(+60.8)#1,378 |
| 22. | Melvin | 76.9% | 20.1%(+56.8)#22 | 18.1%(+58.9)#1,455 |
| 23. | Lakes Of The North | 75.0% | 20.1%(+54.9)#23 | 18.1%(+56.9)#1,514 |
| 24. | Turner | 75.0% | 20.1%(+54.9)#24 | 18.1%(+56.9)#1,555 |
| 25. | Gobles | 72.7% | 20.1%(+52.6)#25 | 18.1%(+54.7)#1,645 |
| 26. | Owendale | 72.7% | 20.1%(+52.6)#26 | 18.1%(+54.7)#1,648 |
| 27. | Amasa | 69.2% | 20.1%(+49.1)#27 | 18.1%(+51.2)#1,835 |
| 28. | Detroit Beach | 69.1% | 20.1%(+49.0)#28 | 18.1%(+51.0)#1,844 |
| 29. | River Rouge | 67.8% | 20.1%(+47.6)#29 | 18.1%(+49.7)#1,908 |
| 30. | Wolverine | 66.7% | 20.1%(+46.5)#30 | 18.1%(+48.6)#2,013 |
| 31. | Skidway Lake | 65.3% | 20.1%(+45.2)#31 | 18.1%(+47.2)#2,094 |
| 32. | Springfield | 64.9% | 20.1%(+44.8)#32 | 18.1%(+46.8)#2,125 |
| 33. | Rose City | 64.3% | 20.1%(+44.2)#33 | 18.1%(+46.2)#2,164 |
| 34. | Copper City | 63.6% | 20.1%(+43.5)#34 | 18.1%(+45.6)#2,216 |
| 35. | Montrose | 63.0% | 20.1%(+42.9)#35 | 18.1%(+44.9)#2,256 |
| 36. | Daggett | 62.5% | 20.1%(+42.4)#36 | 18.1%(+44.4)#2,312 |
| 37. | Onaway | 62.0% | 20.1%(+41.9)#37 | 18.1%(+43.9)#2,341 |
| 38. | Harrison | 62.0% | 20.1%(+41.9)#38 | 18.1%(+43.9)#2,343 |
| 39. | Brownlee Park | 61.1% | 20.1%(+41.0)#39 | 18.1%(+43.0)#2,412 |
| 40. | Paw Paw Lake | 61.1% | 20.1%(+40.9)#40 | 18.1%(+43.0)#2,423 |
| 41. | Mount Morris | 61.0% | 20.1%(+40.8)#41 | 18.1%(+42.9)#2,430 |
| 42. | Imlay City | 60.9% | 20.1%(+40.8)#42 | 18.1%(+42.9)#2,434 |
| 43. | Iron River | 60.5% | 20.1%(+40.4)#43 | 18.1%(+42.5)#2,470 |
| 44. | Hancock | 59.7% | 20.1%(+39.6)#44 | 18.1%(+41.7)#2,560 |
| 45. | Benton Harbor | 58.9% | 20.1%(+38.8)#45 | 18.1%(+40.9)#2,606 |
| 46. | Kincheloe | 58.8% | 20.1%(+38.7)#46 | 18.1%(+40.7)#2,626 |
| 47. | Tustin | 57.7% | 20.1%(+37.6)#47 | 18.1%(+39.6)#2,713 |
| 48. | Mayville | 57.3% | 20.1%(+37.2)#48 | 18.1%(+39.3)#2,741 |
| 49. | Pentwater | 57.1% | 20.1%(+37.0)#49 | 18.1%(+39.1)#2,754 |
| 50. | Mesick | 57.1% | 20.1%(+37.0)#50 | 18.1%(+39.1)#2,762 |
| 51. | Pierson | 57.1% | 20.1%(+37.0)#51 | 18.1%(+39.1)#2,775 |
| 52. | White Pigeon | 56.8% | 20.1%(+36.7)#52 | 18.1%(+38.8)#2,789 |
| 53. | Laingsburg | 56.5% | 20.1%(+36.4)#53 | 18.1%(+38.5)#2,814 |
| 54. | Charlevoix | 56.3% | 20.1%(+36.2)#54 | 18.1%(+38.3)#2,832 |
| 55. | Perry | 56.3% | 20.1%(+36.2)#55 | 18.1%(+38.2)#2,834 |
| 56. | Michigamme | 56.2% | 20.1%(+36.1)#56 | 18.1%(+38.2)#2,843 |
| 57. | Harrisville | 55.9% | 20.1%(+35.8)#57 | 18.1%(+37.8)#2,879 |
| 58. | St Helen | 55.5% | 20.1%(+35.4)#58 | 18.1%(+37.4)#2,934 |
| 59. | Coleman | 54.9% | 20.1%(+34.8)#59 | 18.1%(+36.8)#2,976 |
| 60. | Manistique | 54.5% | 20.1%(+34.3)#60 | 18.1%(+36.4)#3,010 |
| 61. | Wakefield | 54.0% | 20.1%(+33.9)#61 | 18.1%(+36.0)#3,032 |
| 62. | Saginaw | 53.5% | 20.1%(+33.3)#62 | 18.1%(+35.4)#3,090 |
| 63. | Hillman | 53.3% | 20.1%(+33.2)#63 | 18.1%(+35.3)#3,102 |
| 64. | Springport | 52.8% | 20.1%(+32.7)#64 | 18.1%(+34.8)#3,160 |
| 65. | Inkster | 52.8% | 20.1%(+32.7)#65 | 18.1%(+34.7)#3,163 |
| 66. | Cassopolis | 52.7% | 20.1%(+32.6)#66 | 18.1%(+34.6)#3,171 |
| 67. | West Branch | 52.3% | 20.1%(+32.2)#67 | 18.1%(+34.3)#3,203 |
| 68. | Flint | 51.7% | 20.1%(+31.6)#68 | 18.1%(+33.7)#3,261 |
| 69. | Crystal | 51.6% | 20.1%(+31.5)#69 | 18.1%(+33.6)#3,270 |
| 70. | Evart | 50.5% | 20.1%(+30.3)#70 | 18.1%(+32.4)#3,370 |
| 71. | Flat Rock | 50.3% | 20.1%(+30.2)#71 | 18.1%(+32.3)#3,380 |
| 72. | Hamtramck | 50.1% | 20.1%(+30.0)#72 | 18.1%(+32.1)#3,392 |
| 73. | Olivet | 50.0% | 20.1%(+29.9)#73 | 18.1%(+31.9)#3,410 |
| 74. | Parma | 50.0% | 20.1%(+29.9)#74 | 18.1%(+31.9)#3,435 |
| 75. | Morley | 50.0% | 20.1%(+29.9)#75 | 18.1%(+31.9)#3,437 |
| 76. | Brethren | 50.0% | 20.1%(+29.9)#76 | 18.1%(+31.9)#3,477 |
| 77. | Rapid River | 50.0% | 20.1%(+29.9)#77 | 18.1%(+31.9)#3,496 |
| 78. | Fountain | 50.0% | 20.1%(+29.9)#78 | 18.1%(+31.9)#3,523 |
| 79. | Cedar Springs | 49.7% | 20.1%(+29.6)#79 | 18.1%(+31.6)#3,589 |
| 80. | Niles | 49.2% | 20.1%(+29.1)#80 | 18.1%(+31.2)#3,625 |
| 81. | South Haven | 48.9% | 20.1%(+28.8)#81 | 18.1%(+30.8)#3,653 |
| 82. | Lake Linden | 48.8% | 20.1%(+28.7)#82 | 18.1%(+30.8)#3,662 |
| 83. | Breckenridge | 48.7% | 20.1%(+28.6)#83 | 18.1%(+30.7)#3,672 |
| 84. | Bay City | 48.6% | 20.1%(+28.5)#84 | 18.1%(+30.5)#3,685 |
| 85. | Laurium | 48.6% | 20.1%(+28.5)#85 | 18.1%(+30.5)#3,687 |
| 86. | Ontonagon | 48.4% | 20.1%(+28.3)#86 | 18.1%(+30.3)#3,707 |
| 87. | Pittsford | 48.4% | 20.1%(+28.3)#87 | 18.1%(+30.3)#3,710 |
| 88. | Lakeview | 48.3% | 20.1%(+28.2)#88 | 18.1%(+30.3)#3,712 |
| 89. | Wayne | 48.1% | 20.1%(+28.0)#89 | 18.1%(+30.1)#3,739 |
| 90. | Howard City | 48.0% | 20.1%(+27.8)#90 | 18.1%(+29.9)#3,758 |
| 91. | Bessemer | 47.8% | 20.1%(+27.7)#91 | 18.1%(+29.8)#3,775 |
| 92. | Allen | 47.6% | 20.1%(+27.5)#92 | 18.1%(+29.6)#3,797 |
| 93. | Alma | 47.1% | 20.1%(+27.0)#93 | 18.1%(+29.1)#3,855 |
| 94. | Beecher | 46.9% | 20.1%(+26.7)#94 | 18.1%(+28.8)#3,892 |
| 95. | Detroit | 46.7% | 20.1%(+26.6)#95 | 18.1%(+28.7)#3,907 |
| 96. | Mohawk | 46.7% | 20.1%(+26.5)#96 | 18.1%(+28.6)#3,927 |
| 97. | Walkerville | 46.2% | 20.1%(+26.0)#97 | 18.1%(+28.1)#4,007 |
| 98. | Zilwaukee | 46.0% | 20.1%(+25.9)#98 | 18.1%(+28.0)#4,015 |
| 99. | Edmore | 46.0% | 20.1%(+25.9)#99 | 18.1%(+27.9)#4,022 |
| 100. | Ithaca | 45.9% | 20.1%(+25.8)#100 | 18.1%(+27.9)#4,030 |
Common Questions
What are the Top 10 Cities with the Highest Poverty Level Among Children Under the Age of 5 in Michigan?
Top 10 Cities with the Highest Poverty Level Among Children Under the Age of 5 in Michigan are:
#1
100.0%
#2
100.0%
#3
100.0%
#4
100.0%
#5
100.0%
#6
100.0%
#7
91.5%
#8
90.0%
#9
87.0%
#10
87.0%
What city has the Highest Poverty Level Among Children Under the Age of 5 in Michigan?
Empire has the Highest Poverty Level Among Children Under the Age of 5 in Michigan with 100.0%.
What is the Poverty Level Among Children Under the Age of 5 in the State of Michigan?
Poverty Level Among Children Under the Age of 5 in Michigan is 20.1%.
What is the Poverty Level Among Children Under the Age of 5 in the United States?
Poverty Level Among Children Under the Age of 5 in the United States is 18.1%.