Cities with the Most Immigrants from Philippines in Michigan
RELATED REPORTS & OPTIONS
Philippines
Michigan
Compare Cities
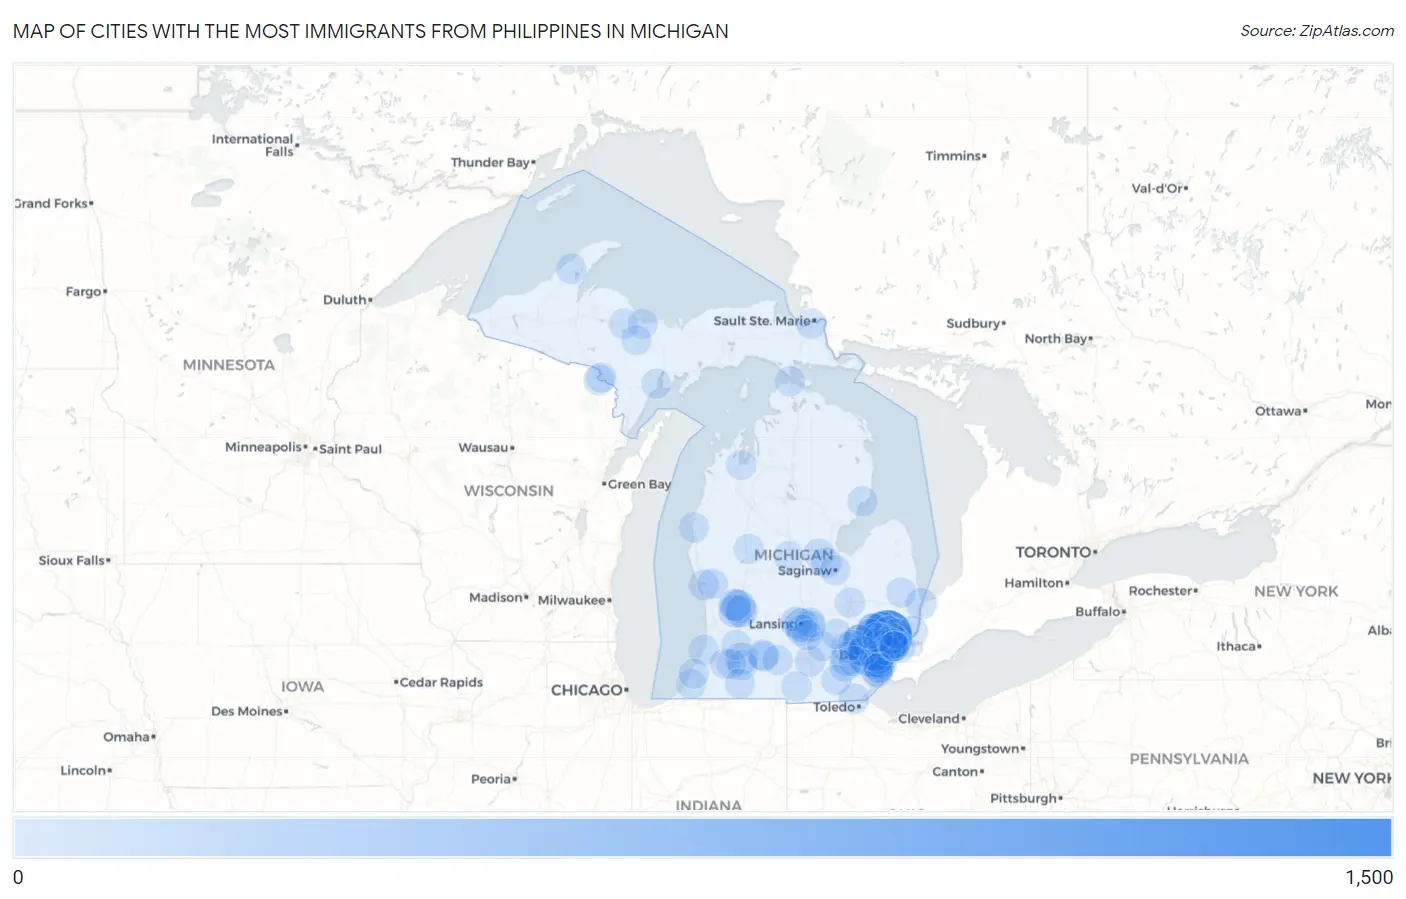
Map of Cities with the Most Immigrants from Philippines in Michigan
0
1,500
Cities with the Most Immigrants from Philippines in Michigan
| City | Philippines | vs State | vs National | |
| 1. | Sterling Heights | 1,499 | 19,112(7.84%)#1 | 1,985,710(0.08%)#192 |
| 2. | Warren | 927 | 19,112(4.85%)#2 | 1,985,710(0.05%)#318 |
| 3. | Westland | 753 | 19,112(3.94%)#3 | 1,985,710(0.04%)#388 |
| 4. | Livonia | 602 | 19,112(3.15%)#4 | 1,985,710(0.03%)#478 |
| 5. | Troy | 542 | 19,112(2.84%)#5 | 1,985,710(0.03%)#515 |
| 6. | Novi | 539 | 19,112(2.82%)#6 | 1,985,710(0.03%)#521 |
| 7. | Farmington Hills | 411 | 19,112(2.15%)#7 | 1,985,710(0.02%)#652 |
| 8. | Rochester Hills | 337 | 19,112(1.76%)#8 | 1,985,710(0.02%)#754 |
| 9. | Ann Arbor | 303 | 19,112(1.59%)#9 | 1,985,710(0.02%)#811 |
| 10. | Detroit | 294 | 19,112(1.54%)#10 | 1,985,710(0.01%)#841 |
| 11. | Lansing | 248 | 19,112(1.30%)#11 | 1,985,710(0.01%)#971 |
| 12. | Grand Rapids | 239 | 19,112(1.25%)#12 | 1,985,710(0.01%)#998 |
| 13. | Southfield | 216 | 19,112(1.13%)#13 | 1,985,710(0.01%)#1,086 |
| 14. | Madison Heights | 211 | 19,112(1.10%)#14 | 1,985,710(0.01%)#1,108 |
| 15. | Wyoming | 195 | 19,112(1.02%)#15 | 1,985,710(0.01%)#1,188 |
| 16. | Kentwood | 190 | 19,112(0.99%)#16 | 1,985,710(0.01%)#1,216 |
| 17. | Pontiac | 185 | 19,112(0.97%)#17 | 1,985,710(0.01%)#1,243 |
| 18. | Kalamazoo | 183 | 19,112(0.96%)#18 | 1,985,710(0.01%)#1,255 |
| 19. | Walker | 179 | 19,112(0.94%)#19 | 1,985,710(0.01%)#1,282 |
| 20. | Allen Park | 159 | 19,112(0.83%)#20 | 1,985,710(0.01%)#1,388 |
| 21. | Lincoln Park | 139 | 19,112(0.73%)#21 | 1,985,710(0.01%)#1,525 |
| 22. | Woodhaven | 130 | 19,112(0.68%)#22 | 1,985,710(0.01%)#1,614 |
| 23. | St Clair Shores | 127 | 19,112(0.66%)#23 | 1,985,710(0.01%)#1,634 |
| 24. | Waverly | 123 | 19,112(0.64%)#24 | 1,985,710(0.01%)#1,671 |
| 25. | Roseville | 110 | 19,112(0.58%)#25 | 1,985,710(0.01%)#1,791 |
| 26. | Auburn Hills | 110 | 19,112(0.58%)#26 | 1,985,710(0.01%)#1,797 |
| 27. | Okemos | 103 | 19,112(0.54%)#27 | 1,985,710(0.01%)#1,873 |
| 28. | Holt | 102 | 19,112(0.53%)#28 | 1,985,710(0.01%)#1,889 |
| 29. | Taylor | 93 | 19,112(0.49%)#29 | 1,985,710(0.00%)#2,012 |
| 30. | Port Huron | 90 | 19,112(0.47%)#30 | 1,985,710(0.00%)#2,061 |
| 31. | Southgate | 82 | 19,112(0.43%)#31 | 1,985,710(0.00%)#2,173 |
| 32. | Royal Oak | 80 | 19,112(0.42%)#32 | 1,985,710(0.00%)#2,205 |
| 33. | Garden City | 74 | 19,112(0.39%)#33 | 1,985,710(0.00%)#2,323 |
| 34. | Springfield | 68 | 19,112(0.36%)#34 | 1,985,710(0.00%)#2,448 |
| 35. | Saline | 63 | 19,112(0.33%)#35 | 1,985,710(0.00%)#2,552 |
| 36. | Oak Park | 60 | 19,112(0.31%)#36 | 1,985,710(0.00%)#2,608 |
| 37. | Clawson | 57 | 19,112(0.30%)#37 | 1,985,710(0.00%)#2,690 |
| 38. | Pearl Beach | 55 | 19,112(0.29%)#38 | 1,985,710(0.00%)#2,741 |
| 39. | Midland | 54 | 19,112(0.28%)#39 | 1,985,710(0.00%)#2,749 |
| 40. | Center Line | 50 | 19,112(0.26%)#40 | 1,985,710(0.00%)#2,888 |
| 41. | Battle Creek | 49 | 19,112(0.26%)#41 | 1,985,710(0.00%)#2,908 |
| 42. | Village Of Grosse Pointe Shores | 49 | 19,112(0.26%)#42 | 1,985,710(0.00%)#2,935 |
| 43. | Muskegon | 48 | 19,112(0.25%)#43 | 1,985,710(0.00%)#2,940 |
| 44. | Freeland | 45 | 19,112(0.24%)#44 | 1,985,710(0.00%)#3,049 |
| 45. | Kingsford | 45 | 19,112(0.24%)#45 | 1,985,710(0.00%)#3,054 |
| 46. | Hancock | 44 | 19,112(0.23%)#46 | 1,985,710(0.00%)#3,089 |
| 47. | South Haven | 44 | 19,112(0.23%)#47 | 1,985,710(0.00%)#3,092 |
| 48. | Wyandotte | 41 | 19,112(0.21%)#48 | 1,985,710(0.00%)#3,195 |
| 49. | Lambertville | 41 | 19,112(0.21%)#49 | 1,985,710(0.00%)#3,208 |
| 50. | Jackson | 38 | 19,112(0.20%)#50 | 1,985,710(0.00%)#3,324 |
| 51. | Whitmore Lake | 38 | 19,112(0.20%)#51 | 1,985,710(0.00%)#3,353 |
| 52. | Wixom | 37 | 19,112(0.19%)#52 | 1,985,710(0.00%)#3,384 |
| 53. | Portage | 35 | 19,112(0.18%)#53 | 1,985,710(0.00%)#3,454 |
| 54. | Ludington | 35 | 19,112(0.18%)#54 | 1,985,710(0.00%)#3,487 |
| 55. | Ishpeming | 35 | 19,112(0.18%)#55 | 1,985,710(0.00%)#3,496 |
| 56. | Wolf Lake | 35 | 19,112(0.18%)#56 | 1,985,710(0.00%)#3,498 |
| 57. | Hazel Park | 33 | 19,112(0.17%)#57 | 1,985,710(0.00%)#3,569 |
| 58. | Trenton | 32 | 19,112(0.17%)#58 | 1,985,710(0.00%)#3,608 |
| 59. | Tecumseh | 32 | 19,112(0.17%)#59 | 1,985,710(0.00%)#3,629 |
| 60. | Fraser | 31 | 19,112(0.16%)#60 | 1,985,710(0.00%)#3,669 |
| 61. | Sault Ste Marie | 31 | 19,112(0.16%)#61 | 1,985,710(0.00%)#3,673 |
| 62. | Paw Paw | 31 | 19,112(0.16%)#62 | 1,985,710(0.00%)#3,703 |
| 63. | Mount Pleasant | 30 | 19,112(0.16%)#63 | 1,985,710(0.00%)#3,726 |
| 64. | South Lyon | 30 | 19,112(0.16%)#64 | 1,985,710(0.00%)#3,736 |
| 65. | Utica | 29 | 19,112(0.15%)#65 | 1,985,710(0.00%)#3,821 |
| 66. | Haslett | 28 | 19,112(0.15%)#66 | 1,985,710(0.00%)#3,850 |
| 67. | Gibraltar | 26 | 19,112(0.14%)#67 | 1,985,710(0.00%)#4,010 |
| 68. | Otsego | 26 | 19,112(0.14%)#68 | 1,985,710(0.00%)#4,016 |
| 69. | Mason | 25 | 19,112(0.13%)#69 | 1,985,710(0.00%)#4,059 |
| 70. | Flint | 24 | 19,112(0.13%)#70 | 1,985,710(0.00%)#4,094 |
| 71. | Hamtramck | 24 | 19,112(0.13%)#71 | 1,985,710(0.00%)#4,098 |
| 72. | Hillsdale | 23 | 19,112(0.12%)#72 | 1,985,710(0.00%)#4,183 |
| 73. | Mattawan | 23 | 19,112(0.12%)#73 | 1,985,710(0.00%)#4,203 |
| 74. | Baroda | 23 | 19,112(0.12%)#74 | 1,985,710(0.00%)#4,215 |
| 75. | Dearborn Heights | 22 | 19,112(0.12%)#75 | 1,985,710(0.00%)#4,217 |
| 76. | Melvindale | 22 | 19,112(0.12%)#76 | 1,985,710(0.00%)#4,236 |
| 77. | Plymouth | 21 | 19,112(0.11%)#77 | 1,985,710(0.00%)#4,324 |
| 78. | Mackinaw City | 21 | 19,112(0.11%)#78 | 1,985,710(0.00%)#4,365 |
| 79. | Fair Plain | 20 | 19,112(0.10%)#79 | 1,985,710(0.00%)#4,404 |
| 80. | Keego Harbor | 20 | 19,112(0.10%)#80 | 1,985,710(0.00%)#4,426 |
| 81. | Saginaw | 19 | 19,112(0.10%)#81 | 1,985,710(0.00%)#4,445 |
| 82. | Iron Mountain | 19 | 19,112(0.10%)#82 | 1,985,710(0.00%)#4,480 |
| 83. | Mount Clemens | 18 | 19,112(0.09%)#83 | 1,985,710(0.00%)#4,551 |
| 84. | East Tawas | 18 | 19,112(0.09%)#84 | 1,985,710(0.00%)#4,585 |
| 85. | Escanaba | 17 | 19,112(0.09%)#85 | 1,985,710(0.00%)#4,631 |
| 86. | Stockbridge | 17 | 19,112(0.09%)#86 | 1,985,710(0.00%)#4,694 |
| 87. | Eastpointe | 16 | 19,112(0.08%)#87 | 1,985,710(0.00%)#4,708 |
| 88. | Harper Woods | 16 | 19,112(0.08%)#88 | 1,985,710(0.00%)#4,721 |
| 89. | Riverview | 16 | 19,112(0.08%)#89 | 1,985,710(0.00%)#4,730 |
| 90. | Howell | 15 | 19,112(0.08%)#90 | 1,985,710(0.00%)#4,837 |
| 91. | Three Rivers | 15 | 19,112(0.08%)#91 | 1,985,710(0.00%)#4,843 |
| 92. | Harvey | 15 | 19,112(0.08%)#92 | 1,985,710(0.00%)#4,871 |
| 93. | Birmingham | 14 | 19,112(0.07%)#93 | 1,985,710(0.00%)#4,913 |
| 94. | Marshall | 14 | 19,112(0.07%)#94 | 1,985,710(0.00%)#4,950 |
| 95. | Gwinn | 14 | 19,112(0.07%)#95 | 1,985,710(0.00%)#5,016 |
| 96. | Grosse Pointe Woods | 13 | 19,112(0.07%)#96 | 1,985,710(0.00%)#5,050 |
| 97. | Big Rapids | 13 | 19,112(0.07%)#97 | 1,985,710(0.00%)#5,075 |
| 98. | Yale | 13 | 19,112(0.07%)#98 | 1,985,710(0.00%)#5,130 |
| 99. | Ypsilanti | 12 | 19,112(0.06%)#99 | 1,985,710(0.00%)#5,172 |
| 100. | Traverse City | 12 | 19,112(0.06%)#100 | 1,985,710(0.00%)#5,180 |
Common Questions
What are the Top 10 Cities with the Most Immigrants from Philippines in Michigan?
Top 10 Cities with the Most Immigrants from Philippines in Michigan are:
#1
1,499
#2
927
#3
753
#4
602
#5
542
#6
539
#7
411
#8
337
#9
303
#10
294
What city has the Most Immigrants from Philippines in Michigan?
Sterling Heights has the Most Immigrants from Philippines in Michigan with 1,499.
What is the Total Immigrants from Philippines in the State of Michigan?
Total Immigrants from Philippines in Michigan is 19,112.
What is the Total Immigrants from Philippines in the United States?
Total Immigrants from Philippines in the United States is 1,985,710.