Cities with the Highest Percentage of Immigrants from Mexico in Michigan
RELATED REPORTS & OPTIONS
Mexico
Michigan
Compare Cities
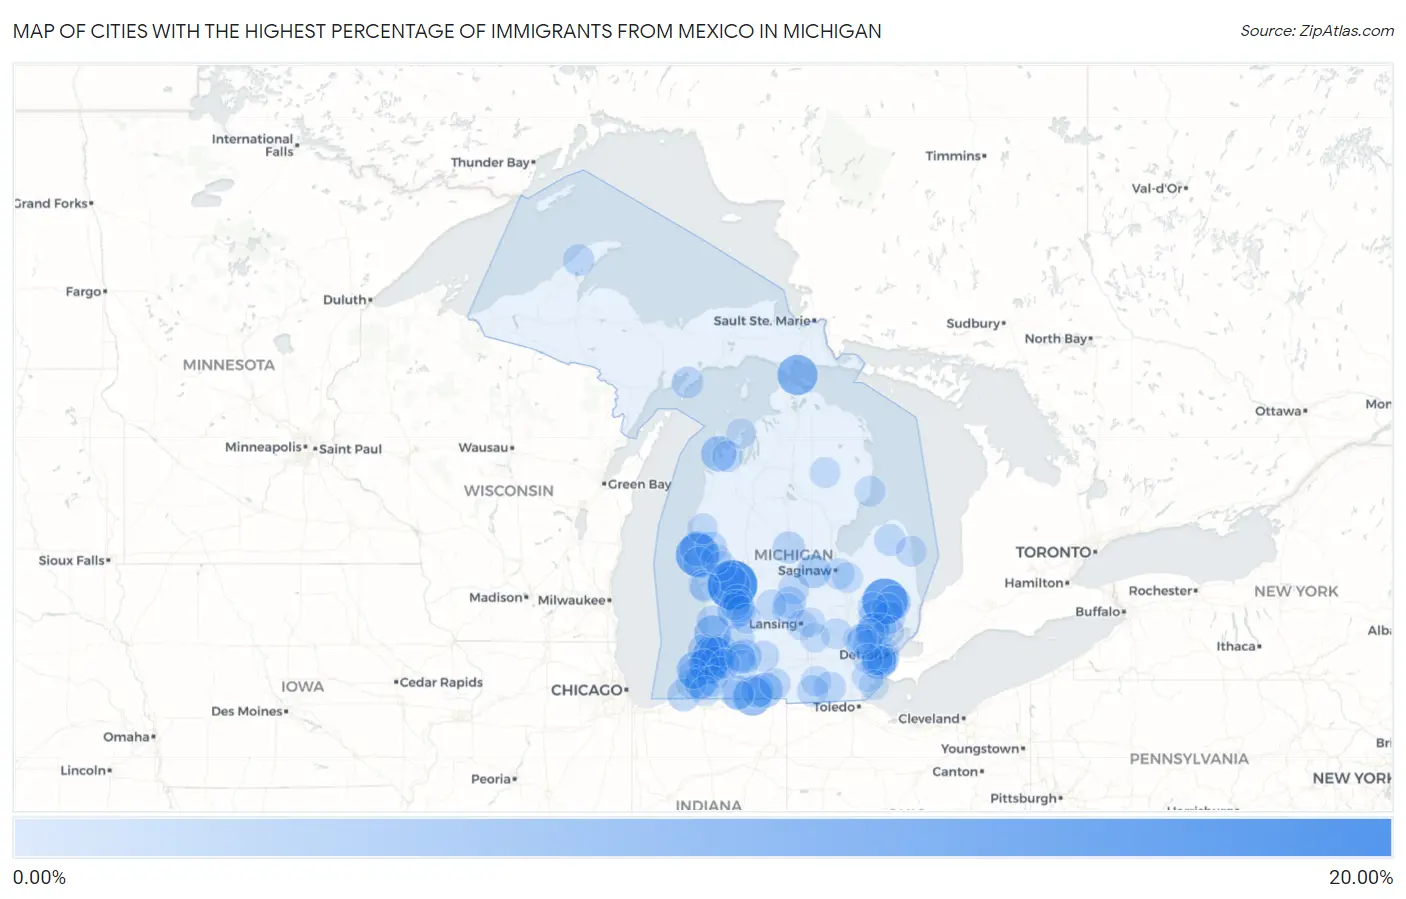
Map of Cities with the Highest Percentage of Immigrants from Mexico in Michigan
0.00%
20.00%
Cities with the Highest Percentage of Immigrants from Mexico in Michigan
| City | Mexico | vs State | vs National | |
| 1. | Kent City | 19.80% | 0.76%(+19.0)#-1 | 3.25%(+16.5)#0 |
| 2. | Imlay City | 15.60% | 0.76%(+14.8)#0 | 3.25%(+12.4)#1 |
| 3. | Shelby | 13.61% | 0.76%(+12.9)#1 | 3.25%(+10.4)#2 |
| 4. | Bangor | 10.69% | 0.76%(+9.93)#2 | 3.25%(+7.43)#3 |
| 5. | Mackinac Island | 10.41% | 0.76%(+9.65)#3 | 3.25%(+7.15)#4 |
| 6. | Sturgis | 8.97% | 0.76%(+8.21)#4 | 3.25%(+5.72)#5 |
| 7. | Casnovia | 8.03% | 0.76%(+7.28)#5 | 3.25%(+4.78)#6 |
| 8. | Hartford | 7.99% | 0.76%(+7.24)#6 | 3.25%(+4.74)#7 |
| 9. | Benton Heights | 7.10% | 0.76%(+6.34)#7 | 3.25%(+3.84)#8 |
| 10. | Fennville | 7.09% | 0.76%(+6.33)#8 | 3.25%(+3.84)#9 |
| 11. | Lincoln Park | 6.40% | 0.76%(+5.64)#9 | 3.25%(+3.14)#10 |
| 12. | Glen Arbor | 5.90% | 0.76%(+5.15)#10 | 3.25%(+2.65)#11 |
| 13. | Bronson | 5.72% | 0.76%(+4.97)#11 | 3.25%(+2.47)#12 |
| 14. | Hart | 5.61% | 0.76%(+4.86)#12 | 3.25%(+2.36)#13 |
| 15. | Wyoming | 5.18% | 0.76%(+4.42)#13 | 3.25%(+1.93)#14 |
| 16. | Palo | 5.16% | 0.76%(+4.40)#14 | 3.25%(+1.91)#15 |
| 17. | Eau Claire | 4.80% | 0.76%(+4.05)#15 | 3.25%(+1.55)#16 |
| 18. | Capac | 4.74% | 0.76%(+3.98)#16 | 3.25%(+1.49)#17 |
| 19. | Breedsville | 4.67% | 0.76%(+3.91)#17 | 3.25%(+1.41)#18 |
| 20. | Merrill | 4.45% | 0.76%(+3.70)#18 | 3.25%(+1.20)#19 |
| 21. | Melvindale | 4.38% | 0.76%(+3.62)#19 | 3.25%(+1.12)#20 |
| 22. | Mears | 4.35% | 0.76%(+3.59)#20 | 3.25%(+1.10)#21 |
| 23. | Constantine | 4.34% | 0.76%(+3.58)#21 | 3.25%(+1.08)#22 |
| 24. | Lawrence | 4.17% | 0.76%(+3.42)#22 | 3.25%(+0.919)#23 |
| 25. | Eastwood | 4.08% | 0.76%(+3.32)#23 | 3.25%(+0.827)#24 |
| 26. | River Rouge | 3.75% | 0.76%(+2.99)#24 | 3.25%(+0.498)#25 |
| 27. | Burr Oak | 3.54% | 0.76%(+2.78)#25 | 3.25%(+0.285)#26 |
| 28. | Oxford | 3.41% | 0.76%(+2.66)#26 | 3.25%(+0.161)#27 |
| 29. | Three Oaks | 3.31% | 0.76%(+2.56)#27 | 3.25%(+0.062)#28 |
| 30. | Pontiac | 3.31% | 0.76%(+2.55)#28 | 3.25%(+0.058)#29 |
| 31. | Romeo | 3.14% | 0.76%(+2.38)#29 | 3.25%(-0.113)#30 |
| 32. | Grand Rapids | 3.08% | 0.76%(+2.32)#30 | 3.25%(-0.177)#31 |
| 33. | Rosebush | 2.96% | 0.76%(+2.20)#31 | 3.25%(-0.296)#32 |
| 34. | Bloomingdale | 2.92% | 0.76%(+2.17)#32 | 3.25%(-0.328)#33 |
| 35. | Fowler | 2.84% | 0.76%(+2.08)#33 | 3.25%(-0.412)#34 |
| 36. | Auburn Hills | 2.61% | 0.76%(+1.86)#34 | 3.25%(-0.637)#35 |
| 37. | South Haven | 2.53% | 0.76%(+1.77)#35 | 3.25%(-0.726)#36 |
| 38. | Garden | 2.37% | 0.76%(+1.61)#36 | 3.25%(-0.885)#37 |
| 39. | Walkerville | 2.36% | 0.76%(+1.60)#37 | 3.25%(-0.893)#38 |
| 40. | Adrian | 2.33% | 0.76%(+1.57)#38 | 3.25%(-0.923)#39 |
| 41. | Bad Axe | 2.28% | 0.76%(+1.53)#39 | 3.25%(-0.971)#40 |
| 42. | Holland | 2.28% | 0.76%(+1.52)#40 | 3.25%(-0.976)#41 |
| 43. | Martin | 2.26% | 0.76%(+1.51)#41 | 3.25%(-0.988)#42 |
| 44. | Rothbury | 2.25% | 0.76%(+1.50)#42 | 3.25%(-0.998)#43 |
| 45. | Hudson | 2.14% | 0.76%(+1.38)#43 | 3.25%(-1.11)#44 |
| 46. | Perrinton | 2.13% | 0.76%(+1.37)#44 | 3.25%(-1.12)#45 |
| 47. | Watervliet | 2.12% | 0.76%(+1.37)#45 | 3.25%(-1.13)#46 |
| 48. | Calumet | 2.09% | 0.76%(+1.33)#46 | 3.25%(-1.17)#47 |
| 49. | Coldwater | 1.93% | 0.76%(+1.18)#47 | 3.25%(-1.32)#48 |
| 50. | Berrien Springs | 1.83% | 0.76%(+1.07)#48 | 3.25%(-1.42)#49 |
| 51. | Maple City | 1.83% | 0.76%(+1.07)#49 | 3.25%(-1.42)#50 |
| 52. | Battle Creek | 1.80% | 0.76%(+1.04)#50 | 3.25%(-1.45)#51 |
| 53. | Westphalia | 1.79% | 0.76%(+1.03)#51 | 3.25%(-1.47)#52 |
| 54. | Decatur | 1.75% | 0.76%(+0.994)#52 | 3.25%(-1.50)#53 |
| 55. | Almont | 1.73% | 0.76%(+0.979)#53 | 3.25%(-1.52)#54 |
| 56. | Carleton | 1.73% | 0.76%(+0.977)#54 | 3.25%(-1.52)#55 |
| 57. | Detroit | 1.73% | 0.76%(+0.976)#55 | 3.25%(-1.52)#214 |
| 58. | Utica | 1.71% | 0.76%(+0.958)#56 | 3.25%(-1.54)#215 |
| 59. | Bridgeport | 1.71% | 0.76%(+0.954)#57 | 3.25%(-1.54)#216 |
| 60. | Ionia | 1.67% | 0.76%(+0.911)#58 | 3.25%(-1.59)#217 |
| 61. | Scottville | 1.59% | 0.76%(+0.832)#59 | 3.25%(-1.66)#218 |
| 62. | Wixom | 1.58% | 0.76%(+0.826)#60 | 3.25%(-1.67)#219 |
| 63. | Grant | 1.56% | 0.76%(+0.804)#61 | 3.25%(-1.69)#220 |
| 64. | Howell | 1.54% | 0.76%(+0.784)#62 | 3.25%(-1.71)#221 |
| 65. | Forestville | 1.52% | 0.76%(+0.760)#63 | 3.25%(-1.74)#222 |
| 66. | Muskegon | 1.51% | 0.76%(+0.754)#64 | 3.25%(-1.74)#223 |
| 67. | Frankenmuth | 1.48% | 0.76%(+0.726)#65 | 3.25%(-1.77)#224 |
| 68. | Mio | 1.47% | 0.76%(+0.717)#66 | 3.25%(-1.78)#225 |
| 69. | Baroda | 1.45% | 0.76%(+0.696)#67 | 3.25%(-1.80)#226 |
| 70. | Comstock Park | 1.44% | 0.76%(+0.680)#68 | 3.25%(-1.82)#227 |
| 71. | Ecorse | 1.43% | 0.76%(+0.676)#69 | 3.25%(-1.82)#228 |
| 72. | Oscoda | 1.42% | 0.76%(+0.661)#70 | 3.25%(-1.84)#229 |
| 73. | Manitou Beach Devils Lake | 1.38% | 0.76%(+0.628)#71 | 3.25%(-1.87)#230 |
| 74. | Novi | 1.35% | 0.76%(+0.593)#72 | 3.25%(-1.90)#231 |
| 75. | Dowagiac | 1.34% | 0.76%(+0.583)#73 | 3.25%(-1.91)#232 |
| 76. | Kentwood | 1.28% | 0.76%(+0.527)#74 | 3.25%(-1.97)#233 |
| 77. | Fair Plain | 1.25% | 0.76%(+0.494)#75 | 3.25%(-2.00)#234 |
| 78. | Rochester Hills | 1.19% | 0.76%(+0.434)#76 | 3.25%(-2.06)#235 |
| 79. | Westwood | 1.17% | 0.76%(+0.420)#77 | 3.25%(-2.08)#236 |
| 80. | Metamora | 1.13% | 0.76%(+0.376)#78 | 3.25%(-2.12)#237 |
| 81. | Portage | 1.11% | 0.76%(+0.354)#79 | 3.25%(-2.14)#238 |
| 82. | Allen Park | 1.11% | 0.76%(+0.354)#80 | 3.25%(-2.14)#239 |
| 83. | Lansing | 1.11% | 0.76%(+0.354)#81 | 3.25%(-2.14)#240 |
| 84. | White Pigeon | 1.10% | 0.76%(+0.346)#82 | 3.25%(-2.15)#241 |
| 85. | Walker | 1.08% | 0.76%(+0.321)#83 | 3.25%(-2.18)#242 |
| 86. | Fremont | 1.06% | 0.76%(+0.309)#84 | 3.25%(-2.19)#243 |
| 87. | Hesperia | 1.06% | 0.76%(+0.307)#85 | 3.25%(-2.19)#244 |
| 88. | Kalamazoo | 1.03% | 0.76%(+0.278)#86 | 3.25%(-2.22)#245 |
| 89. | Muskegon Heights | 1.01% | 0.76%(+0.259)#87 | 3.25%(-2.24)#246 |
| 90. | Keego Harbor | 0.97% | 0.76%(+0.219)#88 | 3.25%(-2.28)#247 |
| 91. | Farmington | 0.95% | 0.76%(+0.194)#89 | 3.25%(-2.30)#248 |
| 92. | Dansville | 0.94% | 0.76%(+0.188)#90 | 3.25%(-2.31)#249 |
| 93. | Caledonia | 0.94% | 0.76%(+0.185)#91 | 3.25%(-2.31)#250 |
| 94. | Northport | 0.94% | 0.76%(+0.181)#92 | 3.25%(-2.32)#251 |
| 95. | Walled Lake | 0.94% | 0.76%(+0.181)#93 | 3.25%(-2.32)#252 |
| 96. | Paw Paw | 0.93% | 0.76%(+0.179)#94 | 3.25%(-2.32)#253 |
| 97. | Niles | 0.93% | 0.76%(+0.171)#95 | 3.25%(-2.33)#254 |
| 98. | Stony Point | 0.91% | 0.76%(+0.151)#96 | 3.25%(-2.35)#255 |
| 99. | Haslett | 0.91% | 0.76%(+0.151)#97 | 3.25%(-2.35)#256 |
| 100. | Wayne | 0.90% | 0.76%(+0.144)#98 | 3.25%(-2.35)#257 |
Common Questions
What are the Top 10 Cities with the Highest Percentage of Immigrants from Mexico in Michigan?
Top 10 Cities with the Highest Percentage of Immigrants from Mexico in Michigan are:
#1
19.80%
#2
15.60%
#3
13.61%
#4
10.69%
#5
10.41%
#6
8.97%
#7
8.03%
#8
7.99%
#9
7.10%
#10
7.09%
What city has the Highest Percentage of Immigrants from Mexico in Michigan?
Kent City has the Highest Percentage of Immigrants from Mexico in Michigan with 19.80%.
What is the Percentage of Immigrants from Mexico in the State of Michigan?
Percentage of Immigrants from Mexico in Michigan is 0.76%.
What is the Percentage of Immigrants from Mexico in the United States?
Percentage of Immigrants from Mexico in the United States is 3.25%.