Cities with the Most Immigrants from Romania in Michigan
RELATED REPORTS & OPTIONS
Romania
Michigan
Compare Cities
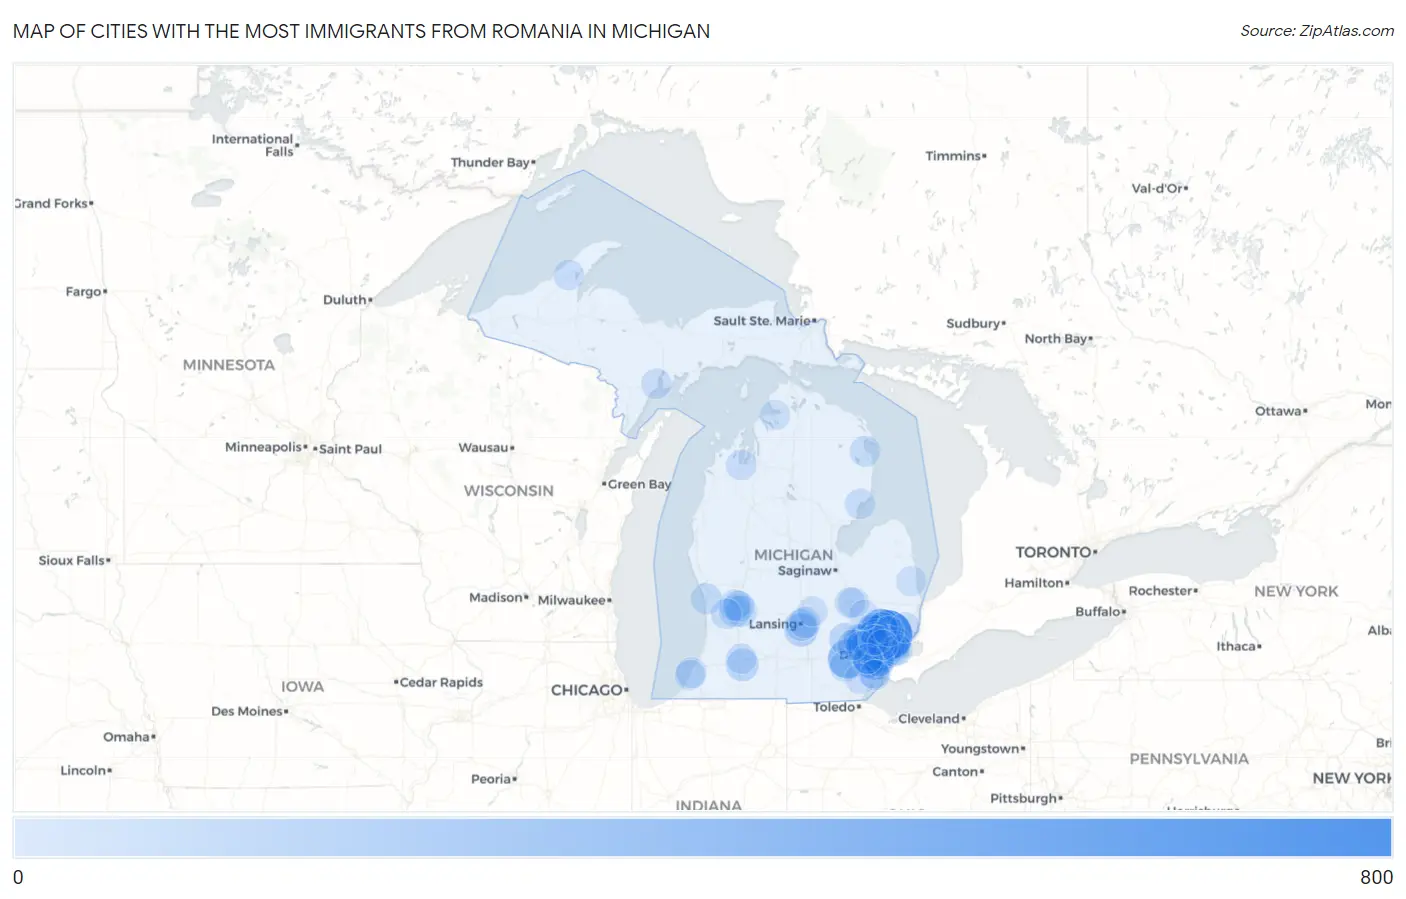
Map of Cities with the Most Immigrants from Romania in Michigan
0
800
Cities with the Most Immigrants from Romania in Michigan
| City | Romania | vs State | vs National | |
| 1. | Sterling Heights | 686 | 8,563(8.01%)#1 | 164,406(0.42%)#15 |
| 2. | Livonia | 350 | 8,563(4.09%)#2 | 164,406(0.21%)#44 |
| 3. | Troy | 350 | 8,563(4.09%)#3 | 164,406(0.21%)#45 |
| 4. | Rochester Hills | 339 | 8,563(3.96%)#4 | 164,406(0.21%)#51 |
| 5. | Farmington Hills | 321 | 8,563(3.75%)#5 | 164,406(0.20%)#56 |
| 6. | Ann Arbor | 306 | 8,563(3.57%)#6 | 164,406(0.19%)#62 |
| 7. | Dearborn Heights | 213 | 8,563(2.49%)#7 | 164,406(0.13%)#98 |
| 8. | Warren | 180 | 8,563(2.10%)#8 | 164,406(0.11%)#118 |
| 9. | Westland | 175 | 8,563(2.04%)#9 | 164,406(0.11%)#124 |
| 10. | Detroit | 154 | 8,563(1.80%)#10 | 164,406(0.09%)#143 |
| 11. | Taylor | 148 | 8,563(1.73%)#11 | 164,406(0.09%)#149 |
| 12. | Novi | 143 | 8,563(1.67%)#12 | 164,406(0.09%)#159 |
| 13. | Madison Heights | 136 | 8,563(1.59%)#13 | 164,406(0.08%)#174 |
| 14. | Holt | 108 | 8,563(1.26%)#14 | 164,406(0.07%)#231 |
| 15. | Portage | 76 | 8,563(0.89%)#15 | 164,406(0.05%)#350 |
| 16. | Dearborn | 73 | 8,563(0.85%)#16 | 164,406(0.04%)#359 |
| 17. | Lansing | 64 | 8,563(0.75%)#17 | 164,406(0.04%)#426 |
| 18. | St Clair Shores | 62 | 8,563(0.72%)#18 | 164,406(0.04%)#438 |
| 19. | Auburn Hills | 61 | 8,563(0.71%)#19 | 164,406(0.04%)#447 |
| 20. | Wixom | 58 | 8,563(0.68%)#20 | 164,406(0.04%)#467 |
| 21. | Southgate | 57 | 8,563(0.67%)#21 | 164,406(0.03%)#476 |
| 22. | Brighton | 55 | 8,563(0.64%)#22 | 164,406(0.03%)#494 |
| 23. | Wyoming | 52 | 8,563(0.61%)#23 | 164,406(0.03%)#516 |
| 24. | Bloomfield Hills | 49 | 8,563(0.57%)#24 | 164,406(0.03%)#560 |
| 25. | Allen Park | 43 | 8,563(0.50%)#25 | 164,406(0.03%)#634 |
| 26. | East Lansing | 42 | 8,563(0.49%)#26 | 164,406(0.03%)#645 |
| 27. | Kentwood | 41 | 8,563(0.48%)#27 | 164,406(0.02%)#660 |
| 28. | Farmington | 40 | 8,563(0.47%)#28 | 164,406(0.02%)#681 |
| 29. | Flat Rock | 39 | 8,563(0.46%)#29 | 164,406(0.02%)#709 |
| 30. | Garden City | 37 | 8,563(0.43%)#30 | 164,406(0.02%)#733 |
| 31. | Birmingham | 35 | 8,563(0.41%)#31 | 164,406(0.02%)#778 |
| 32. | Walker | 32 | 8,563(0.37%)#32 | 164,406(0.02%)#830 |
| 33. | Oak Park | 31 | 8,563(0.36%)#33 | 164,406(0.02%)#850 |
| 34. | Saline | 31 | 8,563(0.36%)#34 | 164,406(0.02%)#858 |
| 35. | Grand Rapids | 30 | 8,563(0.35%)#35 | 164,406(0.02%)#863 |
| 36. | Grand Haven | 30 | 8,563(0.35%)#36 | 164,406(0.02%)#879 |
| 37. | Southfield | 28 | 8,563(0.33%)#37 | 164,406(0.02%)#920 |
| 38. | Royal Oak | 25 | 8,563(0.29%)#38 | 164,406(0.02%)#1,007 |
| 39. | Ossineke | 25 | 8,563(0.29%)#39 | 164,406(0.02%)#1,027 |
| 40. | Romulus | 24 | 8,563(0.28%)#40 | 164,406(0.01%)#1,042 |
| 41. | South Lyon | 19 | 8,563(0.22%)#41 | 164,406(0.01%)#1,198 |
| 42. | Pontiac | 18 | 8,563(0.21%)#42 | 164,406(0.01%)#1,218 |
| 43. | Lincoln Park | 18 | 8,563(0.21%)#43 | 164,406(0.01%)#1,223 |
| 44. | Burton | 16 | 8,563(0.19%)#44 | 164,406(0.01%)#1,325 |
| 45. | Northville | 16 | 8,563(0.19%)#45 | 164,406(0.01%)#1,352 |
| 46. | Traverse City | 15 | 8,563(0.18%)#46 | 164,406(0.01%)#1,390 |
| 47. | Hudsonville | 15 | 8,563(0.18%)#47 | 164,406(0.01%)#1,398 |
| 48. | Grosse Pointe Woods | 14 | 8,563(0.16%)#48 | 164,406(0.01%)#1,429 |
| 49. | Grosse Pointe Park | 14 | 8,563(0.16%)#49 | 164,406(0.01%)#1,431 |
| 50. | Escanaba | 13 | 8,563(0.15%)#50 | 164,406(0.01%)#1,471 |
| 51. | St Joseph | 13 | 8,563(0.15%)#51 | 164,406(0.01%)#1,477 |
| 52. | Grosse Pointe Farms | 12 | 8,563(0.14%)#52 | 164,406(0.01%)#1,518 |
| 53. | South Range | 12 | 8,563(0.14%)#53 | 164,406(0.01%)#1,540 |
| 54. | New Baltimore | 11 | 8,563(0.13%)#54 | 164,406(0.01%)#1,579 |
| 55. | Kalamazoo | 10 | 8,563(0.12%)#55 | 164,406(0.01%)#1,616 |
| 56. | Flint | 9 | 8,563(0.11%)#56 | 164,406(0.01%)#1,685 |
| 57. | Beverly Hills | 9 | 8,563(0.11%)#57 | 164,406(0.01%)#1,716 |
| 58. | Rochester | 8 | 8,563(0.09%)#58 | 164,406(0.00%)#1,778 |
| 59. | Utica | 8 | 8,563(0.09%)#59 | 164,406(0.00%)#1,795 |
| 60. | Bingham Farms | 8 | 8,563(0.09%)#60 | 164,406(0.00%)#1,812 |
| 61. | Ferndale | 7 | 8,563(0.08%)#61 | 164,406(0.00%)#1,843 |
| 62. | Tawas City | 7 | 8,563(0.08%)#62 | 164,406(0.00%)#1,867 |
| 63. | Maybee | 6 | 8,563(0.07%)#63 | 164,406(0.00%)#1,937 |
| 64. | Croswell | 5 | 8,563(0.06%)#64 | 164,406(0.00%)#1,973 |
| 65. | South Rockwood | 5 | 8,563(0.06%)#65 | 164,406(0.00%)#1,977 |
| 66. | Shoreham | 5 | 8,563(0.06%)#66 | 164,406(0.00%)#1,985 |
| 67. | Ortonville | 3 | 8,563(0.04%)#67 | 164,406(0.00%)#2,050 |
| 68. | Wayne | 2 | 8,563(0.02%)#68 | 164,406(0.00%)#2,070 |
| 69. | Petoskey | 2 | 8,563(0.02%)#69 | 164,406(0.00%)#2,079 |
| 70. | Laingsburg | 2 | 8,563(0.02%)#70 | 164,406(0.00%)#2,087 |
Common Questions
What are the Top 10 Cities with the Most Immigrants from Romania in Michigan?
Top 10 Cities with the Most Immigrants from Romania in Michigan are:
#1
686
#2
350
#3
350
#4
339
#5
321
#6
306
#7
213
#8
180
#9
175
#10
154
What city has the Most Immigrants from Romania in Michigan?
Sterling Heights has the Most Immigrants from Romania in Michigan with 686.
What is the Total Immigrants from Romania in the State of Michigan?
Total Immigrants from Romania in Michigan is 8,563.
What is the Total Immigrants from Romania in the United States?
Total Immigrants from Romania in the United States is 164,406.