Cities with the Most Immigrants from South America in Michigan
RELATED REPORTS & OPTIONS
South America
Michigan
Compare Cities
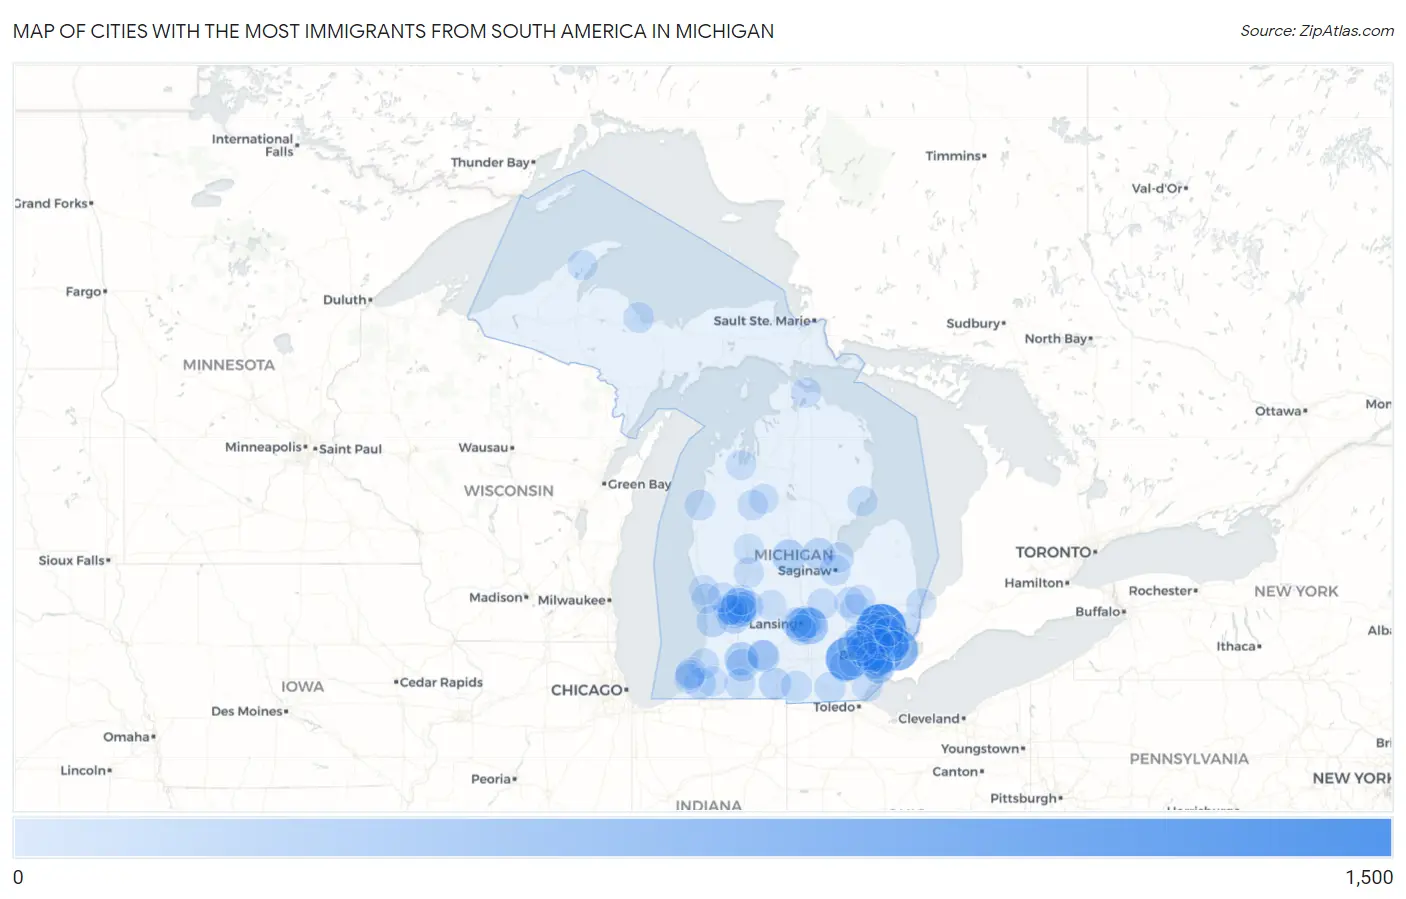
Map of Cities with the Most Immigrants from South America in Michigan
0
1,500
Cities with the Most Immigrants from South America in Michigan
| City | South America | vs State | vs National | |
| 1. | Rochester Hills | 1,070 | 18,937(5.65%)#1 | 3,636,375(0.03%)#450 |
| 2. | Ann Arbor | 734 | 18,937(3.88%)#2 | 3,636,375(0.02%)#659 |
| 3. | Grosse Pointe Farms | 603 | 18,937(3.18%)#3 | 3,636,375(0.02%)#789 |
| 4. | Detroit | 542 | 18,937(2.86%)#4 | 3,636,375(0.01%)#841 |
| 5. | Grand Rapids | 349 | 18,937(1.84%)#5 | 3,636,375(0.01%)#1,200 |
| 6. | Okemos | 325 | 18,937(1.72%)#6 | 3,636,375(0.01%)#1,281 |
| 7. | Auburn Hills | 315 | 18,937(1.66%)#7 | 3,636,375(0.01%)#1,302 |
| 8. | Royal Oak | 301 | 18,937(1.59%)#8 | 3,636,375(0.01%)#1,338 |
| 9. | Troy | 294 | 18,937(1.55%)#9 | 3,636,375(0.01%)#1,356 |
| 10. | Birmingham | 290 | 18,937(1.53%)#10 | 3,636,375(0.01%)#1,373 |
| 11. | Livonia | 232 | 18,937(1.23%)#11 | 3,636,375(0.01%)#1,608 |
| 12. | Roseville | 228 | 18,937(1.20%)#12 | 3,636,375(0.01%)#1,624 |
| 13. | Sterling Heights | 221 | 18,937(1.17%)#13 | 3,636,375(0.01%)#1,661 |
| 14. | Wyoming | 219 | 18,937(1.16%)#14 | 3,636,375(0.01%)#1,673 |
| 15. | Lansing | 208 | 18,937(1.10%)#15 | 3,636,375(0.01%)#1,726 |
| 16. | Westland | 203 | 18,937(1.07%)#16 | 3,636,375(0.01%)#1,748 |
| 17. | Mount Pleasant | 189 | 18,937(1.00%)#17 | 3,636,375(0.01%)#1,826 |
| 18. | Kalamazoo | 179 | 18,937(0.95%)#18 | 3,636,375(0.00%)#1,876 |
| 19. | Farmington Hills | 167 | 18,937(0.88%)#19 | 3,636,375(0.00%)#1,962 |
| 20. | East Lansing | 161 | 18,937(0.85%)#20 | 3,636,375(0.00%)#2,006 |
| 21. | Byron Center | 147 | 18,937(0.78%)#21 | 3,636,375(0.00%)#2,103 |
| 22. | Portage | 145 | 18,937(0.77%)#22 | 3,636,375(0.00%)#2,113 |
| 23. | Novi | 135 | 18,937(0.71%)#23 | 3,636,375(0.00%)#2,214 |
| 24. | St Clair Shores | 133 | 18,937(0.70%)#24 | 3,636,375(0.00%)#2,234 |
| 25. | Holland | 116 | 18,937(0.61%)#25 | 3,636,375(0.00%)#2,419 |
| 26. | Taylor | 113 | 18,937(0.60%)#26 | 3,636,375(0.00%)#2,442 |
| 27. | Battle Creek | 113 | 18,937(0.60%)#27 | 3,636,375(0.00%)#2,444 |
| 28. | Coldwater | 111 | 18,937(0.59%)#28 | 3,636,375(0.00%)#2,484 |
| 29. | Midland | 110 | 18,937(0.58%)#29 | 3,636,375(0.00%)#2,496 |
| 30. | Rochester | 110 | 18,937(0.58%)#30 | 3,636,375(0.00%)#2,499 |
| 31. | Saline | 106 | 18,937(0.56%)#31 | 3,636,375(0.00%)#2,554 |
| 32. | Southfield | 92 | 18,937(0.49%)#32 | 3,636,375(0.00%)#2,731 |
| 33. | Forest Hills | 91 | 18,937(0.48%)#33 | 3,636,375(0.00%)#2,752 |
| 34. | East Grand Rapids | 90 | 18,937(0.48%)#34 | 3,636,375(0.00%)#2,773 |
| 35. | Wolverine Lake | 83 | 18,937(0.44%)#35 | 3,636,375(0.00%)#2,893 |
| 36. | Berrien Springs | 83 | 18,937(0.44%)#36 | 3,636,375(0.00%)#2,898 |
| 37. | Hillsdale | 76 | 18,937(0.40%)#37 | 3,636,375(0.00%)#2,994 |
| 38. | Kentwood | 69 | 18,937(0.36%)#38 | 3,636,375(0.00%)#3,146 |
| 39. | Saginaw | 69 | 18,937(0.36%)#39 | 3,636,375(0.00%)#3,149 |
| 40. | Haslett | 69 | 18,937(0.36%)#40 | 3,636,375(0.00%)#3,158 |
| 41. | Allen Park | 68 | 18,937(0.36%)#41 | 3,636,375(0.00%)#3,183 |
| 42. | Dearborn | 64 | 18,937(0.34%)#42 | 3,636,375(0.00%)#3,278 |
| 43. | Adrian | 63 | 18,937(0.33%)#43 | 3,636,375(0.00%)#3,307 |
| 44. | Ferndale | 58 | 18,937(0.31%)#44 | 3,636,375(0.00%)#3,439 |
| 45. | Flint | 57 | 18,937(0.30%)#45 | 3,636,375(0.00%)#3,461 |
| 46. | Warren | 54 | 18,937(0.29%)#46 | 3,636,375(0.00%)#3,544 |
| 47. | Dearborn Heights | 54 | 18,937(0.29%)#47 | 3,636,375(0.00%)#3,545 |
| 48. | Waverly | 54 | 18,937(0.29%)#48 | 3,636,375(0.00%)#3,552 |
| 49. | Pontiac | 51 | 18,937(0.27%)#49 | 3,636,375(0.00%)#3,650 |
| 50. | Pleasant Ridge | 51 | 18,937(0.27%)#50 | 3,636,375(0.00%)#3,681 |
| 51. | Paw Paw Lake | 50 | 18,937(0.26%)#51 | 3,636,375(0.00%)#3,713 |
| 52. | Riverview | 48 | 18,937(0.25%)#52 | 3,636,375(0.00%)#3,770 |
| 53. | Three Rivers | 48 | 18,937(0.25%)#53 | 3,636,375(0.00%)#3,774 |
| 54. | Holt | 47 | 18,937(0.25%)#54 | 3,636,375(0.00%)#3,789 |
| 55. | Marquette | 47 | 18,937(0.25%)#55 | 3,636,375(0.00%)#3,793 |
| 56. | Garden City | 45 | 18,937(0.24%)#56 | 3,636,375(0.00%)#3,860 |
| 57. | Jenison | 40 | 18,937(0.21%)#57 | 3,636,375(0.00%)#4,054 |
| 58. | Grosse Pointe Woods | 40 | 18,937(0.21%)#58 | 3,636,375(0.00%)#4,055 |
| 59. | Grandville | 39 | 18,937(0.21%)#59 | 3,636,375(0.00%)#4,098 |
| 60. | Springfield | 39 | 18,937(0.21%)#60 | 3,636,375(0.00%)#4,113 |
| 61. | Lake Orion | 39 | 18,937(0.21%)#61 | 3,636,375(0.00%)#4,121 |
| 62. | Bay City | 36 | 18,937(0.19%)#62 | 3,636,375(0.00%)#4,226 |
| 63. | St Joseph | 36 | 18,937(0.19%)#63 | 3,636,375(0.00%)#4,242 |
| 64. | Lincoln Park | 35 | 18,937(0.18%)#64 | 3,636,375(0.00%)#4,269 |
| 65. | Southgate | 35 | 18,937(0.18%)#65 | 3,636,375(0.00%)#4,270 |
| 66. | Beverly Hills | 35 | 18,937(0.18%)#66 | 3,636,375(0.00%)#4,283 |
| 67. | Monroe | 34 | 18,937(0.18%)#67 | 3,636,375(0.00%)#4,322 |
| 68. | Northview | 34 | 18,937(0.18%)#68 | 3,636,375(0.00%)#4,327 |
| 69. | Owosso | 34 | 18,937(0.18%)#69 | 3,636,375(0.00%)#4,329 |
| 70. | New Baltimore | 34 | 18,937(0.18%)#70 | 3,636,375(0.00%)#4,333 |
| 71. | Manistee | 34 | 18,937(0.18%)#71 | 3,636,375(0.00%)#4,343 |
| 72. | Wixom | 33 | 18,937(0.17%)#72 | 3,636,375(0.00%)#4,369 |
| 73. | Port Huron | 32 | 18,937(0.17%)#73 | 3,636,375(0.00%)#4,417 |
| 74. | Cadillac | 32 | 18,937(0.17%)#74 | 3,636,375(0.00%)#4,435 |
| 75. | Berkley | 31 | 18,937(0.16%)#75 | 3,636,375(0.00%)#4,487 |
| 76. | Ypsilanti | 28 | 18,937(0.15%)#76 | 3,636,375(0.00%)#4,656 |
| 77. | Harper Woods | 28 | 18,937(0.15%)#77 | 3,636,375(0.00%)#4,663 |
| 78. | Trenton | 27 | 18,937(0.14%)#78 | 3,636,375(0.00%)#4,724 |
| 79. | Howard City | 27 | 18,937(0.14%)#79 | 3,636,375(0.00%)#4,778 |
| 80. | Ionia | 25 | 18,937(0.13%)#80 | 3,636,375(0.00%)#4,854 |
| 81. | Grand Blanc | 25 | 18,937(0.13%)#81 | 3,636,375(0.00%)#4,863 |
| 82. | Dowagiac | 25 | 18,937(0.13%)#82 | 3,636,375(0.00%)#4,873 |
| 83. | Davison | 25 | 18,937(0.13%)#83 | 3,636,375(0.00%)#4,878 |
| 84. | East Tawas | 25 | 18,937(0.13%)#84 | 3,636,375(0.00%)#4,889 |
| 85. | Traverse City | 24 | 18,937(0.13%)#85 | 3,636,375(0.00%)#4,925 |
| 86. | Big Rapids | 24 | 18,937(0.13%)#86 | 3,636,375(0.00%)#4,940 |
| 87. | Plymouth | 23 | 18,937(0.12%)#87 | 3,636,375(0.00%)#5,010 |
| 88. | Oak Park | 22 | 18,937(0.12%)#88 | 3,636,375(0.00%)#5,067 |
| 89. | Cheboygan | 22 | 18,937(0.12%)#89 | 3,636,375(0.00%)#5,099 |
| 90. | Lake Linden | 22 | 18,937(0.12%)#90 | 3,636,375(0.00%)#5,128 |
| 91. | Lake City | 22 | 18,937(0.12%)#91 | 3,636,375(0.00%)#5,137 |
| 92. | Coopersville | 21 | 18,937(0.11%)#92 | 3,636,375(0.00%)#5,175 |
| 93. | Norton Shores | 19 | 18,937(0.10%)#93 | 3,636,375(0.00%)#5,283 |
| 94. | Grand Haven | 19 | 18,937(0.10%)#94 | 3,636,375(0.00%)#5,301 |
| 95. | Stevensville | 19 | 18,937(0.10%)#95 | 3,636,375(0.00%)#5,348 |
| 96. | South Lyon | 18 | 18,937(0.10%)#96 | 3,636,375(0.00%)#5,382 |
| 97. | Northville | 18 | 18,937(0.10%)#97 | 3,636,375(0.00%)#5,403 |
| 98. | Utica | 18 | 18,937(0.10%)#98 | 3,636,375(0.00%)#5,406 |
| 99. | Shoreham | 18 | 18,937(0.10%)#99 | 3,636,375(0.00%)#5,446 |
| 100. | Inkster | 17 | 18,937(0.09%)#100 | 3,636,375(0.00%)#5,465 |
Common Questions
What are the Top 10 Cities with the Most Immigrants from South America in Michigan?
Top 10 Cities with the Most Immigrants from South America in Michigan are:
#1
1,070
#2
734
#3
603
#4
542
#5
349
#6
325
#7
315
#8
301
#9
294
#10
290
What city has the Most Immigrants from South America in Michigan?
Rochester Hills has the Most Immigrants from South America in Michigan with 1,070.
What is the Total Immigrants from South America in the State of Michigan?
Total Immigrants from South America in Michigan is 18,937.
What is the Total Immigrants from South America in the United States?
Total Immigrants from South America in the United States is 3,636,375.