Cities with the Most Immigrants from Honduras in Michigan
RELATED REPORTS & OPTIONS
Honduras
Michigan
Compare Cities
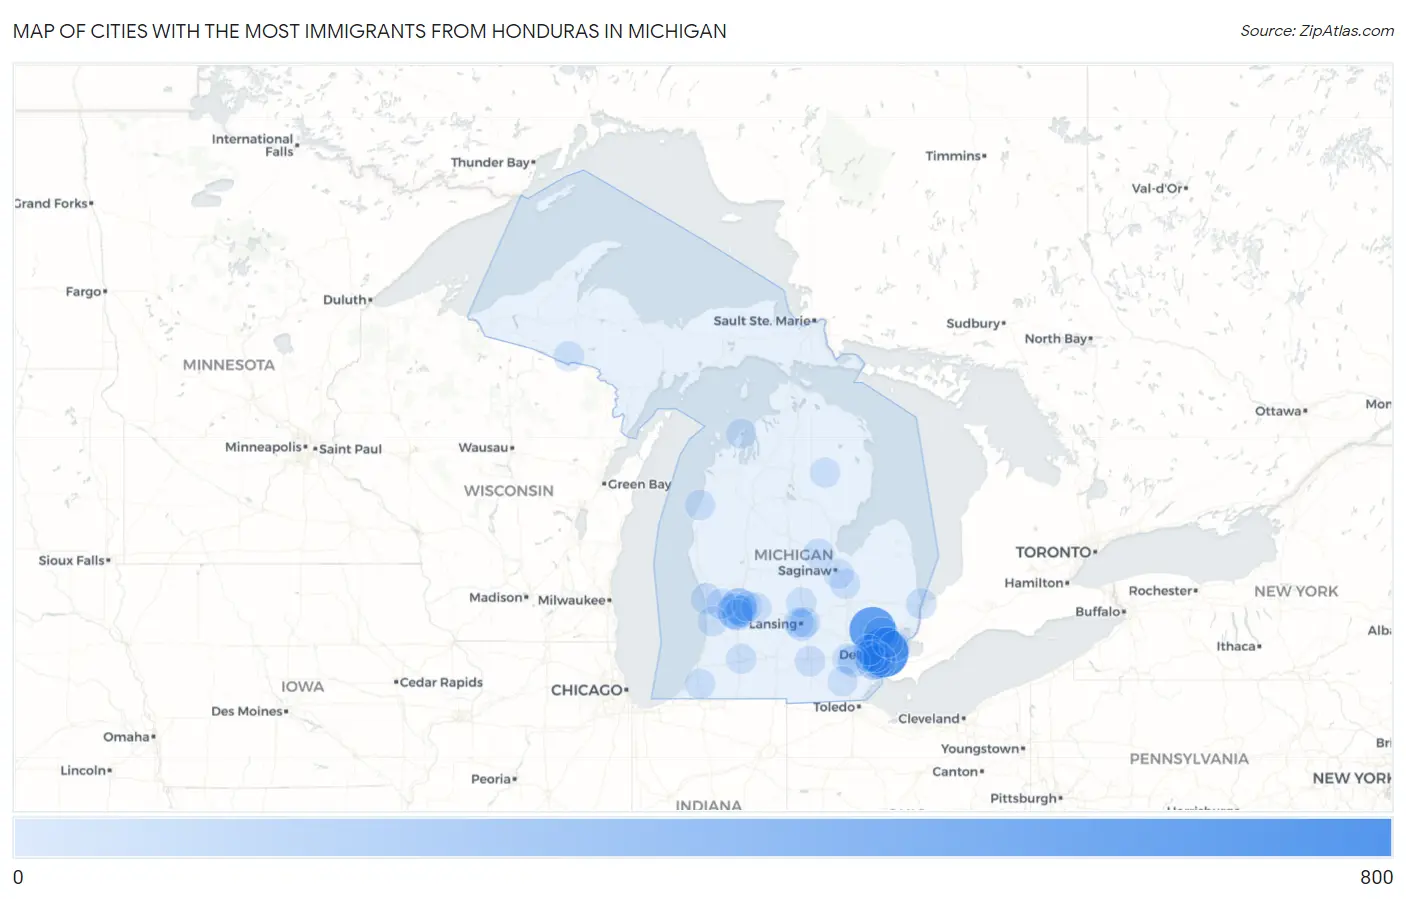
Map of Cities with the Most Immigrants from Honduras in Michigan
0
800
Cities with the Most Immigrants from Honduras in Michigan
| City | Honduras | vs State | vs National | |
| 1. | Detroit | 734 | 3,798(19.33%)#1 | 727,303(0.10%)#141 |
| 2. | Pontiac | 604 | 3,798(15.90%)#2 | 727,303(0.08%)#179 |
| 3. | Grand Rapids | 218 | 3,798(5.74%)#3 | 727,303(0.03%)#466 |
| 4. | Wyoming | 197 | 3,798(5.19%)#4 | 727,303(0.03%)#508 |
| 5. | Troy | 187 | 3,798(4.92%)#5 | 727,303(0.03%)#537 |
| 6. | Lincoln Park | 175 | 3,798(4.61%)#6 | 727,303(0.02%)#572 |
| 7. | Taylor | 162 | 3,798(4.27%)#7 | 727,303(0.02%)#615 |
| 8. | Melvindale | 94 | 3,798(2.47%)#8 | 727,303(0.01%)#921 |
| 9. | Dearborn Heights | 73 | 3,798(1.92%)#9 | 727,303(0.01%)#1,081 |
| 10. | Ypsilanti | 59 | 3,798(1.55%)#10 | 727,303(0.01%)#1,229 |
| 11. | Kentwood | 58 | 3,798(1.53%)#11 | 727,303(0.01%)#1,237 |
| 12. | Lansing | 52 | 3,798(1.37%)#12 | 727,303(0.01%)#1,339 |
| 13. | Westland | 48 | 3,798(1.26%)#13 | 727,303(0.01%)#1,388 |
| 14. | Cutlerville | 36 | 3,798(0.95%)#14 | 727,303(0.00%)#1,623 |
| 15. | Grand Haven | 25 | 3,798(0.66%)#15 | 727,303(0.00%)#1,895 |
| 16. | Livonia | 23 | 3,798(0.61%)#16 | 727,303(0.00%)#1,941 |
| 17. | Port Huron | 22 | 3,798(0.58%)#17 | 727,303(0.00%)#1,985 |
| 18. | Jackson | 15 | 3,798(0.39%)#18 | 727,303(0.00%)#2,263 |
| 19. | Grosse Pointe Woods | 15 | 3,798(0.39%)#19 | 727,303(0.00%)#2,271 |
| 20. | Midland | 14 | 3,798(0.37%)#20 | 727,303(0.00%)#2,302 |
| 21. | Allendale | 10 | 3,798(0.26%)#21 | 727,303(0.00%)#2,521 |
| 22. | Ann Arbor | 8 | 3,798(0.21%)#22 | 727,303(0.00%)#2,653 |
| 23. | East Lansing | 8 | 3,798(0.21%)#23 | 727,303(0.00%)#2,659 |
| 24. | Warren | 6 | 3,798(0.16%)#24 | 727,303(0.00%)#2,763 |
| 25. | Northport | 6 | 3,798(0.16%)#25 | 727,303(0.00%)#2,837 |
| 26. | Manistee | 5 | 3,798(0.13%)#26 | 727,303(0.00%)#2,864 |
| 27. | Kalamazoo | 4 | 3,798(0.11%)#27 | 727,303(0.00%)#2,906 |
| 28. | Lowell | 4 | 3,798(0.11%)#28 | 727,303(0.00%)#2,928 |
| 29. | Forest Hills | 3 | 3,798(0.08%)#29 | 727,303(0.00%)#2,974 |
| 30. | St Johns | 3 | 3,798(0.08%)#30 | 727,303(0.00%)#2,988 |
| 31. | Berrien Springs | 3 | 3,798(0.08%)#31 | 727,303(0.00%)#3,011 |
| 32. | Mio | 3 | 3,798(0.08%)#32 | 727,303(0.00%)#3,018 |
| 33. | Birch Run | 3 | 3,798(0.08%)#33 | 727,303(0.00%)#3,023 |
| 34. | Britton | 3 | 3,798(0.08%)#34 | 727,303(0.00%)#3,036 |
| 35. | Bridgeport | 2 | 3,798(0.05%)#35 | 727,303(0.00%)#3,064 |
| 36. | Edgemont Park | 2 | 3,798(0.05%)#36 | 727,303(0.00%)#3,071 |
| 37. | Holland | 1 | 3,798(0.03%)#37 | 727,303(0.00%)#3,115 |
| 38. | Iron River | 1 | 3,798(0.03%)#38 | 727,303(0.00%)#3,139 |
Common Questions
What are the Top 10 Cities with the Most Immigrants from Honduras in Michigan?
Top 10 Cities with the Most Immigrants from Honduras in Michigan are:
#1
734
#2
604
#3
218
#4
197
#5
187
#6
175
#7
162
#8
94
#9
73
#10
59
What city has the Most Immigrants from Honduras in Michigan?
Detroit has the Most Immigrants from Honduras in Michigan with 734.
What is the Total Immigrants from Honduras in the State of Michigan?
Total Immigrants from Honduras in Michigan is 3,798.
What is the Total Immigrants from Honduras in the United States?
Total Immigrants from Honduras in the United States is 727,303.