Cities with the Most Immigrants from Pakistan in Michigan
RELATED REPORTS & OPTIONS
Pakistan
Michigan
Compare Cities
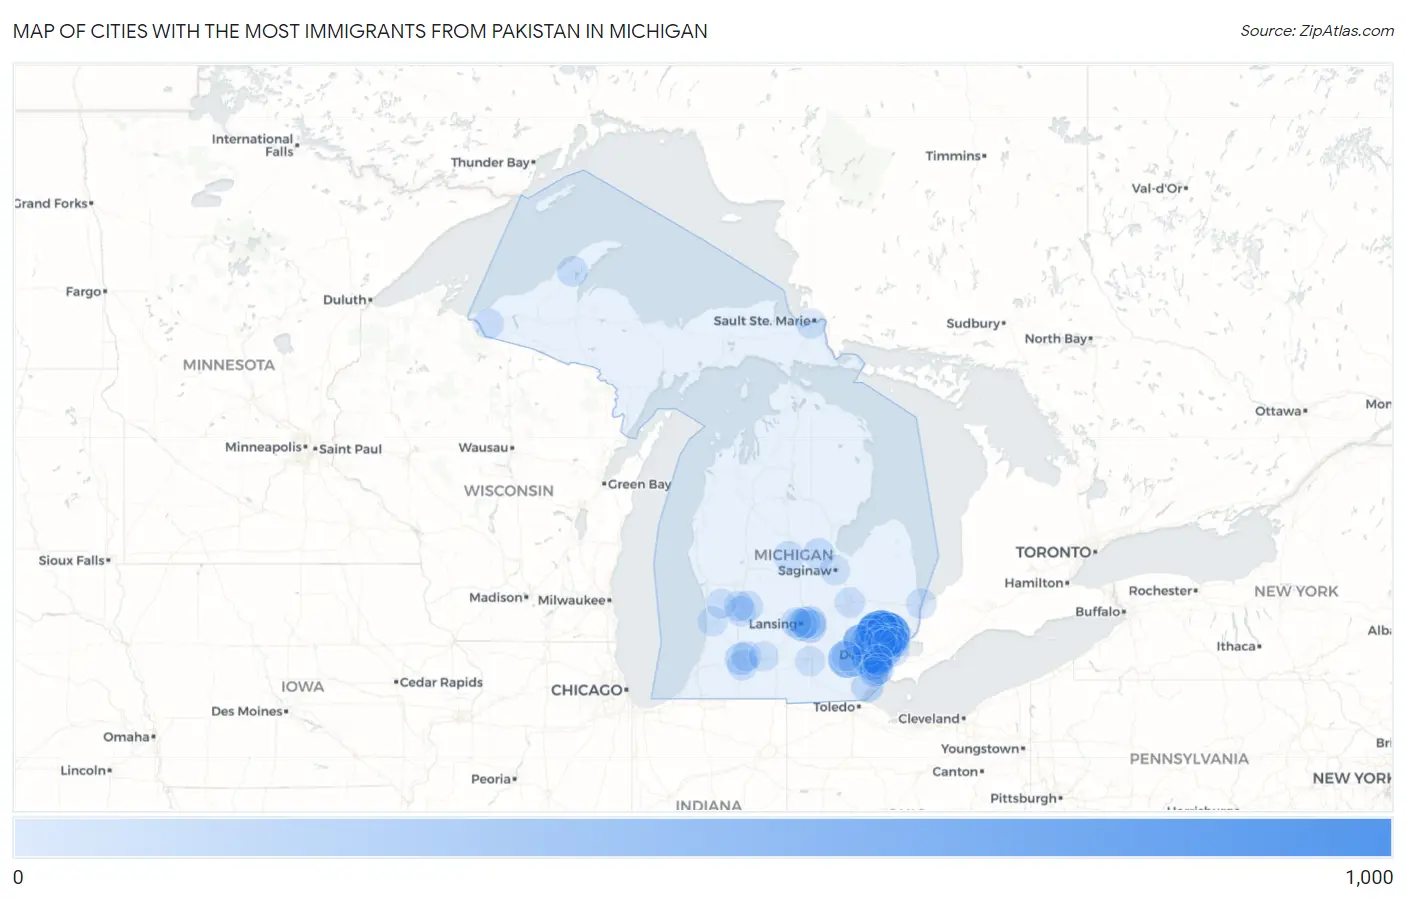
Map of Cities with the Most Immigrants from Pakistan in Michigan
0
1,000
Cities with the Most Immigrants from Pakistan in Michigan
| City | Pakistan | vs State | vs National | |
| 1. | Troy | 911 | 10,596(8.60%)#1 | 393,877(0.23%)#37 |
| 2. | Sterling Heights | 698 | 10,596(6.59%)#2 | 393,877(0.18%)#59 |
| 3. | Ann Arbor | 384 | 10,596(3.62%)#3 | 393,877(0.10%)#147 |
| 4. | Novi | 307 | 10,596(2.90%)#4 | 393,877(0.08%)#205 |
| 5. | Rochester Hills | 268 | 10,596(2.53%)#5 | 393,877(0.07%)#241 |
| 6. | Taylor | 252 | 10,596(2.38%)#6 | 393,877(0.06%)#251 |
| 7. | Farmington Hills | 246 | 10,596(2.32%)#7 | 393,877(0.06%)#260 |
| 8. | Warren | 238 | 10,596(2.25%)#8 | 393,877(0.06%)#274 |
| 9. | Dearborn | 212 | 10,596(2.00%)#9 | 393,877(0.05%)#321 |
| 10. | Westland | 199 | 10,596(1.88%)#10 | 393,877(0.05%)#344 |
| 11. | Dearborn Heights | 181 | 10,596(1.71%)#11 | 393,877(0.05%)#383 |
| 12. | Detroit | 178 | 10,596(1.68%)#12 | 393,877(0.05%)#393 |
| 13. | Okemos | 131 | 10,596(1.24%)#13 | 393,877(0.03%)#534 |
| 14. | Haslett | 124 | 10,596(1.17%)#14 | 393,877(0.03%)#554 |
| 15. | Kalamazoo | 109 | 10,596(1.03%)#15 | 393,877(0.03%)#620 |
| 16. | Wayne | 101 | 10,596(0.95%)#16 | 393,877(0.03%)#660 |
| 17. | Auburn Hills | 96 | 10,596(0.91%)#17 | 393,877(0.02%)#683 |
| 18. | Lansing | 90 | 10,596(0.85%)#18 | 393,877(0.02%)#710 |
| 19. | Monroe | 84 | 10,596(0.79%)#19 | 393,877(0.02%)#771 |
| 20. | Woodhaven | 81 | 10,596(0.76%)#20 | 393,877(0.02%)#791 |
| 21. | Southfield | 72 | 10,596(0.68%)#21 | 393,877(0.02%)#850 |
| 22. | East Lansing | 66 | 10,596(0.62%)#22 | 393,877(0.02%)#899 |
| 23. | Inkster | 62 | 10,596(0.59%)#23 | 393,877(0.02%)#941 |
| 24. | Utica | 59 | 10,596(0.56%)#24 | 393,877(0.01%)#971 |
| 25. | Midland | 53 | 10,596(0.50%)#25 | 393,877(0.01%)#1,020 |
| 26. | Livonia | 50 | 10,596(0.47%)#26 | 393,877(0.01%)#1,051 |
| 27. | Hamtramck | 42 | 10,596(0.40%)#27 | 393,877(0.01%)#1,168 |
| 28. | Forest Hills | 41 | 10,596(0.39%)#28 | 393,877(0.01%)#1,188 |
| 29. | Pontiac | 33 | 10,596(0.31%)#29 | 393,877(0.01%)#1,308 |
| 30. | Houghton | 33 | 10,596(0.31%)#30 | 393,877(0.01%)#1,320 |
| 31. | Farmington | 32 | 10,596(0.30%)#31 | 393,877(0.01%)#1,340 |
| 32. | Kentwood | 29 | 10,596(0.27%)#32 | 393,877(0.01%)#1,388 |
| 33. | Portage | 28 | 10,596(0.26%)#33 | 393,877(0.01%)#1,407 |
| 34. | Mount Pleasant | 27 | 10,596(0.25%)#34 | 393,877(0.01%)#1,438 |
| 35. | Ypsilanti | 27 | 10,596(0.25%)#35 | 393,877(0.01%)#1,439 |
| 36. | Fraser | 26 | 10,596(0.25%)#36 | 393,877(0.01%)#1,459 |
| 37. | Waverly | 23 | 10,596(0.22%)#37 | 393,877(0.01%)#1,532 |
| 38. | Bloomfield Hills | 23 | 10,596(0.22%)#38 | 393,877(0.01%)#1,549 |
| 39. | Port Huron | 22 | 10,596(0.21%)#39 | 393,877(0.01%)#1,557 |
| 40. | Clawson | 22 | 10,596(0.21%)#40 | 393,877(0.01%)#1,568 |
| 41. | Orchard Lake Village | 22 | 10,596(0.21%)#41 | 393,877(0.01%)#1,578 |
| 42. | Flint | 18 | 10,596(0.17%)#42 | 393,877(0.00%)#1,663 |
| 43. | Grosse Pointe Park | 18 | 10,596(0.17%)#43 | 393,877(0.00%)#1,678 |
| 44. | Comstock Northwest | 17 | 10,596(0.16%)#44 | 393,877(0.00%)#1,719 |
| 45. | Royal Oak | 16 | 10,596(0.15%)#45 | 393,877(0.00%)#1,726 |
| 46. | Southgate | 16 | 10,596(0.15%)#46 | 393,877(0.00%)#1,730 |
| 47. | Rochester | 16 | 10,596(0.15%)#47 | 393,877(0.00%)#1,734 |
| 48. | Lincoln Park | 15 | 10,596(0.14%)#48 | 393,877(0.00%)#1,761 |
| 49. | Ferndale | 15 | 10,596(0.14%)#49 | 393,877(0.00%)#1,765 |
| 50. | Bessemer | 14 | 10,596(0.13%)#50 | 393,877(0.00%)#1,832 |
| 51. | Grand Rapids | 13 | 10,596(0.12%)#51 | 393,877(0.00%)#1,835 |
| 52. | St Clair Shores | 13 | 10,596(0.12%)#52 | 393,877(0.00%)#1,839 |
| 53. | Wixom | 13 | 10,596(0.12%)#53 | 393,877(0.00%)#1,856 |
| 54. | Center Line | 13 | 10,596(0.12%)#54 | 393,877(0.00%)#1,863 |
| 55. | Allen Park | 11 | 10,596(0.10%)#55 | 393,877(0.00%)#1,933 |
| 56. | Trenton | 10 | 10,596(0.09%)#56 | 393,877(0.00%)#1,984 |
| 57. | Saginaw | 7 | 10,596(0.07%)#57 | 393,877(0.00%)#2,112 |
| 58. | Flat Rock | 7 | 10,596(0.07%)#58 | 393,877(0.00%)#2,128 |
| 59. | Battle Creek | 5 | 10,596(0.05%)#59 | 393,877(0.00%)#2,210 |
| 60. | Jackson | 5 | 10,596(0.05%)#60 | 393,877(0.00%)#2,220 |
| 61. | Sault Ste Marie | 5 | 10,596(0.05%)#61 | 393,877(0.00%)#2,226 |
| 62. | Holland | 3 | 10,596(0.03%)#62 | 393,877(0.00%)#2,300 |
| 63. | Allendale | 2 | 10,596(0.02%)#63 | 393,877(0.00%)#2,336 |
| 64. | Barton Hills | 2 | 10,596(0.02%)#64 | 393,877(0.00%)#2,357 |
Common Questions
What are the Top 10 Cities with the Most Immigrants from Pakistan in Michigan?
Top 10 Cities with the Most Immigrants from Pakistan in Michigan are:
#1
911
#2
698
#3
384
#4
307
#5
268
#6
252
#7
246
#8
238
#9
212
#10
199
What city has the Most Immigrants from Pakistan in Michigan?
Troy has the Most Immigrants from Pakistan in Michigan with 911.
What is the Total Immigrants from Pakistan in the State of Michigan?
Total Immigrants from Pakistan in Michigan is 10,596.
What is the Total Immigrants from Pakistan in the United States?
Total Immigrants from Pakistan in the United States is 393,877.