Cities with the Most Immigrants from Ethiopia in Michigan
RELATED REPORTS & OPTIONS
Ethiopia
Michigan
Compare Cities
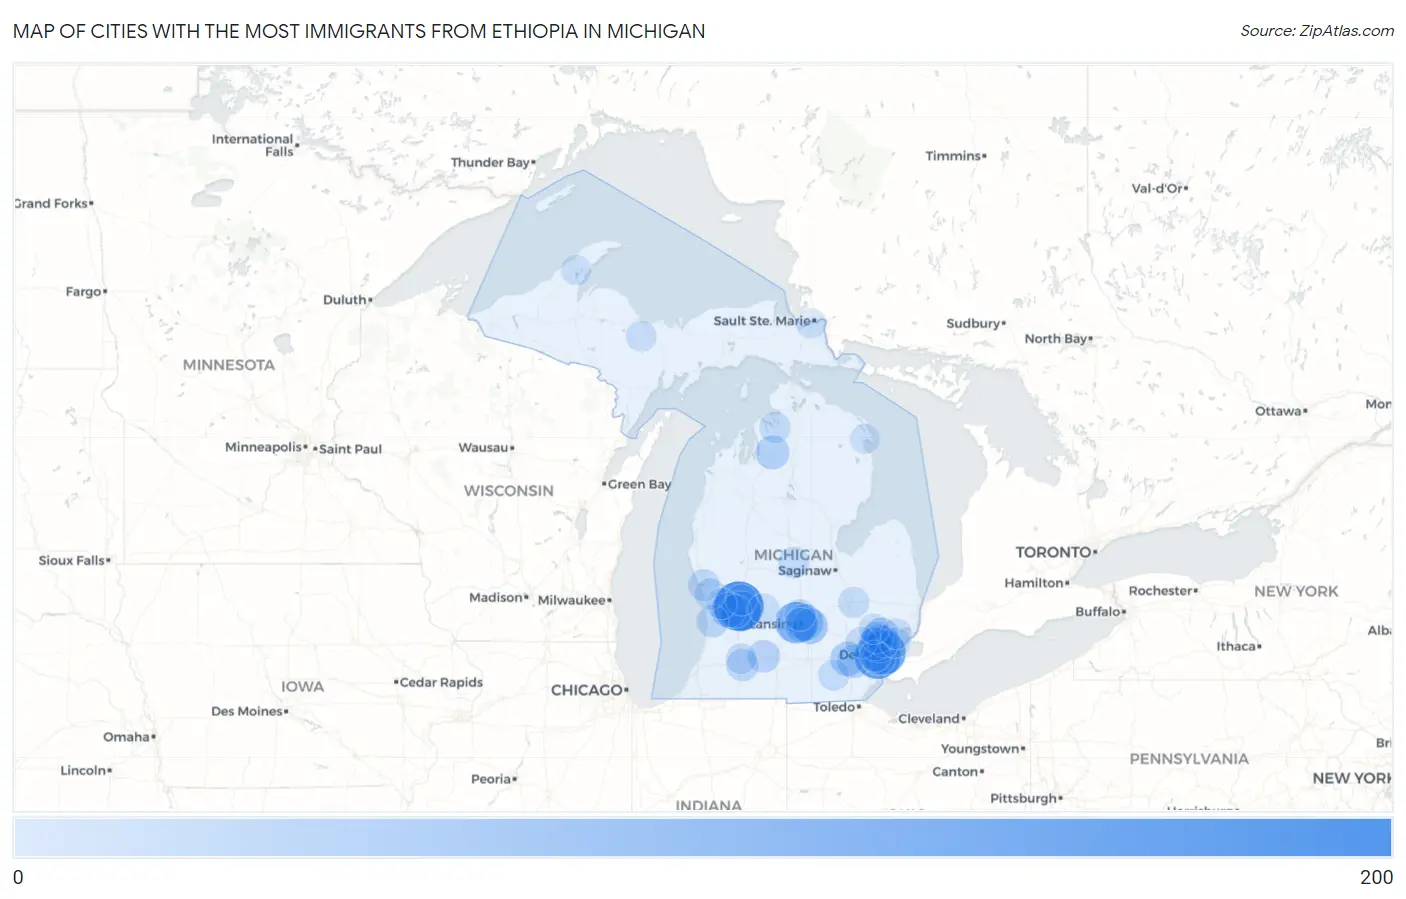
Map of Cities with the Most Immigrants from Ethiopia in Michigan
0
200
Cities with the Most Immigrants from Ethiopia in Michigan
| City | Ethiopia | vs State | vs National | |
| 1. | Grand Rapids | 191 | 1,985(9.62%)#1 | 275,476(0.07%)#218 |
| 2. | Dearborn | 151 | 1,985(7.61%)#2 | 275,476(0.05%)#270 |
| 3. | Detroit | 138 | 1,985(6.95%)#3 | 275,476(0.05%)#293 |
| 4. | Waverly | 111 | 1,985(5.59%)#4 | 275,476(0.04%)#352 |
| 5. | Kentwood | 93 | 1,985(4.69%)#5 | 275,476(0.03%)#404 |
| 6. | Oak Park | 73 | 1,985(3.68%)#6 | 275,476(0.03%)#466 |
| 7. | East Lansing | 61 | 1,985(3.07%)#7 | 275,476(0.02%)#519 |
| 8. | Scotts | 60 | 1,985(3.02%)#8 | 275,476(0.02%)#528 |
| 9. | Okemos | 53 | 1,985(2.67%)#9 | 275,476(0.02%)#574 |
| 10. | Jenison | 45 | 1,985(2.27%)#10 | 275,476(0.02%)#635 |
| 11. | Troy | 43 | 1,985(2.17%)#11 | 275,476(0.02%)#646 |
| 12. | Ann Arbor | 41 | 1,985(2.07%)#12 | 275,476(0.01%)#660 |
| 13. | Lansing | 40 | 1,985(2.02%)#13 | 275,476(0.01%)#671 |
| 14. | Mancelona | 36 | 1,985(1.81%)#14 | 275,476(0.01%)#723 |
| 15. | Ypsilanti | 34 | 1,985(1.71%)#15 | 275,476(0.01%)#744 |
| 16. | Wyoming | 29 | 1,985(1.46%)#16 | 275,476(0.01%)#805 |
| 17. | Southfield | 29 | 1,985(1.46%)#17 | 275,476(0.01%)#806 |
| 18. | Battle Creek | 24 | 1,985(1.21%)#18 | 275,476(0.01%)#874 |
| 19. | Portage | 22 | 1,985(1.11%)#19 | 275,476(0.01%)#913 |
| 20. | Holland | 21 | 1,985(1.06%)#20 | 275,476(0.01%)#929 |
| 21. | Melvindale | 21 | 1,985(1.06%)#21 | 275,476(0.01%)#938 |
| 22. | Madison Heights | 20 | 1,985(1.01%)#22 | 275,476(0.01%)#951 |
| 23. | Birmingham | 18 | 1,985(0.91%)#23 | 275,476(0.01%)#987 |
| 24. | Muskegon | 15 | 1,985(0.76%)#24 | 275,476(0.01%)#1,047 |
| 25. | Dewitt | 13 | 1,985(0.65%)#25 | 275,476(0.00%)#1,116 |
| 26. | Fruitport | 13 | 1,985(0.65%)#26 | 275,476(0.00%)#1,120 |
| 27. | Boyne City | 12 | 1,985(0.60%)#27 | 275,476(0.00%)#1,145 |
| 28. | Shepherd | 12 | 1,985(0.60%)#28 | 275,476(0.00%)#1,147 |
| 29. | Novi | 9 | 1,985(0.45%)#29 | 275,476(0.00%)#1,209 |
| 30. | Dearborn Heights | 9 | 1,985(0.45%)#30 | 275,476(0.00%)#1,211 |
| 31. | Burton | 9 | 1,985(0.45%)#31 | 275,476(0.00%)#1,219 |
| 32. | Northview | 9 | 1,985(0.45%)#32 | 275,476(0.00%)#1,234 |
| 33. | Clinton | 9 | 1,985(0.45%)#33 | 275,476(0.00%)#1,247 |
| 34. | Kalamazoo | 7 | 1,985(0.35%)#34 | 275,476(0.00%)#1,287 |
| 35. | Saranac | 7 | 1,985(0.35%)#35 | 275,476(0.00%)#1,314 |
| 36. | Allendale | 6 | 1,985(0.30%)#36 | 275,476(0.00%)#1,328 |
| 37. | K I Sawyer | 6 | 1,985(0.30%)#37 | 275,476(0.00%)#1,342 |
| 38. | St Clair Shores | 5 | 1,985(0.25%)#38 | 275,476(0.00%)#1,359 |
| 39. | Mount Clemens | 5 | 1,985(0.25%)#39 | 275,476(0.00%)#1,367 |
| 40. | Auburn Hills | 4 | 1,985(0.20%)#40 | 275,476(0.00%)#1,390 |
| 41. | Dollar Bay | 2 | 1,985(0.10%)#41 | 275,476(0.00%)#1,457 |
| 42. | Sault Ste Marie | 1 | 1,985(0.05%)#42 | 275,476(0.00%)#1,486 |
| 43. | Alpena | 1 | 1,985(0.05%)#43 | 275,476(0.00%)#1,488 |
Common Questions
What are the Top 10 Cities with the Most Immigrants from Ethiopia in Michigan?
Top 10 Cities with the Most Immigrants from Ethiopia in Michigan are:
#1
191
#2
151
#3
138
#4
111
#5
93
#6
73
#7
61
#8
53
#9
45
#10
43
What city has the Most Immigrants from Ethiopia in Michigan?
Grand Rapids has the Most Immigrants from Ethiopia in Michigan with 191.
What is the Total Immigrants from Ethiopia in the State of Michigan?
Total Immigrants from Ethiopia in Michigan is 1,985.
What is the Total Immigrants from Ethiopia in the United States?
Total Immigrants from Ethiopia in the United States is 275,476.