Cities with the Highest Percentage of Immigrants from Northern Africa in Michigan
RELATED REPORTS & OPTIONS
Northern Africa
Michigan
Compare Cities
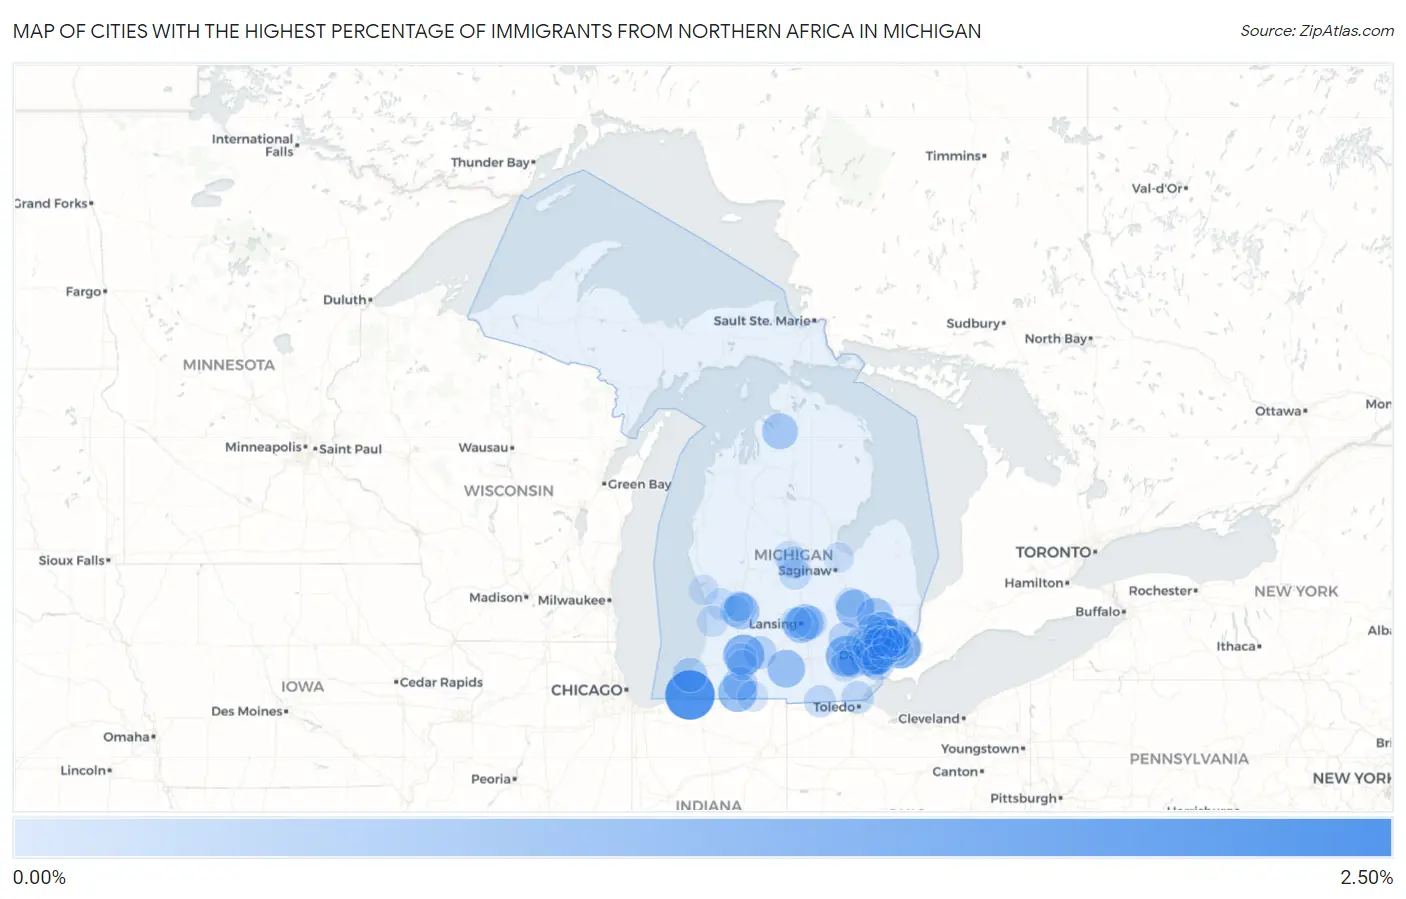
Map of Cities with the Highest Percentage of Immigrants from Northern Africa in Michigan
0.00%
2.50%
Cities with the Highest Percentage of Immigrants from Northern Africa in Michigan
| City | Northern Africa | vs State | vs National | |
| 1. | Galien | 2.04% | 0.089%(+1.95)#-1 | 0.13%(+1.91)#0 |
| 2. | Village Of Grosse Pointe Shores | 1.23% | 0.089%(+1.14)#0 | 0.13%(+1.10)#1 |
| 3. | Parchment | 1.13% | 0.089%(+1.04)#1 | 0.13%(+0.999)#2 |
| 4. | Barton Hills | 1.13% | 0.089%(+1.04)#2 | 0.13%(+0.999)#3 |
| 5. | Fraser | 1.00% | 0.089%(+0.906)#3 | 0.13%(+0.868)#4 |
| 6. | Westland | 0.91% | 0.089%(+0.819)#22 | 0.13%(+0.781)#914 |
| 7. | Constantine | 0.90% | 0.089%(+0.814)#23 | 0.13%(+0.776)#915 |
| 8. | Grand Blanc | 0.86% | 0.089%(+0.770)#24 | 0.13%(+0.731)#916 |
| 9. | Homer | 0.78% | 0.089%(+0.693)#25 | 0.13%(+0.654)#917 |
| 10. | Oxford | 0.69% | 0.089%(+0.599)#26 | 0.13%(+0.561)#918 |
| 11. | Dearborn Heights | 0.68% | 0.089%(+0.594)#34 | 0.13%(+0.556)#1,292 |
| 12. | East Lansing | 0.66% | 0.089%(+0.572)#35 | 0.13%(+0.533)#1,293 |
| 13. | Kentwood | 0.63% | 0.089%(+0.544)#36 | 0.13%(+0.505)#1,294 |
| 14. | Lansing | 0.62% | 0.089%(+0.533)#37 | 0.13%(+0.495)#1,295 |
| 15. | Boyne Falls | 0.59% | 0.089%(+0.497)#38 | 0.13%(+0.459)#1,296 |
| 16. | Troy | 0.58% | 0.089%(+0.491)#39 | 0.13%(+0.453)#1,297 |
| 17. | Rochester Hills | 0.47% | 0.089%(+0.379)#40 | 0.13%(+0.341)#1,298 |
| 18. | Shoreham | 0.43% | 0.089%(+0.345)#41 | 0.13%(+0.307)#1,299 |
| 19. | Three Rivers | 0.40% | 0.089%(+0.315)#42 | 0.13%(+0.276)#1,300 |
| 20. | Dearborn | 0.40% | 0.089%(+0.308)#43 | 0.13%(+0.270)#1,301 |
| 21. | Farmington Hills | 0.39% | 0.089%(+0.296)#44 | 0.13%(+0.258)#1,302 |
| 22. | Southgate | 0.34% | 0.089%(+0.251)#45 | 0.13%(+0.213)#1,303 |
| 23. | Brighton | 0.33% | 0.089%(+0.245)#46 | 0.13%(+0.207)#1,304 |
| 24. | Haslett | 0.31% | 0.089%(+0.220)#47 | 0.13%(+0.182)#1,305 |
| 25. | Ann Arbor | 0.30% | 0.089%(+0.211)#48 | 0.13%(+0.173)#1,306 |
| 26. | Level Park Oak Park | 0.30% | 0.089%(+0.208)#49 | 0.13%(+0.170)#1,307 |
| 27. | Ypsilanti | 0.26% | 0.089%(+0.173)#50 | 0.13%(+0.135)#1,308 |
| 28. | Temperance | 0.25% | 0.089%(+0.163)#51 | 0.13%(+0.125)#1,309 |
| 29. | Grosse Pointe Woods | 0.23% | 0.089%(+0.143)#52 | 0.13%(+0.105)#1,310 |
| 30. | Sterling Heights | 0.22% | 0.089%(+0.130)#53 | 0.13%(+0.092)#1,311 |
| 31. | Shepherd | 0.21% | 0.089%(+0.123)#54 | 0.13%(+0.085)#1,312 |
| 32. | Morenci | 0.20% | 0.089%(+0.111)#55 | 0.13%(+0.073)#1,313 |
| 33. | Center Line | 0.20% | 0.089%(+0.111)#56 | 0.13%(+0.073)#1,314 |
| 34. | Novi | 0.19% | 0.089%(+0.102)#57 | 0.13%(+0.064)#1,315 |
| 35. | Grosse Pointe Farms | 0.17% | 0.089%(+0.081)#58 | 0.13%(+0.042)#1,316 |
| 36. | Hazel Park | 0.16% | 0.089%(+0.070)#59 | 0.13%(+0.032)#1,317 |
| 37. | Alma | 0.16% | 0.089%(+0.070)#60 | 0.13%(+0.032)#1,318 |
| 38. | Melvindale | 0.16% | 0.089%(+0.069)#61 | 0.13%(+0.031)#1,319 |
| 39. | Kalamazoo | 0.16% | 0.089%(+0.068)#62 | 0.13%(+0.029)#1,320 |
| 40. | Madison Heights | 0.14% | 0.089%(+0.051)#63 | 0.13%(+0.013)#1,321 |
| 41. | Allendale | 0.13% | 0.089%(+0.046)#64 | 0.13%(+0.007)#1,322 |
| 42. | Rochester | 0.13% | 0.089%(+0.042)#65 | 0.13%(+0.004)#1,323 |
| 43. | Harper Woods | 0.13% | 0.089%(+0.042)#66 | 0.13%(+0.003)#1,324 |
| 44. | East Grand Rapids | 0.12% | 0.089%(+0.034)#67 | 0.13%(-0.004)#1,325 |
| 45. | Farmington | 0.12% | 0.089%(+0.033)#68 | 0.13%(-0.006)#1,326 |
| 46. | Waverly | 0.11% | 0.089%(+0.025)#69 | 0.13%(-0.014)#1,327 |
| 47. | Holland | 0.11% | 0.089%(+0.022)#70 | 0.13%(-0.016)#1,328 |
| 48. | Wyoming | 0.11% | 0.089%(+0.019)#71 | 0.13%(-0.019)#1,351 |
| 49. | Livonia | 0.10% | 0.089%(+0.012)#72 | 0.13%(-0.026)#1,352 |
| 50. | Oak Park | 0.095% | 0.089%(+0.006)#73 | 0.13%(-0.032)#1,353 |
| 51. | Hamtramck | 0.086% | 0.089%(-0.003)#74 | 0.13%(-0.041)#1,354 |
| 52. | Saline | 0.078% | 0.089%(-0.011)#75 | 0.13%(-0.049)#1,355 |
| 53. | Eastpointe | 0.076% | 0.089%(-0.013)#76 | 0.13%(-0.051)#1,356 |
| 54. | Taylor | 0.075% | 0.089%(-0.014)#77 | 0.13%(-0.053)#1,357 |
| 55. | Birmingham | 0.074% | 0.089%(-0.016)#78 | 0.13%(-0.054)#1,358 |
| 56. | Sturgis | 0.072% | 0.089%(-0.017)#79 | 0.13%(-0.055)#1,359 |
| 57. | Mount Pleasant | 0.069% | 0.089%(-0.020)#80 | 0.13%(-0.059)#1,360 |
| 58. | Garden City | 0.062% | 0.089%(-0.027)#81 | 0.13%(-0.065)#1,361 |
| 59. | Mount Clemens | 0.051% | 0.089%(-0.038)#82 | 0.13%(-0.076)#1,362 |
| 60. | Portage | 0.049% | 0.089%(-0.040)#83 | 0.13%(-0.078)#1,363 |
| 61. | Southfield | 0.045% | 0.089%(-0.044)#84 | 0.13%(-0.083)#1,364 |
| 62. | Royal Oak | 0.043% | 0.089%(-0.046)#85 | 0.13%(-0.084)#1,365 |
| 63. | Allen Park | 0.042% | 0.089%(-0.047)#86 | 0.13%(-0.085)#1,366 |
| 64. | Bay City | 0.037% | 0.089%(-0.052)#87 | 0.13%(-0.091)#1,367 |
| 65. | Grand Rapids | 0.036% | 0.089%(-0.053)#88 | 0.13%(-0.092)#1,368 |
| 66. | St Clair Shores | 0.031% | 0.089%(-0.058)#89 | 0.13%(-0.097)#1,369 |
| 67. | Norton Shores | 0.028% | 0.089%(-0.061)#90 | 0.13%(-0.099)#1,370 |
| 68. | Pontiac | 0.026% | 0.089%(-0.063)#91 | 0.13%(-0.102)#1,371 |
| 69. | Flint | 0.026% | 0.089%(-0.063)#92 | 0.13%(-0.102)#1,372 |
| 70. | Detroit | 0.024% | 0.089%(-0.065)#93 | 0.13%(-0.103)#1,387 |
| 71. | Warren | 0.021% | 0.089%(-0.068)#94 | 0.13%(-0.106)#1,388 |
Common Questions
What are the Top 10 Cities with the Highest Percentage of Immigrants from Northern Africa in Michigan?
Top 10 Cities with the Highest Percentage of Immigrants from Northern Africa in Michigan are:
#1
2.04%
#2
1.23%
#3
1.13%
#4
1.13%
#5
1.00%
#6
0.91%
#7
0.90%
#8
0.86%
#9
0.78%
#10
0.69%
What city has the Highest Percentage of Immigrants from Northern Africa in Michigan?
Galien has the Highest Percentage of Immigrants from Northern Africa in Michigan with 2.04%.
What is the Percentage of Immigrants from Northern Africa in the State of Michigan?
Percentage of Immigrants from Northern Africa in Michigan is 0.089%.
What is the Percentage of Immigrants from Northern Africa in the United States?
Percentage of Immigrants from Northern Africa in the United States is 0.13%.