Cities with the Highest Percentage of Immigrants from South Central Asia in Michigan
RELATED REPORTS & OPTIONS
South Central Asia
Michigan
Compare Cities
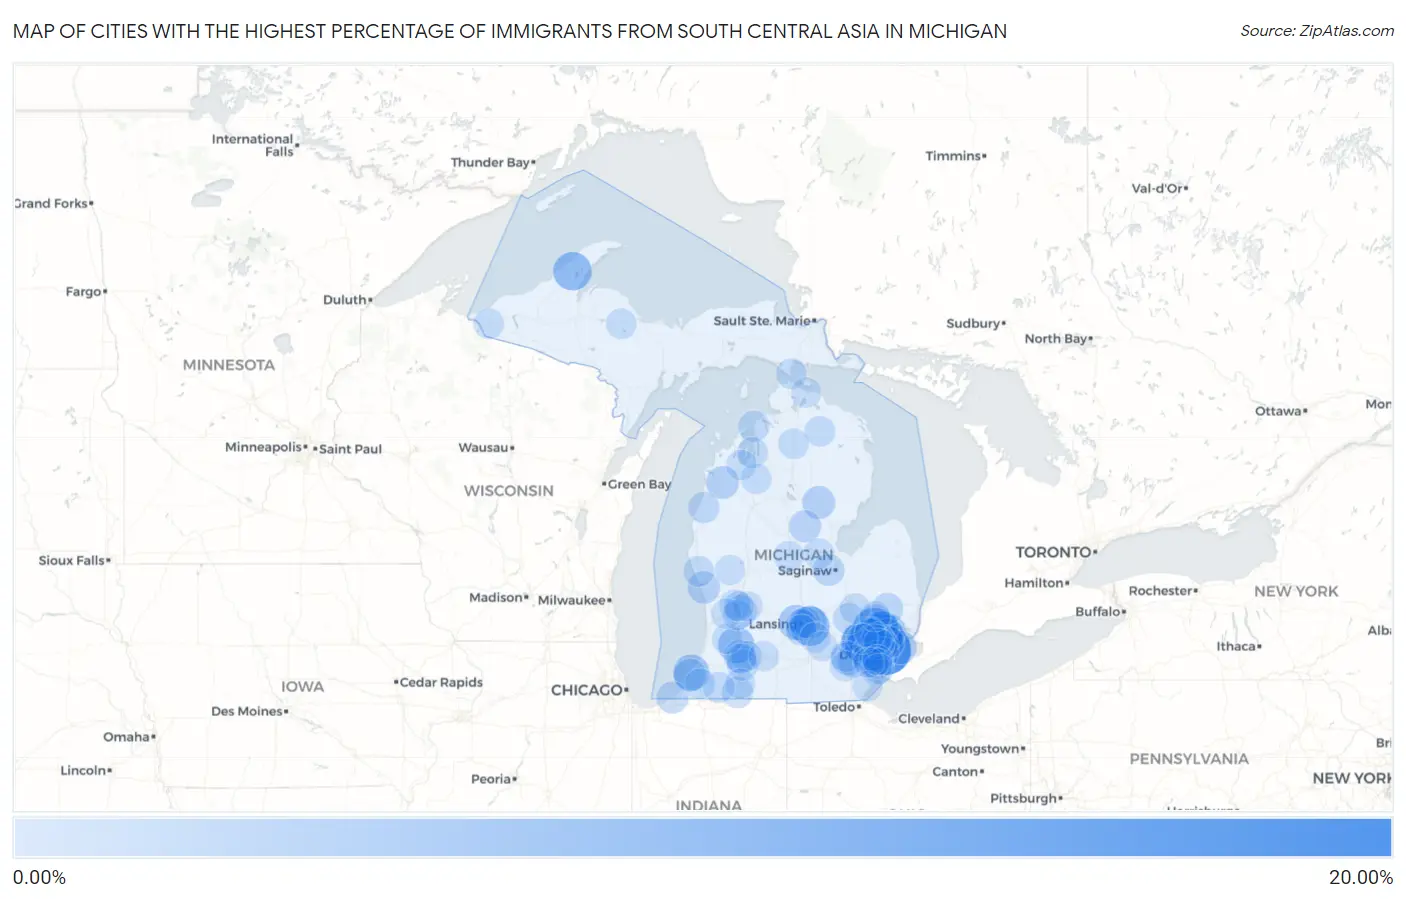
Map of Cities with the Highest Percentage of Immigrants from South Central Asia in Michigan
0.00%
20.00%
Cities with the Highest Percentage of Immigrants from South Central Asia in Michigan
| City | South Central Asia | vs State | vs National | |
| 1. | Hamtramck | 17.88% | 1.17%(+16.7)#1 | 1.31%(+16.6)#48 |
| 2. | Farmington | 13.21% | 1.17%(+12.0)#2 | 1.31%(+11.9)#102 |
| 3. | Troy | 11.53% | 1.17%(+10.4)#3 | 1.31%(+10.2)#141 |
| 4. | Auburn Hills | 10.86% | 1.17%(+9.69)#4 | 1.31%(+9.55)#157 |
| 5. | Novi | 9.17% | 1.17%(+8.00)#5 | 1.31%(+7.86)#203 |
| 6. | Okemos | 8.45% | 1.17%(+7.28)#6 | 1.31%(+7.14)#234 |
| 7. | Farmington Hills | 8.36% | 1.17%(+7.19)#7 | 1.31%(+7.06)#237 |
| 8. | Houghton | 7.89% | 1.17%(+6.72)#8 | 1.31%(+6.58)#260 |
| 9. | Otsego | 5.95% | 1.17%(+4.78)#9 | 1.31%(+4.64)#390 |
| 10. | Orchard Lake Village | 5.85% | 1.17%(+4.68)#10 | 1.31%(+4.54)#409 |
| 11. | St Joseph | 5.59% | 1.17%(+4.42)#11 | 1.31%(+4.28)#443 |
| 12. | Rochester Hills | 5.31% | 1.17%(+4.14)#12 | 1.31%(+4.00)#479 |
| 13. | Waverly | 4.86% | 1.17%(+3.69)#13 | 1.31%(+3.55)#552 |
| 14. | Bloomfield Hills | 4.68% | 1.17%(+3.51)#14 | 1.31%(+3.37)#580 |
| 15. | Utica | 4.22% | 1.17%(+3.05)#15 | 1.31%(+2.91)#674 |
| 16. | Warren | 4.03% | 1.17%(+2.86)#16 | 1.31%(+2.72)#714 |
| 17. | Wixom | 3.84% | 1.17%(+2.67)#17 | 1.31%(+2.53)#767 |
| 18. | Village Of Grosse Pointe Shores | 3.60% | 1.17%(+2.43)#18 | 1.31%(+2.29)#842 |
| 19. | Sterling Heights | 3.34% | 1.17%(+2.17)#19 | 1.31%(+2.03)#925 |
| 20. | Haslett | 3.33% | 1.17%(+2.16)#20 | 1.31%(+2.02)#931 |
| 21. | Thompsonville | 2.88% | 1.17%(+1.71)#21 | 1.31%(+1.57)#1,114 |
| 22. | West Branch | 2.87% | 1.17%(+1.70)#22 | 1.31%(+1.56)#1,119 |
| 23. | Franklin | 2.83% | 1.17%(+1.66)#23 | 1.31%(+1.52)#1,131 |
| 24. | Shoreham | 2.82% | 1.17%(+1.65)#24 | 1.31%(+1.51)#1,133 |
| 25. | Ann Arbor | 2.67% | 1.17%(+1.51)#25 | 1.31%(+1.37)#1,207 |
| 26. | Center Line | 2.65% | 1.17%(+1.48)#26 | 1.31%(+1.34)#1,220 |
| 27. | Roosevelt Park | 2.54% | 1.17%(+1.37)#27 | 1.31%(+1.23)#1,274 |
| 28. | Westwood | 2.53% | 1.17%(+1.36)#28 | 1.31%(+1.22)#1,279 |
| 29. | Ypsilanti | 2.29% | 1.17%(+1.12)#29 | 1.31%(+0.979)#1,426 |
| 30. | Gladwin | 2.25% | 1.17%(+1.08)#30 | 1.31%(+0.942)#1,447 |
| 31. | Kentwood | 2.14% | 1.17%(+0.966)#31 | 1.31%(+0.827)#1,534 |
| 32. | Michiana | 2.11% | 1.17%(+0.936)#32 | 1.31%(+0.797)#1,560 |
| 33. | Rochester | 2.05% | 1.17%(+0.880)#33 | 1.31%(+0.742)#1,598 |
| 34. | Northville | 2.00% | 1.17%(+0.835)#34 | 1.31%(+0.696)#1,638 |
| 35. | Lake Orion | 1.89% | 1.17%(+0.718)#35 | 1.31%(+0.579)#1,734 |
| 36. | Westland | 1.77% | 1.17%(+0.597)#36 | 1.31%(+0.458)#1,845 |
| 37. | Shields | 1.76% | 1.17%(+0.591)#37 | 1.31%(+0.452)#1,853 |
| 38. | Lansing | 1.67% | 1.17%(+0.505)#38 | 1.31%(+0.366)#1,942 |
| 39. | Almont | 1.66% | 1.17%(+0.494)#39 | 1.31%(+0.355)#1,956 |
| 40. | Constantine | 1.63% | 1.17%(+0.457)#40 | 1.31%(+0.318)#1,999 |
| 41. | Fenton | 1.62% | 1.17%(+0.452)#41 | 1.31%(+0.313)#2,008 |
| 42. | Stronach | 1.56% | 1.17%(+0.393)#42 | 1.31%(+0.254)#2,089 |
| 43. | Bingham Farms | 1.54% | 1.17%(+0.371)#43 | 1.31%(+0.232)#2,111 |
| 44. | Portage | 1.49% | 1.17%(+0.321)#44 | 1.31%(+0.182)#2,175 |
| 45. | East Lansing | 1.44% | 1.17%(+0.273)#45 | 1.31%(+0.135)#2,238 |
| 46. | Ferndale | 1.40% | 1.17%(+0.232)#46 | 1.31%(+0.094)#2,299 |
| 47. | Barton Hills | 1.35% | 1.17%(+0.182)#47 | 1.31%(+0.043)#2,373 |
| 48. | Southfield | 1.33% | 1.17%(+0.163)#48 | 1.31%(+0.024)#2,389 |
| 49. | Dearborn | 1.31% | 1.17%(+0.138)#49 | 1.31%(-0.001)#2,416 |
| 50. | Norwood | 1.28% | 1.17%(+0.113)#50 | 1.31%(-0.026)#2,449 |
| 51. | Comstock Northwest | 1.25% | 1.17%(+0.078)#51 | 1.31%(-0.061)#2,487 |
| 52. | Cassopolis | 1.20% | 1.17%(+0.031)#52 | 1.31%(-0.108)#2,564 |
| 53. | Walker | 1.16% | 1.17%(-0.009)#53 | 1.31%(-0.148)#2,644 |
| 54. | Whitehall | 1.12% | 1.17%(-0.045)#54 | 1.31%(-0.184)#2,704 |
| 55. | Chassell | 1.12% | 1.17%(-0.046)#55 | 1.31%(-0.184)#2,705 |
| 56. | Holt | 1.12% | 1.17%(-0.046)#56 | 1.31%(-0.185)#2,706 |
| 57. | Elk Rapids | 1.08% | 1.17%(-0.085)#57 | 1.31%(-0.224)#2,777 |
| 58. | Dearborn Heights | 1.08% | 1.17%(-0.089)#58 | 1.31%(-0.228)#2,787 |
| 59. | Allegan | 1.02% | 1.17%(-0.146)#59 | 1.31%(-0.285)#2,897 |
| 60. | Berrien Springs | 0.99% | 1.17%(-0.180)#60 | 1.31%(-0.319)#2,968 |
| 61. | Livonia | 0.98% | 1.17%(-0.187)#61 | 1.31%(-0.326)#2,981 |
| 62. | Midland | 0.98% | 1.17%(-0.190)#62 | 1.31%(-0.329)#2,985 |
| 63. | Royal Oak | 0.96% | 1.17%(-0.211)#63 | 1.31%(-0.350)#3,023 |
| 64. | Canada Creek Ranch | 0.96% | 1.17%(-0.214)#64 | 1.31%(-0.353)#3,026 |
| 65. | Wayne | 0.94% | 1.17%(-0.230)#65 | 1.31%(-0.369)#3,069 |
| 66. | Sylvan Lake | 0.93% | 1.17%(-0.244)#66 | 1.31%(-0.383)#3,094 |
| 67. | West Ishpeming | 0.92% | 1.17%(-0.248)#67 | 1.31%(-0.387)#3,108 |
| 68. | Detroit | 0.92% | 1.17%(-0.252)#68 | 1.31%(-0.391)#3,113 |
| 69. | Mount Pleasant | 0.90% | 1.17%(-0.267)#69 | 1.31%(-0.405)#3,144 |
| 70. | Beverly Hills | 0.90% | 1.17%(-0.269)#70 | 1.31%(-0.408)#3,149 |
| 71. | Grand Blanc | 0.90% | 1.17%(-0.273)#71 | 1.31%(-0.412)#3,162 |
| 72. | Fife Lake | 0.89% | 1.17%(-0.282)#72 | 1.31%(-0.420)#3,180 |
| 73. | Woodhaven | 0.89% | 1.17%(-0.283)#73 | 1.31%(-0.422)#3,184 |
| 74. | St Ignace | 0.85% | 1.17%(-0.318)#74 | 1.31%(-0.457)#3,269 |
| 75. | Kalamazoo | 0.84% | 1.17%(-0.325)#75 | 1.31%(-0.464)#3,289 |
| 76. | Bessemer | 0.82% | 1.17%(-0.349)#76 | 1.31%(-0.488)#3,344 |
| 77. | Birmingham | 0.81% | 1.17%(-0.364)#77 | 1.31%(-0.503)#3,372 |
| 78. | Keego Harbor | 0.79% | 1.17%(-0.375)#78 | 1.31%(-0.514)#3,400 |
| 79. | Oak Park | 0.78% | 1.17%(-0.389)#79 | 1.31%(-0.528)#3,440 |
| 80. | Cutlerville | 0.76% | 1.17%(-0.407)#80 | 1.31%(-0.546)#3,493 |
| 81. | Gaylord | 0.75% | 1.17%(-0.418)#81 | 1.31%(-0.557)#3,521 |
| 82. | Three Rivers | 0.74% | 1.17%(-0.424)#82 | 1.31%(-0.563)#3,539 |
| 83. | Southgate | 0.71% | 1.17%(-0.458)#83 | 1.31%(-0.597)#3,637 |
| 84. | Traverse City | 0.69% | 1.17%(-0.477)#84 | 1.31%(-0.616)#3,709 |
| 85. | Oxford | 0.69% | 1.17%(-0.481)#85 | 1.31%(-0.620)#3,717 |
| 86. | Taylor | 0.68% | 1.17%(-0.489)#86 | 1.31%(-0.628)#3,741 |
| 87. | Forest Hills | 0.65% | 1.17%(-0.515)#87 | 1.31%(-0.654)#3,824 |
| 88. | Trenton | 0.65% | 1.17%(-0.523)#88 | 1.31%(-0.662)#3,850 |
| 89. | Saline | 0.61% | 1.17%(-0.556)#89 | 1.31%(-0.695)#3,950 |
| 90. | Newaygo | 0.61% | 1.17%(-0.559)#90 | 1.31%(-0.698)#3,955 |
| 91. | Battle Creek | 0.60% | 1.17%(-0.569)#91 | 1.31%(-0.708)#3,987 |
| 92. | Walled Lake | 0.59% | 1.17%(-0.577)#92 | 1.31%(-0.716)#4,023 |
| 93. | Cheboygan | 0.59% | 1.17%(-0.584)#93 | 1.31%(-0.723)#4,045 |
| 94. | Dansville | 0.57% | 1.17%(-0.603)#94 | 1.31%(-0.742)#4,098 |
| 95. | Stockbridge | 0.56% | 1.17%(-0.613)#95 | 1.31%(-0.752)#4,130 |
| 96. | Hudsonville | 0.55% | 1.17%(-0.619)#96 | 1.31%(-0.758)#4,155 |
| 97. | Monroe | 0.54% | 1.17%(-0.625)#97 | 1.31%(-0.764)#4,176 |
| 98. | Grand Rapids | 0.52% | 1.17%(-0.650)#98 | 1.31%(-0.789)#4,266 |
| 99. | Romulus | 0.51% | 1.17%(-0.654)#99 | 1.31%(-0.793)#4,285 |
| 100. | Allen Park | 0.51% | 1.17%(-0.655)#100 | 1.31%(-0.794)#4,289 |
Common Questions
What are the Top 10 Cities with the Highest Percentage of Immigrants from South Central Asia in Michigan?
Top 10 Cities with the Highest Percentage of Immigrants from South Central Asia in Michigan are:
#1
17.88%
#2
13.21%
#3
11.53%
#4
10.86%
#5
9.17%
#6
8.45%
#7
8.36%
#8
7.89%
#9
5.95%
#10
5.85%
What city has the Highest Percentage of Immigrants from South Central Asia in Michigan?
Hamtramck has the Highest Percentage of Immigrants from South Central Asia in Michigan with 17.88%.
What is the Percentage of Immigrants from South Central Asia in the State of Michigan?
Percentage of Immigrants from South Central Asia in Michigan is 1.17%.
What is the Percentage of Immigrants from South Central Asia in the United States?
Percentage of Immigrants from South Central Asia in the United States is 1.31%.