Cities with the Most Immigrants from Poland in New York
RELATED REPORTS & OPTIONS
Poland
New York
Compare Cities
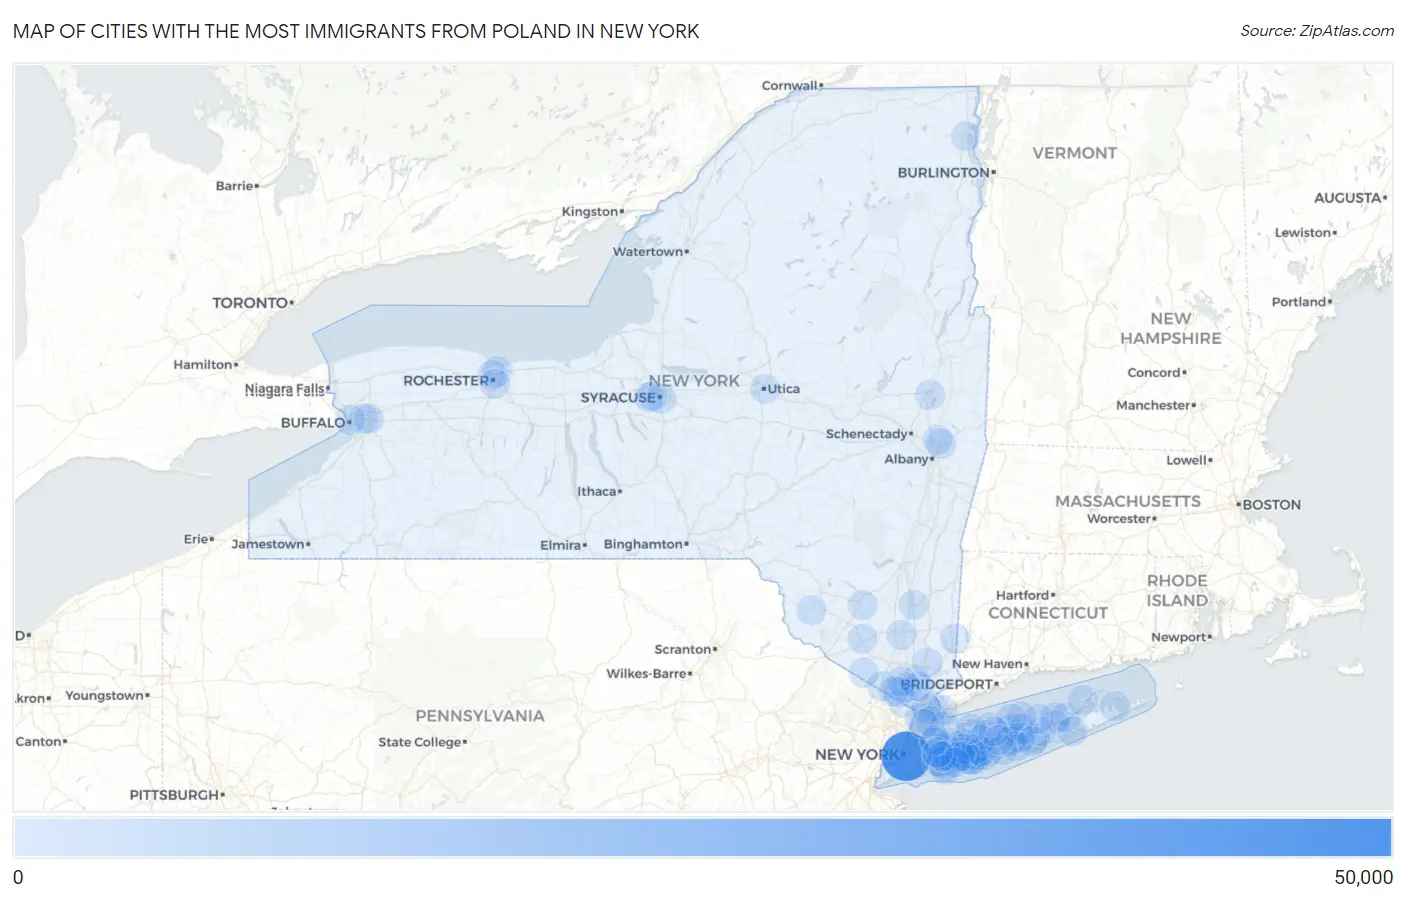
Map of Cities with the Most Immigrants from Poland in New York
0
50,000
Cities with the Most Immigrants from Poland in New York
| City | Poland | vs State | vs National | |
| 1. | New York | 41,653 | 65,102(63.98%)#1 | 408,899(10.19%)#1 |
| 2. | Lindenhurst | 979 | 65,102(1.50%)#2 | 408,899(0.24%)#46 |
| 3. | Yonkers | 906 | 65,102(1.39%)#3 | 408,899(0.22%)#53 |
| 4. | Copiague | 652 | 65,102(1.00%)#4 | 408,899(0.16%)#67 |
| 5. | North Lindenhurst | 558 | 65,102(0.86%)#5 | 408,899(0.14%)#85 |
| 6. | Riverhead | 426 | 65,102(0.65%)#6 | 408,899(0.10%)#104 |
| 7. | Spring Valley | 386 | 65,102(0.59%)#7 | 408,899(0.09%)#119 |
| 8. | East Meadow | 369 | 65,102(0.57%)#8 | 408,899(0.09%)#125 |
| 9. | Huntington Station | 329 | 65,102(0.51%)#9 | 408,899(0.08%)#144 |
| 10. | Syracuse | 284 | 65,102(0.44%)#10 | 408,899(0.07%)#172 |
| 11. | West Babylon | 263 | 65,102(0.40%)#11 | 408,899(0.06%)#183 |
| 12. | White Plains | 252 | 65,102(0.39%)#12 | 408,899(0.06%)#194 |
| 13. | Kings Park | 242 | 65,102(0.37%)#13 | 408,899(0.06%)#203 |
| 14. | Cheektowaga | 237 | 65,102(0.36%)#14 | 408,899(0.06%)#206 |
| 15. | Port Chester | 236 | 65,102(0.36%)#15 | 408,899(0.06%)#210 |
| 16. | Pearl River | 231 | 65,102(0.35%)#16 | 408,899(0.06%)#217 |
| 17. | Mineola | 222 | 65,102(0.34%)#17 | 408,899(0.05%)#228 |
| 18. | Irondequoit | 214 | 65,102(0.33%)#18 | 408,899(0.05%)#235 |
| 19. | Centereach | 212 | 65,102(0.33%)#19 | 408,899(0.05%)#237 |
| 20. | Glen Cove | 209 | 65,102(0.32%)#20 | 408,899(0.05%)#239 |
| 21. | Buffalo | 172 | 65,102(0.26%)#21 | 408,899(0.04%)#289 |
| 22. | Coram | 159 | 65,102(0.24%)#22 | 408,899(0.04%)#313 |
| 23. | Sloatsburg | 159 | 65,102(0.24%)#23 | 408,899(0.04%)#315 |
| 24. | Middle Island | 154 | 65,102(0.24%)#24 | 408,899(0.04%)#322 |
| 25. | North New Hyde Park | 153 | 65,102(0.24%)#25 | 408,899(0.04%)#324 |
| 26. | Holtsville | 152 | 65,102(0.23%)#26 | 408,899(0.04%)#325 |
| 27. | Hicksville | 149 | 65,102(0.23%)#27 | 408,899(0.04%)#333 |
| 28. | North Bellmore | 149 | 65,102(0.23%)#28 | 408,899(0.04%)#334 |
| 29. | Riverside | 147 | 65,102(0.23%)#29 | 408,899(0.04%)#339 |
| 30. | Hartsdale | 140 | 65,102(0.22%)#30 | 408,899(0.03%)#362 |
| 31. | Fairmount | 139 | 65,102(0.21%)#31 | 408,899(0.03%)#364 |
| 32. | Holbrook | 135 | 65,102(0.21%)#32 | 408,899(0.03%)#379 |
| 33. | Old Westbury | 135 | 65,102(0.21%)#33 | 408,899(0.03%)#380 |
| 34. | Valley Stream | 131 | 65,102(0.20%)#34 | 408,899(0.03%)#394 |
| 35. | East Massapequa | 130 | 65,102(0.20%)#35 | 408,899(0.03%)#400 |
| 36. | Croton On Hudson | 129 | 65,102(0.20%)#36 | 408,899(0.03%)#404 |
| 37. | New Rochelle | 128 | 65,102(0.20%)#37 | 408,899(0.03%)#405 |
| 38. | Poughkeepsie | 128 | 65,102(0.20%)#38 | 408,899(0.03%)#407 |
| 39. | Dix Hills | 127 | 65,102(0.20%)#39 | 408,899(0.03%)#413 |
| 40. | New City | 125 | 65,102(0.19%)#40 | 408,899(0.03%)#422 |
| 41. | Manorville | 121 | 65,102(0.19%)#41 | 408,899(0.03%)#438 |
| 42. | Mastic | 118 | 65,102(0.18%)#42 | 408,899(0.03%)#443 |
| 43. | Medford | 115 | 65,102(0.18%)#43 | 408,899(0.03%)#459 |
| 44. | Warwick | 114 | 65,102(0.18%)#44 | 408,899(0.03%)#466 |
| 45. | Hempstead | 110 | 65,102(0.17%)#45 | 408,899(0.03%)#474 |
| 46. | Troy | 110 | 65,102(0.17%)#46 | 408,899(0.03%)#476 |
| 47. | Great Neck Plaza | 108 | 65,102(0.17%)#47 | 408,899(0.03%)#492 |
| 48. | West Islip | 103 | 65,102(0.16%)#48 | 408,899(0.03%)#515 |
| 49. | Rochester | 102 | 65,102(0.16%)#49 | 408,899(0.02%)#519 |
| 50. | Jefferson Valley Yorktown | 102 | 65,102(0.16%)#50 | 408,899(0.02%)#523 |
| 51. | Commack | 101 | 65,102(0.16%)#51 | 408,899(0.02%)#531 |
| 52. | Scotchtown | 99 | 65,102(0.15%)#52 | 408,899(0.02%)#540 |
| 53. | Wading River | 99 | 65,102(0.15%)#53 | 408,899(0.02%)#541 |
| 54. | Oceanside | 98 | 65,102(0.15%)#54 | 408,899(0.02%)#543 |
| 55. | Bay Shore | 90 | 65,102(0.14%)#55 | 408,899(0.02%)#593 |
| 56. | Patchogue | 88 | 65,102(0.14%)#56 | 408,899(0.02%)#605 |
| 57. | Cohoes | 87 | 65,102(0.13%)#57 | 408,899(0.02%)#611 |
| 58. | Utica | 86 | 65,102(0.13%)#58 | 408,899(0.02%)#618 |
| 59. | Elmont | 86 | 65,102(0.13%)#59 | 408,899(0.02%)#620 |
| 60. | Plainview | 86 | 65,102(0.13%)#60 | 408,899(0.02%)#622 |
| 61. | Lynbrook | 86 | 65,102(0.13%)#61 | 408,899(0.02%)#624 |
| 62. | Mount Vernon | 82 | 65,102(0.13%)#62 | 408,899(0.02%)#649 |
| 63. | Levittown | 80 | 65,102(0.12%)#63 | 408,899(0.02%)#661 |
| 64. | Jamesport | 80 | 65,102(0.12%)#64 | 408,899(0.02%)#664 |
| 65. | Amityville | 78 | 65,102(0.12%)#65 | 408,899(0.02%)#677 |
| 66. | Mount Ivy | 77 | 65,102(0.12%)#66 | 408,899(0.02%)#687 |
| 67. | West Hempstead | 75 | 65,102(0.12%)#67 | 408,899(0.02%)#713 |
| 68. | Wyandanch | 75 | 65,102(0.12%)#68 | 408,899(0.02%)#714 |
| 69. | Southold | 74 | 65,102(0.11%)#69 | 408,899(0.02%)#724 |
| 70. | Ossining | 73 | 65,102(0.11%)#70 | 408,899(0.02%)#728 |
| 71. | Brighton | 72 | 65,102(0.11%)#71 | 408,899(0.02%)#737 |
| 72. | Bethpage | 72 | 65,102(0.11%)#72 | 408,899(0.02%)#740 |
| 73. | Hampton Bays | 72 | 65,102(0.11%)#73 | 408,899(0.02%)#741 |
| 74. | Plattsburgh | 69 | 65,102(0.11%)#74 | 408,899(0.02%)#761 |
| 75. | North Babylon | 68 | 65,102(0.10%)#75 | 408,899(0.02%)#772 |
| 76. | Smallwood | 68 | 65,102(0.10%)#76 | 408,899(0.02%)#774 |
| 77. | Sound Beach | 66 | 65,102(0.10%)#77 | 408,899(0.02%)#792 |
| 78. | Port Jefferson | 65 | 65,102(0.10%)#78 | 408,899(0.02%)#799 |
| 79. | Great Neck | 64 | 65,102(0.10%)#79 | 408,899(0.02%)#803 |
| 80. | Oakdale | 64 | 65,102(0.10%)#80 | 408,899(0.02%)#805 |
| 81. | Shirley | 63 | 65,102(0.10%)#81 | 408,899(0.02%)#812 |
| 82. | Greenville Cdp Westchester County | 60 | 65,102(0.09%)#82 | 408,899(0.01%)#840 |
| 83. | Newburgh | 59 | 65,102(0.09%)#83 | 408,899(0.01%)#849 |
| 84. | Saratoga Springs | 58 | 65,102(0.09%)#84 | 408,899(0.01%)#856 |
| 85. | Springs | 58 | 65,102(0.09%)#85 | 408,899(0.01%)#860 |
| 86. | Solvay | 57 | 65,102(0.09%)#86 | 408,899(0.01%)#871 |
| 87. | Barnum Island | 57 | 65,102(0.09%)#87 | 408,899(0.01%)#874 |
| 88. | Smithtown | 56 | 65,102(0.09%)#88 | 408,899(0.01%)#882 |
| 89. | Depew | 56 | 65,102(0.09%)#89 | 408,899(0.01%)#884 |
| 90. | Islandia | 56 | 65,102(0.09%)#90 | 408,899(0.01%)#886 |
| 91. | Franklin Square | 54 | 65,102(0.08%)#91 | 408,899(0.01%)#906 |
| 92. | North Massapequa | 54 | 65,102(0.08%)#92 | 408,899(0.01%)#909 |
| 93. | North Wantagh | 54 | 65,102(0.08%)#93 | 408,899(0.01%)#910 |
| 94. | Viola | 54 | 65,102(0.08%)#94 | 408,899(0.01%)#913 |
| 95. | Putnam Lake | 54 | 65,102(0.08%)#95 | 408,899(0.01%)#915 |
| 96. | Roessleville | 53 | 65,102(0.08%)#96 | 408,899(0.01%)#927 |
| 97. | Ellenville | 52 | 65,102(0.08%)#97 | 408,899(0.01%)#942 |
| 98. | Merrick | 51 | 65,102(0.08%)#98 | 408,899(0.01%)#952 |
| 99. | Huntington | 51 | 65,102(0.08%)#99 | 408,899(0.01%)#953 |
| 100. | Floral Park | 51 | 65,102(0.08%)#100 | 408,899(0.01%)#956 |
Common Questions
What are the Top 10 Cities with the Most Immigrants from Poland in New York?
Top 10 Cities with the Most Immigrants from Poland in New York are:
#1
41,653
#2
979
#3
906
#4
652
#5
558
#6
426
#7
386
#8
369
#9
329
#10
284
What city has the Most Immigrants from Poland in New York?
New York has the Most Immigrants from Poland in New York with 41,653.
What is the Total Immigrants from Poland in the State of New York?
Total Immigrants from Poland in New York is 65,102.
What is the Total Immigrants from Poland in the United States?
Total Immigrants from Poland in the United States is 408,899.