Cities with the Most Immigrants from Poland in Connecticut
RELATED REPORTS & OPTIONS
Poland
Connecticut
Compare Cities
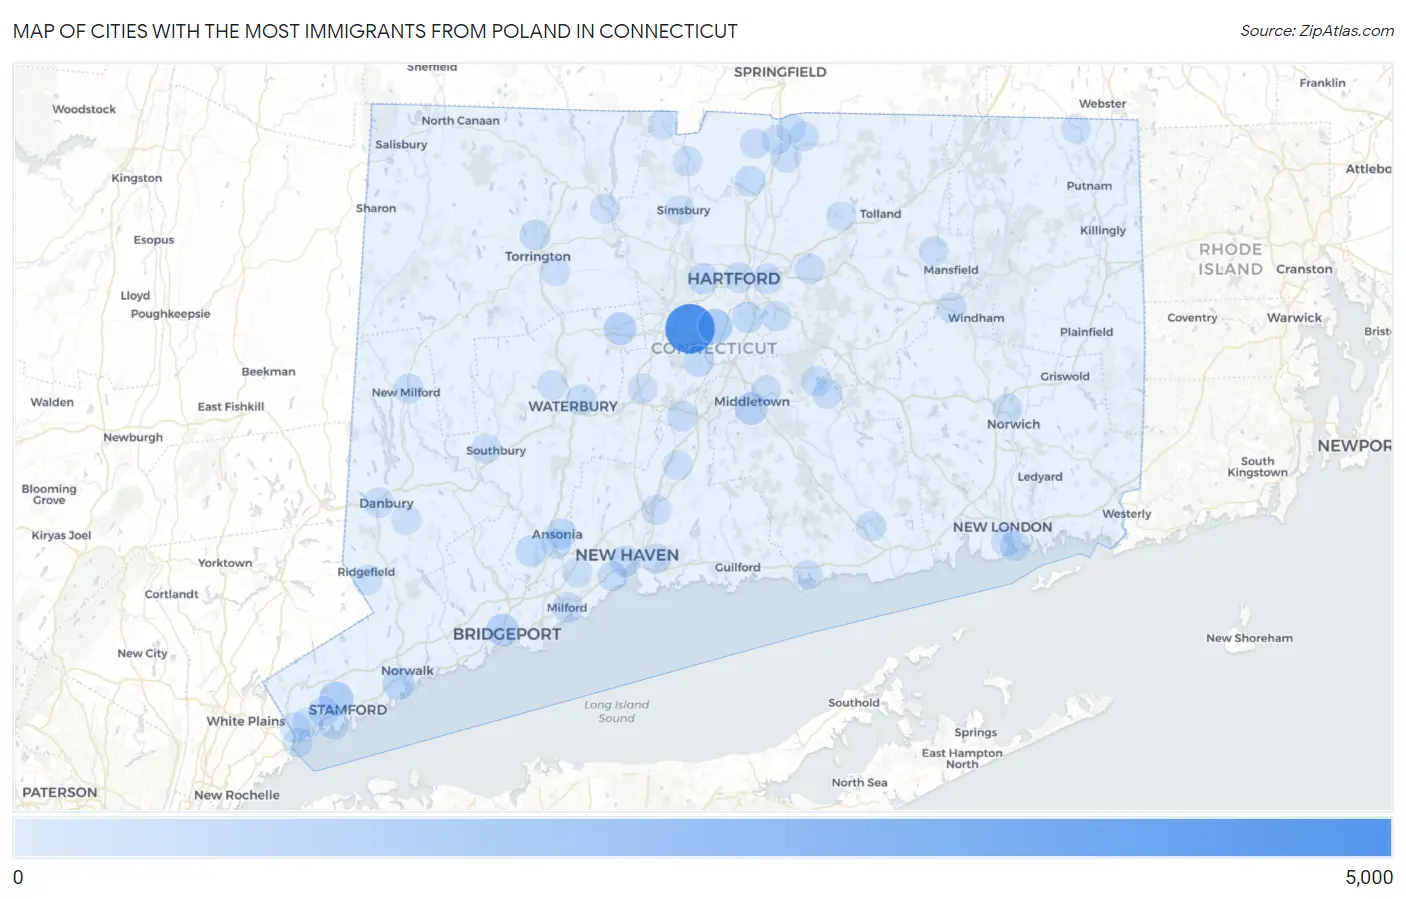
Map of Cities with the Most Immigrants from Poland in Connecticut
0
5,000
Cities with the Most Immigrants from Poland in Connecticut
| City | Poland | vs State | vs National | |
| 1. | New Britain | 4,809 | 21,729(22.13%)#1 | 408,899(1.18%)#3 |
| 2. | Newington | 1,043 | 21,729(4.80%)#2 | 408,899(0.26%)#42 |
| 3. | Stamford | 983 | 21,729(4.52%)#3 | 408,899(0.24%)#45 |
| 4. | Bristol | 651 | 21,729(3.00%)#4 | 408,899(0.16%)#68 |
| 5. | Bridgeport | 634 | 21,729(2.92%)#5 | 408,899(0.16%)#70 |
| 6. | Middletown | 630 | 21,729(2.90%)#6 | 408,899(0.15%)#72 |
| 7. | Norwalk | 573 | 21,729(2.64%)#7 | 408,899(0.14%)#81 |
| 8. | Shelton | 342 | 21,729(1.57%)#8 | 408,899(0.08%)#134 |
| 9. | Wethersfield | 316 | 21,729(1.45%)#9 | 408,899(0.08%)#154 |
| 10. | Kensington | 289 | 21,729(1.33%)#10 | 408,899(0.07%)#169 |
| 11. | West Hartford | 287 | 21,729(1.32%)#11 | 408,899(0.07%)#170 |
| 12. | New Haven | 265 | 21,729(1.22%)#12 | 408,899(0.06%)#181 |
| 13. | Torrington | 222 | 21,729(1.02%)#13 | 408,899(0.05%)#227 |
| 14. | Ansonia | 203 | 21,729(0.93%)#14 | 408,899(0.05%)#249 |
| 15. | Windsor Locks | 203 | 21,729(0.93%)#15 | 408,899(0.05%)#250 |
| 16. | Waterbury | 200 | 21,729(0.92%)#16 | 408,899(0.05%)#253 |
| 17. | Meriden | 196 | 21,729(0.90%)#17 | 408,899(0.05%)#259 |
| 18. | Naugatuck Borough | 158 | 21,729(0.73%)#18 | 408,899(0.04%)#318 |
| 19. | Hartford | 149 | 21,729(0.69%)#19 | 408,899(0.04%)#332 |
| 20. | Milford City Balance | 144 | 21,729(0.66%)#20 | 408,899(0.04%)#348 |
| 21. | Derby | 127 | 21,729(0.58%)#21 | 408,899(0.03%)#414 |
| 22. | Staples | 123 | 21,729(0.57%)#22 | 408,899(0.03%)#433 |
| 23. | East Hartford | 115 | 21,729(0.53%)#23 | 408,899(0.03%)#458 |
| 24. | Southwood Acres | 85 | 21,729(0.39%)#24 | 408,899(0.02%)#635 |
| 25. | East Haven | 84 | 21,729(0.39%)#25 | 408,899(0.02%)#640 |
| 26. | Lake Pocotopaug | 83 | 21,729(0.38%)#26 | 408,899(0.02%)#647 |
| 27. | West Haven | 82 | 21,729(0.38%)#27 | 408,899(0.02%)#650 |
| 28. | Pemberwick | 79 | 21,729(0.36%)#28 | 408,899(0.02%)#670 |
| 29. | New London | 75 | 21,729(0.35%)#29 | 408,899(0.02%)#712 |
| 30. | Danbury | 74 | 21,729(0.34%)#30 | 408,899(0.02%)#716 |
| 31. | Manchester | 74 | 21,729(0.34%)#31 | 408,899(0.02%)#719 |
| 32. | New Milford | 68 | 21,729(0.31%)#32 | 408,899(0.02%)#773 |
| 33. | East Hampton | 61 | 21,729(0.28%)#33 | 408,899(0.01%)#832 |
| 34. | Glastonbury Center | 57 | 21,729(0.26%)#34 | 408,899(0.01%)#869 |
| 35. | Cos Cob | 57 | 21,729(0.26%)#35 | 408,899(0.01%)#870 |
| 36. | Essex Village | 56 | 21,729(0.26%)#36 | 408,899(0.01%)#888 |
| 37. | North Haven | 54 | 21,729(0.25%)#37 | 408,899(0.01%)#907 |
| 38. | Norwich | 52 | 21,729(0.24%)#38 | 408,899(0.01%)#935 |
| 39. | Trumbull Center | 51 | 21,729(0.23%)#39 | 408,899(0.01%)#958 |
| 40. | Hazardville | 50 | 21,729(0.23%)#40 | 408,899(0.01%)#973 |
| 41. | Stepney | 48 | 21,729(0.22%)#41 | 408,899(0.01%)#1,018 |
| 42. | Suffield Depot | 44 | 21,729(0.20%)#42 | 408,899(0.01%)#1,082 |
| 43. | New Canaan | 35 | 21,729(0.16%)#43 | 408,899(0.01%)#1,274 |
| 44. | Salmon Brook | 35 | 21,729(0.16%)#44 | 408,899(0.01%)#1,278 |
| 45. | South Wilton | 35 | 21,729(0.16%)#45 | 408,899(0.01%)#1,280 |
| 46. | Lakes West | 35 | 21,729(0.16%)#46 | 408,899(0.01%)#1,281 |
| 47. | Wallingford Center | 34 | 21,729(0.16%)#47 | 408,899(0.01%)#1,297 |
| 48. | Greenwich | 34 | 21,729(0.16%)#48 | 408,899(0.01%)#1,300 |
| 49. | Daniels Farm | 33 | 21,729(0.15%)#49 | 408,899(0.01%)#1,327 |
| 50. | Tashua | 32 | 21,729(0.15%)#50 | 408,899(0.01%)#1,362 |
| 51. | Plantsville | 31 | 21,729(0.14%)#51 | 408,899(0.01%)#1,391 |
| 52. | Sherwood Manor | 30 | 21,729(0.14%)#52 | 408,899(0.01%)#1,416 |
| 53. | Orange | 28 | 21,729(0.13%)#53 | 408,899(0.01%)#1,469 |
| 54. | Oakville | 28 | 21,729(0.13%)#54 | 408,899(0.01%)#1,476 |
| 55. | Old Greenwich | 28 | 21,729(0.13%)#55 | 408,899(0.01%)#1,477 |
| 56. | Topstone | 28 | 21,729(0.13%)#56 | 408,899(0.01%)#1,491 |
| 57. | Heritage Village | 27 | 21,729(0.12%)#57 | 408,899(0.01%)#1,517 |
| 58. | Noroton Heights | 25 | 21,729(0.12%)#58 | 408,899(0.01%)#1,599 |
| 59. | Knollcrest | 24 | 21,729(0.11%)#59 | 408,899(0.01%)#1,640 |
| 60. | Bethel | 23 | 21,729(0.11%)#60 | 408,899(0.01%)#1,666 |
| 61. | Willimantic | 21 | 21,729(0.10%)#61 | 408,899(0.01%)#1,761 |
| 62. | Ridgefield | 21 | 21,729(0.10%)#62 | 408,899(0.01%)#1,771 |
| 63. | Thompsonville | 19 | 21,729(0.09%)#63 | 408,899(0.00%)#1,873 |
| 64. | New Hartford Center | 19 | 21,729(0.09%)#64 | 408,899(0.00%)#1,889 |
| 65. | Botsford | 17 | 21,729(0.08%)#65 | 408,899(0.00%)#2,009 |
| 66. | Noroton | 15 | 21,729(0.07%)#66 | 408,899(0.00%)#2,126 |
| 67. | Groton | 14 | 21,729(0.06%)#67 | 408,899(0.00%)#2,177 |
| 68. | Byram | 14 | 21,729(0.06%)#68 | 408,899(0.00%)#2,192 |
| 69. | Quinebaug | 12 | 21,729(0.06%)#69 | 408,899(0.00%)#2,319 |
| 70. | Storrs | 11 | 21,729(0.05%)#70 | 408,899(0.00%)#2,358 |
| 71. | North Granby | 11 | 21,729(0.05%)#71 | 408,899(0.00%)#2,408 |
| 72. | Quinnipiac University | 10 | 21,729(0.05%)#72 | 408,899(0.00%)#2,486 |
| 73. | Simsbury Center | 9 | 21,729(0.04%)#73 | 408,899(0.00%)#2,577 |
| 74. | Northwest Harwinton | 8 | 21,729(0.04%)#74 | 408,899(0.00%)#2,683 |
| 75. | Route 7 Gateway | 6 | 21,729(0.03%)#75 | 408,899(0.00%)#2,862 |
| 76. | Portland | 5 | 21,729(0.02%)#76 | 408,899(0.00%)#2,918 |
| 77. | Clinton | 5 | 21,729(0.02%)#77 | 408,899(0.00%)#2,941 |
| 78. | Woodmont Borough | 4 | 21,729(0.02%)#78 | 408,899(0.00%)#3,032 |
| 79. | Rockville | 2 | 21,729(0.01%)#79 | 408,899(0.00%)#3,153 |
1
2Common Questions
What are the Top 10 Cities with the Most Immigrants from Poland in Connecticut?
Top 10 Cities with the Most Immigrants from Poland in Connecticut are:
#1
4,809
#2
1,043
#3
983
#4
651
#5
634
#6
630
#7
573
#8
342
#9
316
#10
289
What city has the Most Immigrants from Poland in Connecticut?
New Britain has the Most Immigrants from Poland in Connecticut with 4,809.
What is the Total Immigrants from Poland in the State of Connecticut?
Total Immigrants from Poland in Connecticut is 21,729.
What is the Total Immigrants from Poland in the United States?
Total Immigrants from Poland in the United States is 408,899.