Cities with the Most Immigrants from Colombia in New Jersey
RELATED REPORTS & OPTIONS
Colombia
New Jersey
Compare Cities
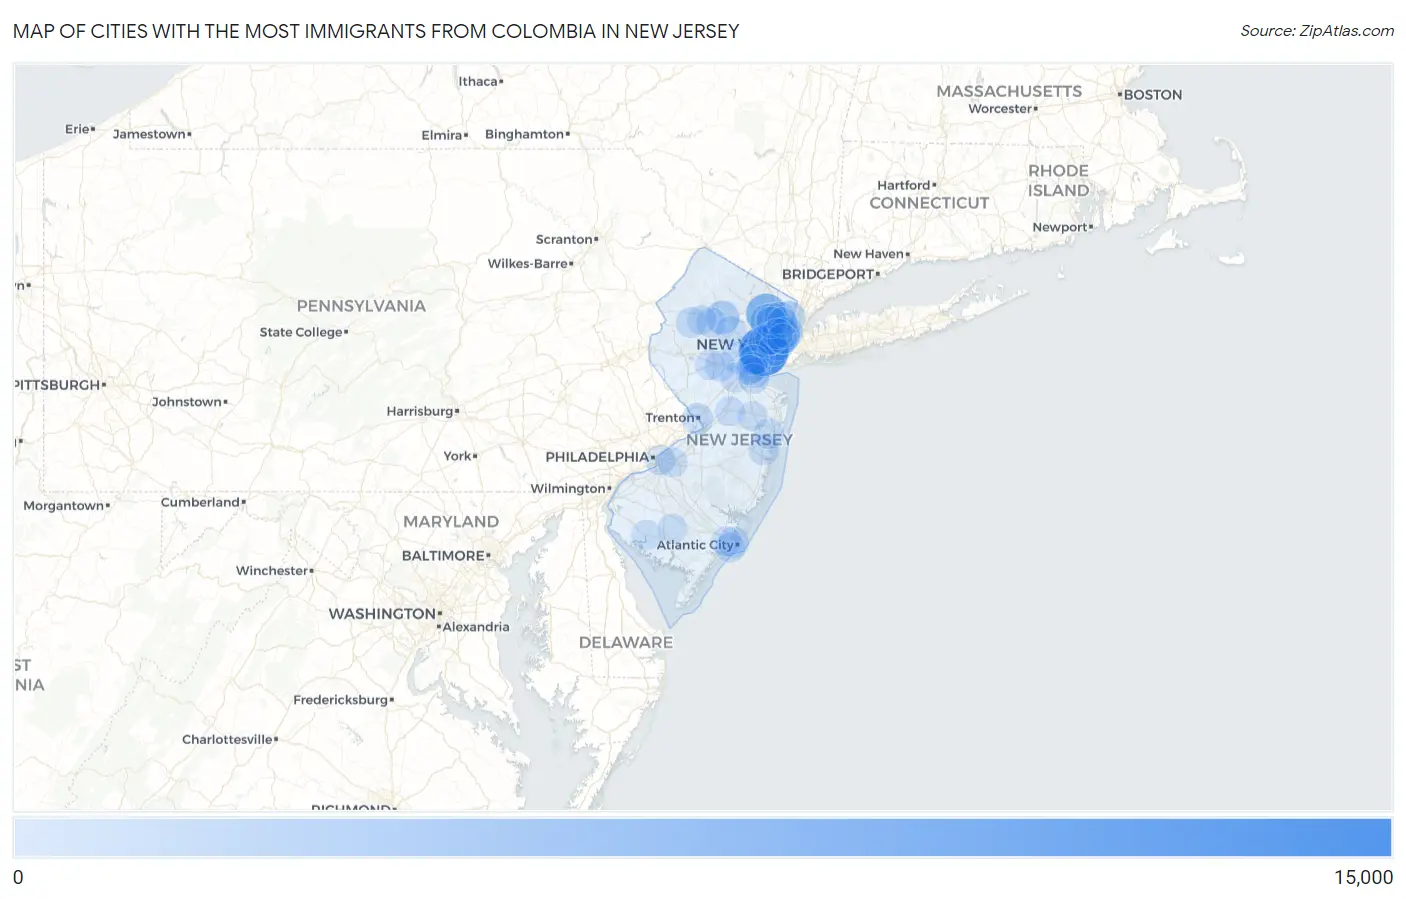
Map of Cities with the Most Immigrants from Colombia in New Jersey
0
15,000
Cities with the Most Immigrants from Colombia in New Jersey
| City | Colombia | vs State | vs National | |
| 1. | Elizabeth | 10,463 | 90,817(11.52%)#1 | 860,787(1.22%)#4 |
| 2. | Paterson | 5,432 | 90,817(5.98%)#2 | 860,787(0.63%)#13 |
| 3. | West New York | 2,693 | 90,817(2.97%)#3 | 860,787(0.31%)#39 |
| 4. | Union City | 2,589 | 90,817(2.85%)#4 | 860,787(0.30%)#41 |
| 5. | Clifton | 2,463 | 90,817(2.71%)#5 | 860,787(0.29%)#42 |
| 6. | Dover | 2,048 | 90,817(2.26%)#6 | 860,787(0.24%)#52 |
| 7. | Jersey City | 1,828 | 90,817(2.01%)#7 | 860,787(0.21%)#57 |
| 8. | Linden | 1,732 | 90,817(1.91%)#8 | 860,787(0.20%)#63 |
| 9. | Englewood | 1,719 | 90,817(1.89%)#9 | 860,787(0.20%)#64 |
| 10. | Lodi Borough | 1,523 | 90,817(1.68%)#10 | 860,787(0.18%)#73 |
| 11. | Harrison | 1,337 | 90,817(1.47%)#11 | 860,787(0.16%)#90 |
| 12. | Newark | 1,217 | 90,817(1.34%)#12 | 860,787(0.14%)#92 |
| 13. | Bergenfield Borough | 1,182 | 90,817(1.30%)#13 | 860,787(0.14%)#93 |
| 14. | North Plainfield Borough | 1,059 | 90,817(1.17%)#14 | 860,787(0.12%)#104 |
| 15. | Bayonne | 924 | 90,817(1.02%)#15 | 860,787(0.11%)#122 |
| 16. | Wharton Borough | 922 | 90,817(1.02%)#16 | 860,787(0.11%)#124 |
| 17. | Kearny | 903 | 90,817(0.99%)#17 | 860,787(0.10%)#128 |
| 18. | Garfield | 884 | 90,817(0.97%)#18 | 860,787(0.10%)#131 |
| 19. | Trenton | 837 | 90,817(0.92%)#19 | 860,787(0.10%)#145 |
| 20. | Hackensack | 827 | 90,817(0.91%)#20 | 860,787(0.10%)#151 |
| 21. | Passaic | 807 | 90,817(0.89%)#21 | 860,787(0.09%)#155 |
| 22. | Dunellen Borough | 804 | 90,817(0.89%)#22 | 860,787(0.09%)#156 |
| 23. | Roselle Borough | 795 | 90,817(0.88%)#23 | 860,787(0.09%)#159 |
| 24. | Plainfield | 774 | 90,817(0.85%)#24 | 860,787(0.09%)#161 |
| 25. | Fort Lee Borough | 602 | 90,817(0.66%)#25 | 860,787(0.07%)#197 |
| 26. | Rutherford Borough | 587 | 90,817(0.65%)#26 | 860,787(0.07%)#201 |
| 27. | Dumont Borough | 559 | 90,817(0.62%)#27 | 860,787(0.06%)#213 |
| 28. | Madison Borough | 558 | 90,817(0.61%)#28 | 860,787(0.06%)#214 |
| 29. | Moonachie Borough | 553 | 90,817(0.61%)#29 | 860,787(0.06%)#217 |
| 30. | Atlantic City | 517 | 90,817(0.57%)#30 | 860,787(0.06%)#227 |
| 31. | Roselle Park Borough | 498 | 90,817(0.55%)#31 | 860,787(0.06%)#231 |
| 32. | Victory Gardens Borough | 463 | 90,817(0.51%)#32 | 860,787(0.05%)#250 |
| 33. | Guttenberg | 461 | 90,817(0.51%)#33 | 860,787(0.05%)#252 |
| 34. | Carteret Borough | 444 | 90,817(0.49%)#34 | 860,787(0.05%)#257 |
| 35. | Bound Brook Borough | 444 | 90,817(0.49%)#35 | 860,787(0.05%)#258 |
| 36. | Palisades Park Borough | 430 | 90,817(0.47%)#36 | 860,787(0.05%)#271 |
| 37. | Elmwood Park Borough | 423 | 90,817(0.47%)#37 | 860,787(0.05%)#276 |
| 38. | Perth Amboy | 416 | 90,817(0.46%)#38 | 860,787(0.05%)#285 |
| 39. | Toms River | 413 | 90,817(0.45%)#39 | 860,787(0.05%)#287 |
| 40. | Morristown | 400 | 90,817(0.44%)#40 | 860,787(0.05%)#296 |
| 41. | Ridgefield Park | 380 | 90,817(0.42%)#41 | 860,787(0.04%)#314 |
| 42. | Totowa Borough | 376 | 90,817(0.41%)#42 | 860,787(0.04%)#315 |
| 43. | Bogota Borough | 358 | 90,817(0.39%)#43 | 860,787(0.04%)#328 |
| 44. | Hackettstown | 357 | 90,817(0.39%)#44 | 860,787(0.04%)#329 |
| 45. | North Arlington Borough | 355 | 90,817(0.39%)#45 | 860,787(0.04%)#333 |
| 46. | Fairview Borough | 354 | 90,817(0.39%)#46 | 860,787(0.04%)#336 |
| 47. | Middlesex Borough | 352 | 90,817(0.39%)#47 | 860,787(0.04%)#337 |
| 48. | Secaucus | 325 | 90,817(0.36%)#48 | 860,787(0.04%)#365 |
| 49. | Camden | 321 | 90,817(0.35%)#49 | 860,787(0.04%)#374 |
| 50. | Ridgefield Borough | 321 | 90,817(0.35%)#50 | 860,787(0.04%)#378 |
| 51. | South Plainfield Borough | 317 | 90,817(0.35%)#51 | 860,787(0.04%)#383 |
| 52. | Hamburg Borough | 308 | 90,817(0.34%)#52 | 860,787(0.04%)#395 |
| 53. | Preakness | 307 | 90,817(0.34%)#53 | 860,787(0.04%)#396 |
| 54. | Parsippany | 306 | 90,817(0.34%)#54 | 860,787(0.04%)#397 |
| 55. | Ramtown | 305 | 90,817(0.34%)#55 | 860,787(0.04%)#399 |
| 56. | Finderne | 297 | 90,817(0.33%)#56 | 860,787(0.03%)#407 |
| 57. | Woodbridge | 295 | 90,817(0.32%)#57 | 860,787(0.03%)#408 |
| 58. | Paramus Borough | 293 | 90,817(0.32%)#58 | 860,787(0.03%)#410 |
| 59. | Little Ferry Borough | 276 | 90,817(0.30%)#59 | 860,787(0.03%)#437 |
| 60. | Somerville Borough | 259 | 90,817(0.29%)#60 | 860,787(0.03%)#461 |
| 61. | Succasunna | 245 | 90,817(0.27%)#61 | 860,787(0.03%)#484 |
| 62. | New Brunswick | 235 | 90,817(0.26%)#62 | 860,787(0.03%)#500 |
| 63. | Fair Lawn Borough | 234 | 90,817(0.26%)#63 | 860,787(0.03%)#503 |
| 64. | Cliffside Park Borough | 229 | 90,817(0.25%)#64 | 860,787(0.03%)#509 |
| 65. | Hawthorne Borough | 220 | 90,817(0.24%)#65 | 860,787(0.03%)#524 |
| 66. | New Milford Borough | 219 | 90,817(0.24%)#66 | 860,787(0.03%)#525 |
| 67. | Wood Ridge Borough | 211 | 90,817(0.23%)#67 | 860,787(0.02%)#544 |
| 68. | Raritan Borough | 206 | 90,817(0.23%)#68 | 860,787(0.02%)#550 |
| 69. | Kingston Estates | 197 | 90,817(0.22%)#69 | 860,787(0.02%)#573 |
| 70. | Mount Arlington Borough | 189 | 90,817(0.21%)#70 | 860,787(0.02%)#588 |
| 71. | Pleasantville | 187 | 90,817(0.21%)#71 | 860,787(0.02%)#594 |
| 72. | Bridgeton | 186 | 90,817(0.20%)#72 | 860,787(0.02%)#595 |
| 73. | Hasbrouck Heights Borough | 186 | 90,817(0.20%)#73 | 860,787(0.02%)#596 |
| 74. | Keyport Borough | 186 | 90,817(0.20%)#74 | 860,787(0.02%)#597 |
| 75. | Hopatcong Borough | 183 | 90,817(0.20%)#75 | 860,787(0.02%)#609 |
| 76. | Hightstown Borough | 176 | 90,817(0.19%)#76 | 860,787(0.02%)#631 |
| 77. | Leonia Borough | 174 | 90,817(0.19%)#77 | 860,787(0.02%)#639 |
| 78. | Lake Hiawatha | 169 | 90,817(0.19%)#78 | 860,787(0.02%)#660 |
| 79. | Vineland | 161 | 90,817(0.18%)#79 | 860,787(0.02%)#683 |
| 80. | North Haledon Borough | 160 | 90,817(0.18%)#80 | 860,787(0.02%)#693 |
| 81. | Cresskill Borough | 157 | 90,817(0.17%)#81 | 860,787(0.02%)#701 |
| 82. | Bradley Gardens | 144 | 90,817(0.16%)#82 | 860,787(0.02%)#752 |
| 83. | Ventnor City | 141 | 90,817(0.16%)#83 | 860,787(0.02%)#765 |
| 84. | Hoboken | 140 | 90,817(0.15%)#84 | 860,787(0.02%)#768 |
| 85. | Maywood Borough | 139 | 90,817(0.15%)#85 | 860,787(0.02%)#778 |
| 86. | Prospect Park Borough | 134 | 90,817(0.15%)#86 | 860,787(0.02%)#806 |
| 87. | Hillsborough | 127 | 90,817(0.14%)#87 | 860,787(0.01%)#835 |
| 88. | Flanders | 127 | 90,817(0.14%)#88 | 860,787(0.01%)#836 |
| 89. | Montvale Borough | 127 | 90,817(0.14%)#89 | 860,787(0.01%)#837 |
| 90. | Rahway | 124 | 90,817(0.14%)#90 | 860,787(0.01%)#853 |
| 91. | Budd Lake | 121 | 90,817(0.13%)#91 | 860,787(0.01%)#867 |
| 92. | Sayreville Borough | 119 | 90,817(0.13%)#92 | 860,787(0.01%)#878 |
| 93. | Twin Rivers | 114 | 90,817(0.13%)#93 | 860,787(0.01%)#907 |
| 94. | Franklin Lakes Borough | 111 | 90,817(0.12%)#94 | 860,787(0.01%)#935 |
| 95. | South Amboy | 111 | 90,817(0.12%)#95 | 860,787(0.01%)#936 |
| 96. | Fords | 110 | 90,817(0.12%)#96 | 860,787(0.01%)#944 |
| 97. | West Freehold | 109 | 90,817(0.12%)#97 | 860,787(0.01%)#951 |
| 98. | Oakland Borough | 109 | 90,817(0.12%)#98 | 860,787(0.01%)#952 |
| 99. | Manville Borough | 109 | 90,817(0.12%)#99 | 860,787(0.01%)#953 |
| 100. | Haledon Borough | 108 | 90,817(0.12%)#100 | 860,787(0.01%)#960 |
Common Questions
What are the Top 10 Cities with the Most Immigrants from Colombia in New Jersey?
Top 10 Cities with the Most Immigrants from Colombia in New Jersey are:
#1
10,463
#2
5,432
#3
2,693
#4
2,589
#5
2,463
#6
2,048
#7
1,828
#8
1,732
#9
1,719
#10
1,337
What city has the Most Immigrants from Colombia in New Jersey?
Elizabeth has the Most Immigrants from Colombia in New Jersey with 10,463.
What is the Total Immigrants from Colombia in the State of New Jersey?
Total Immigrants from Colombia in New Jersey is 90,817.
What is the Total Immigrants from Colombia in the United States?
Total Immigrants from Colombia in the United States is 860,787.