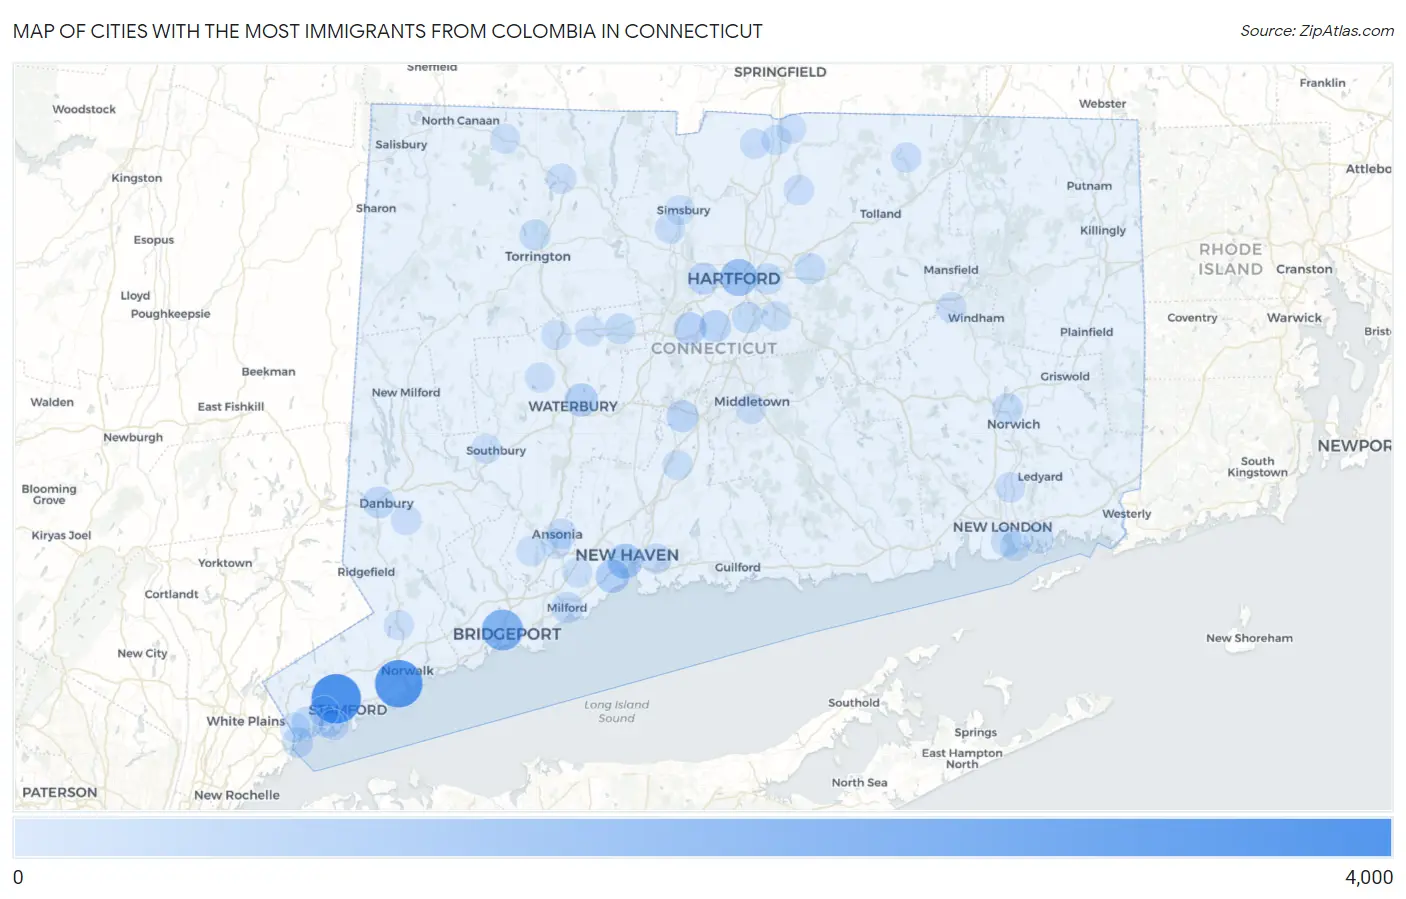
Cities with the Most Immigrants from Colombia in Connecticut
RELATED REPORTS & OPTIONS
Colombia
Connecticut
Compare Cities
Map of Cities with the Most Immigrants from Colombia in Connecticut
0
4,000
Cities with the Most Immigrants from Colombia in Connecticut
| City | Colombia | vs State | vs National | |
| 1. | Stamford | 3,011 | 18,124(16.61%)#1 | 860,787(0.35%)#32 |
| 2. | Norwalk | 2,703 | 18,124(14.91%)#2 | 860,787(0.31%)#38 |
| 3. | Bridgeport | 1,671 | 18,124(9.22%)#3 | 860,787(0.19%)#66 |
| 4. | Hartford | 1,050 | 18,124(5.79%)#4 | 860,787(0.12%)#105 |
| 5. | New Haven | 749 | 18,124(4.13%)#5 | 860,787(0.09%)#164 |
| 6. | West Haven | 544 | 18,124(3.00%)#6 | 860,787(0.06%)#221 |
| 7. | Waterbury | 479 | 18,124(2.64%)#7 | 860,787(0.06%)#239 |
| 8. | New Britain | 417 | 18,124(2.30%)#8 | 860,787(0.05%)#282 |
| 9. | Newington | 312 | 18,124(1.72%)#9 | 860,787(0.04%)#390 |
| 10. | Meriden | 311 | 18,124(1.72%)#10 | 860,787(0.04%)#391 |
| 11. | West Hartford | 294 | 18,124(1.62%)#11 | 860,787(0.03%)#409 |
| 12. | Naugatuck Borough | 276 | 18,124(1.52%)#12 | 860,787(0.03%)#436 |
| 13. | Danbury | 264 | 18,124(1.46%)#13 | 860,787(0.03%)#454 |
| 14. | Greenwich | 264 | 18,124(1.46%)#14 | 860,787(0.03%)#455 |
| 15. | Milford City Balance | 210 | 18,124(1.16%)#15 | 860,787(0.02%)#546 |
| 16. | East Hartford | 198 | 18,124(1.09%)#16 | 860,787(0.02%)#568 |
| 17. | Wethersfield | 183 | 18,124(1.01%)#17 | 860,787(0.02%)#607 |
| 18. | Manchester | 173 | 18,124(0.95%)#18 | 860,787(0.02%)#643 |
| 19. | Bristol | 169 | 18,124(0.93%)#19 | 860,787(0.02%)#657 |
| 20. | Torrington | 167 | 18,124(0.92%)#20 | 860,787(0.02%)#663 |
| 21. | Norwich | 139 | 18,124(0.77%)#21 | 860,787(0.02%)#776 |
| 22. | Byram | 137 | 18,124(0.76%)#22 | 860,787(0.02%)#791 |
| 23. | New London | 123 | 18,124(0.68%)#23 | 860,787(0.01%)#859 |
| 24. | East Haven | 101 | 18,124(0.56%)#24 | 860,787(0.01%)#1,000 |
| 25. | Staples | 90 | 18,124(0.50%)#25 | 860,787(0.01%)#1,094 |
| 26. | Riverside | 75 | 18,124(0.41%)#26 | 860,787(0.01%)#1,240 |
| 27. | Ansonia | 71 | 18,124(0.39%)#27 | 860,787(0.01%)#1,288 |
| 28. | Broad Brook | 65 | 18,124(0.36%)#28 | 860,787(0.01%)#1,353 |
| 29. | Trumbull Center | 59 | 18,124(0.33%)#29 | 860,787(0.01%)#1,446 |
| 30. | Old Greenwich | 58 | 18,124(0.32%)#30 | 860,787(0.01%)#1,462 |
| 31. | Cos Cob | 55 | 18,124(0.30%)#31 | 860,787(0.01%)#1,505 |
| 32. | Middletown | 50 | 18,124(0.28%)#32 | 860,787(0.01%)#1,578 |
| 33. | Derby | 50 | 18,124(0.28%)#33 | 860,787(0.01%)#1,588 |
| 34. | Winsted | 47 | 18,124(0.26%)#34 | 860,787(0.01%)#1,652 |
| 35. | Bethel | 46 | 18,124(0.25%)#35 | 860,787(0.01%)#1,675 |
| 36. | Suffield Depot | 46 | 18,124(0.25%)#36 | 860,787(0.01%)#1,683 |
| 37. | Wallingford Center | 40 | 18,124(0.22%)#37 | 860,787(0.00%)#1,803 |
| 38. | Noroton | 39 | 18,124(0.22%)#38 | 860,787(0.00%)#1,830 |
| 39. | Noroton Heights | 38 | 18,124(0.21%)#39 | 860,787(0.00%)#1,857 |
| 40. | Thompsonville | 34 | 18,124(0.19%)#40 | 860,787(0.00%)#1,991 |
| 41. | Weatogue | 34 | 18,124(0.19%)#41 | 860,787(0.00%)#1,999 |
| 42. | Gales Ferry | 32 | 18,124(0.18%)#42 | 860,787(0.00%)#2,074 |
| 43. | Lakes East | 28 | 18,124(0.15%)#43 | 860,787(0.00%)#2,229 |
| 44. | Glastonbury Center | 27 | 18,124(0.15%)#44 | 860,787(0.00%)#2,249 |
| 45. | Stafford Springs | 26 | 18,124(0.14%)#45 | 860,787(0.00%)#2,289 |
| 46. | Newtown Borough | 25 | 18,124(0.14%)#46 | 860,787(0.00%)#2,329 |
| 47. | Shelton | 24 | 18,124(0.13%)#47 | 860,787(0.00%)#2,338 |
| 48. | Pemberwick | 22 | 18,124(0.12%)#48 | 860,787(0.00%)#2,462 |
| 49. | Greens Farms | 22 | 18,124(0.12%)#49 | 860,787(0.00%)#2,463 |
| 50. | Terryville | 20 | 18,124(0.11%)#50 | 860,787(0.00%)#2,564 |
| 51. | Cornwall | 20 | 18,124(0.11%)#51 | 860,787(0.00%)#2,574 |
| 52. | Lordship | 19 | 18,124(0.10%)#52 | 860,787(0.00%)#2,606 |
| 53. | Wilton Center | 17 | 18,124(0.09%)#53 | 860,787(0.00%)#2,738 |
| 54. | Watertown | 16 | 18,124(0.09%)#54 | 860,787(0.00%)#2,796 |
| 55. | Orange | 15 | 18,124(0.08%)#55 | 860,787(0.00%)#2,848 |
| 56. | Sandy Hook | 12 | 18,124(0.07%)#56 | 860,787(0.00%)#3,057 |
| 57. | Heritage Village | 12 | 18,124(0.07%)#57 | 860,787(0.00%)#3,071 |
| 58. | Taylor Corners | 12 | 18,124(0.07%)#58 | 860,787(0.00%)#3,097 |
| 59. | Simsbury Center | 11 | 18,124(0.06%)#59 | 860,787(0.00%)#3,144 |
| 60. | Norfolk | 11 | 18,124(0.06%)#60 | 860,787(0.00%)#3,177 |
| 61. | Oronoque | 8 | 18,124(0.04%)#61 | 860,787(0.00%)#3,436 |
| 62. | Thomaston | 7 | 18,124(0.04%)#62 | 860,787(0.00%)#3,542 |
| 63. | Mill Plain | 6 | 18,124(0.03%)#63 | 860,787(0.00%)#3,629 |
| 64. | Bantam Borough | 6 | 18,124(0.03%)#64 | 860,787(0.00%)#3,644 |
| 65. | Bridgewater | 6 | 18,124(0.03%)#65 | 860,787(0.00%)#3,650 |
| 66. | Willimantic | 5 | 18,124(0.03%)#66 | 860,787(0.00%)#3,668 |
| 67. | Poquonock Bridge | 5 | 18,124(0.03%)#67 | 860,787(0.00%)#3,729 |
| 68. | South Wilton | 4 | 18,124(0.02%)#68 | 860,787(0.00%)#3,810 |
| 69. | Groton | 3 | 18,124(0.02%)#69 | 860,787(0.00%)#3,849 |
| 70. | Daniels Farm | 3 | 18,124(0.02%)#70 | 860,787(0.00%)#3,852 |
| 71. | Woodmont Borough | 2 | 18,124(0.01%)#71 | 860,787(0.00%)#3,941 |
| 72. | Mamanasco Lake | 2 | 18,124(0.01%)#72 | 860,787(0.00%)#3,977 |
| 73. | Sherwood Manor | 1 | 18,124(0.01%)#73 | 860,787(0.00%)#4,021 |
1
2Common Questions
What are the Top 10 Cities with the Most Immigrants from Colombia in Connecticut?
Top 10 Cities with the Most Immigrants from Colombia in Connecticut are:
#1
3,011
#2
2,703
#3
1,671
#4
1,050
#5
749
#6
544
#7
479
#8
417
#9
312
#10
311
What city has the Most Immigrants from Colombia in Connecticut?
Stamford has the Most Immigrants from Colombia in Connecticut with 3,011.
What is the Total Immigrants from Colombia in the State of Connecticut?
Total Immigrants from Colombia in Connecticut is 18,124.
What is the Total Immigrants from Colombia in the United States?
Total Immigrants from Colombia in the United States is 860,787.