Cities with the Highest Percentage of Scandinavian Population in Ohio
RELATED REPORTS & OPTIONS
Scandinavian
Ohio
Compare Cities
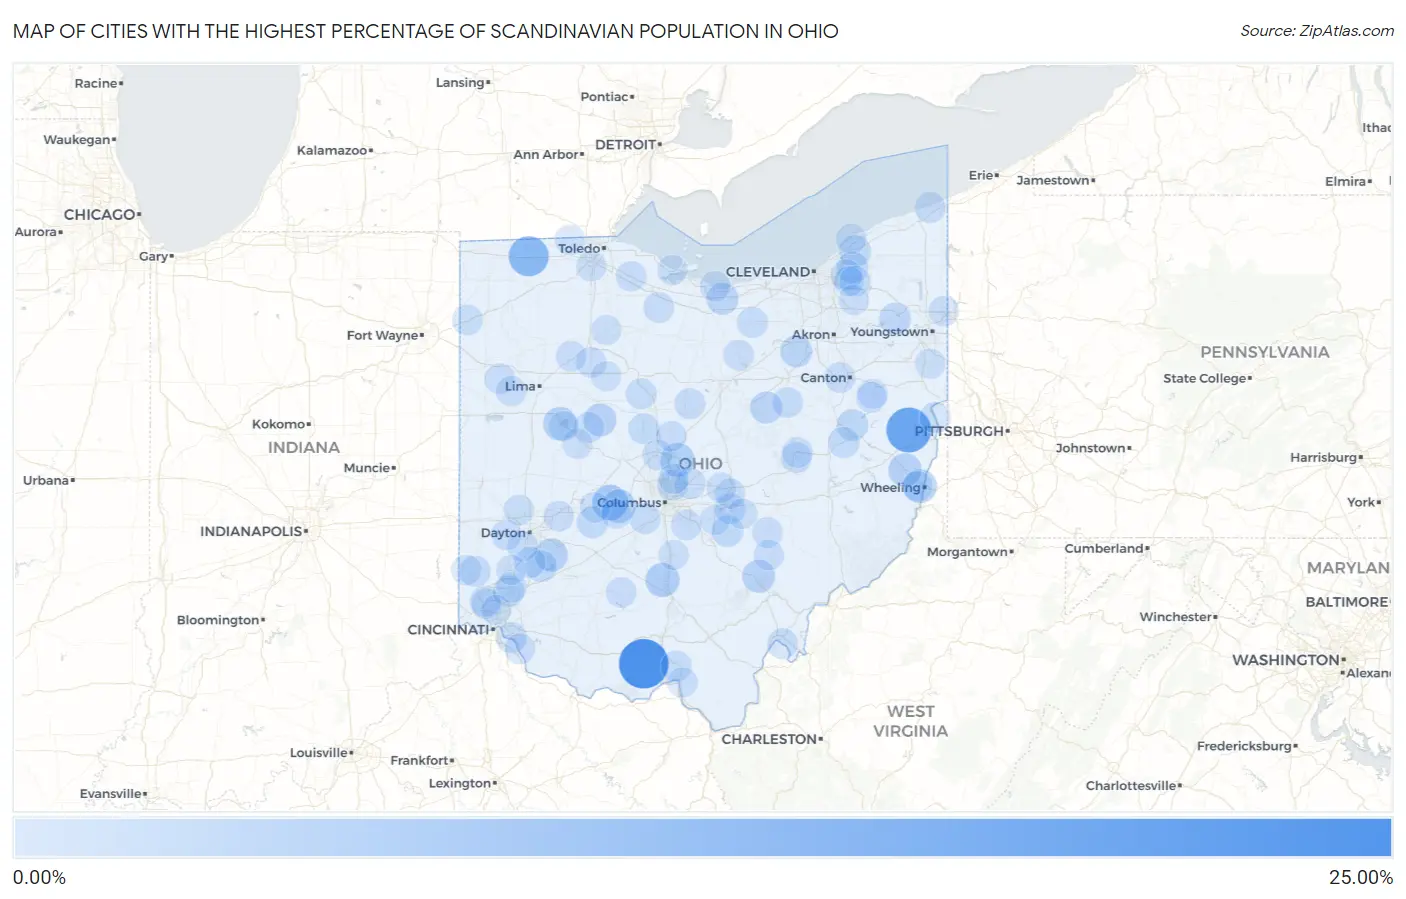
Map of Cities with the Highest Percentage of Scandinavian Population in Ohio
0.00%
25.00%
Cities with the Highest Percentage of Scandinavian Population in Ohio
| City | Scandinavian | vs State | vs National | |
| 1. | Otway | 22.67% | 0.20%(+22.5)#1 | 0.30%(+22.4)#27 |
| 2. | East Springfield | 17.12% | 0.20%(+16.9)#2 | 0.30%(+16.8)#51 |
| 3. | Tedrow | 11.60% | 0.20%(+11.4)#3 | 0.30%(+11.3)#92 |
| 4. | Choctaw Lake | 6.42% | 0.20%(+6.22)#4 | 0.30%(+6.12)#230 |
| 5. | Petersburg | 5.31% | 0.20%(+5.11)#5 | 0.30%(+5.01)#314 |
| 6. | Andersonville | 4.85% | 0.20%(+4.65)#6 | 0.30%(+4.55)#357 |
| 7. | Sunbury | 4.76% | 0.20%(+4.56)#7 | 0.30%(+4.46)#364 |
| 8. | Brookside | 4.66% | 0.20%(+4.46)#8 | 0.30%(+4.36)#377 |
| 9. | Lafayette | 4.51% | 0.20%(+4.31)#9 | 0.30%(+4.21)#393 |
| 10. | Lakeview | 4.39% | 0.20%(+4.18)#10 | 0.30%(+4.08)#415 |
| 11. | Harrisville | 3.97% | 0.20%(+3.77)#11 | 0.30%(+3.67)#486 |
| 12. | Spring Valley | 3.96% | 0.20%(+3.76)#12 | 0.30%(+3.66)#489 |
| 13. | Buchtel | 3.65% | 0.20%(+3.45)#13 | 0.30%(+3.35)#556 |
| 14. | Ridgeway | 3.44% | 0.20%(+3.24)#14 | 0.30%(+3.13)#606 |
| 15. | Nashville | 2.85% | 0.20%(+2.65)#15 | 0.30%(+2.54)#798 |
| 16. | Sterling | 2.78% | 0.20%(+2.58)#16 | 0.30%(+2.47)#834 |
| 17. | Berlin Heights | 2.74% | 0.20%(+2.53)#17 | 0.30%(+2.43)#858 |
| 18. | Newton Falls | 2.52% | 0.20%(+2.32)#18 | 0.30%(+2.22)#961 |
| 19. | Kirtland Hills | 2.51% | 0.20%(+2.31)#19 | 0.30%(+2.20)#963 |
| 20. | Roswell | 2.30% | 0.20%(+2.10)#20 | 0.30%(+2.00)#1,077 |
| 21. | Chesterland | 2.16% | 0.20%(+1.96)#21 | 0.30%(+1.86)#1,179 |
| 22. | West Rushville | 2.16% | 0.20%(+1.96)#22 | 0.30%(+1.85)#1,181 |
| 23. | Waynesville | 2.07% | 0.20%(+1.87)#23 | 0.30%(+1.76)#1,260 |
| 24. | South Charleston | 2.07% | 0.20%(+1.86)#24 | 0.30%(+1.76)#1,262 |
| 25. | Five Points | 1.82% | 0.20%(+1.61)#25 | 0.30%(+1.51)#1,477 |
| 26. | Prospect | 1.82% | 0.20%(+1.61)#26 | 0.30%(+1.51)#1,478 |
| 27. | Nankin | 1.76% | 0.20%(+1.56)#27 | 0.30%(+1.46)#1,539 |
| 28. | Hunting Valley | 1.75% | 0.20%(+1.55)#28 | 0.30%(+1.45)#1,553 |
| 29. | Darrtown | 1.62% | 0.20%(+1.42)#29 | 0.30%(+1.32)#1,704 |
| 30. | Gnadenhutten | 1.59% | 0.20%(+1.39)#30 | 0.30%(+1.29)#1,747 |
| 31. | Stratton | 1.56% | 0.20%(+1.36)#31 | 0.30%(+1.25)#1,782 |
| 32. | Wetherington | 1.54% | 0.20%(+1.33)#32 | 0.30%(+1.23)#1,808 |
| 33. | Clarktown | 1.51% | 0.20%(+1.30)#33 | 0.30%(+1.20)#1,849 |
| 34. | Darbydale | 1.46% | 0.20%(+1.26)#34 | 0.30%(+1.15)#1,900 |
| 35. | Thornport | 1.44% | 0.20%(+1.24)#35 | 0.30%(+1.14)#1,929 |
| 36. | Candlewood Lake | 1.35% | 0.20%(+1.15)#36 | 0.30%(+1.05)#2,060 |
| 37. | Wellington | 1.34% | 0.20%(+1.14)#37 | 0.30%(+1.03)#2,101 |
| 38. | Coldstream | 1.33% | 0.20%(+1.13)#38 | 0.30%(+1.03)#2,112 |
| 39. | Syracuse | 1.33% | 0.20%(+1.13)#39 | 0.30%(+1.03)#2,113 |
| 40. | Morral | 1.31% | 0.20%(+1.11)#40 | 0.30%(+1.01)#2,157 |
| 41. | North Kingsville | 1.31% | 0.20%(+1.11)#41 | 0.30%(+1.01)#2,159 |
| 42. | Minerva Park | 1.27% | 0.20%(+1.07)#42 | 0.30%(+0.963)#2,235 |
| 43. | South Russell | 1.24% | 0.20%(+1.03)#43 | 0.30%(+0.931)#2,311 |
| 44. | Green Springs | 1.22% | 0.20%(+1.02)#44 | 0.30%(+0.918)#2,333 |
| 45. | Pleasant Run | 1.20% | 0.20%(+0.997)#45 | 0.30%(+0.894)#2,381 |
| 46. | Holmesville | 1.19% | 0.20%(+0.989)#46 | 0.30%(+0.886)#2,400 |
| 47. | Rushsylvania | 1.17% | 0.20%(+0.973)#47 | 0.30%(+0.870)#2,438 |
| 48. | Venedocia | 1.16% | 0.20%(+0.955)#48 | 0.30%(+0.852)#2,470 |
| 49. | Lake Mohawk | 1.15% | 0.20%(+0.952)#49 | 0.30%(+0.849)#2,480 |
| 50. | New Albany | 1.14% | 0.20%(+0.940)#50 | 0.30%(+0.837)#2,502 |
| 51. | Greenfield | 1.13% | 0.20%(+0.932)#51 | 0.30%(+0.829)#2,519 |
| 52. | Coshocton | 1.13% | 0.20%(+0.930)#52 | 0.30%(+0.827)#2,527 |
| 53. | Crooksville | 1.13% | 0.20%(+0.924)#53 | 0.30%(+0.821)#2,541 |
| 54. | West Carrollton | 1.12% | 0.20%(+0.917)#54 | 0.30%(+0.814)#2,558 |
| 55. | Antwerp | 1.10% | 0.20%(+0.903)#55 | 0.30%(+0.800)#2,602 |
| 56. | Corning | 1.05% | 0.20%(+0.854)#56 | 0.30%(+0.751)#2,713 |
| 57. | Arlington | 1.05% | 0.20%(+0.853)#57 | 0.30%(+0.750)#2,715 |
| 58. | Mount Cory | 1.05% | 0.20%(+0.851)#58 | 0.30%(+0.748)#2,721 |
| 59. | Canal Lewisville | 1.05% | 0.20%(+0.850)#59 | 0.30%(+0.747)#2,723 |
| 60. | New Lebanon | 1.04% | 0.20%(+0.840)#60 | 0.30%(+0.737)#2,749 |
| 61. | Enon | 1.04% | 0.20%(+0.835)#61 | 0.30%(+0.732)#2,765 |
| 62. | Perry Heights | 1.02% | 0.20%(+0.815)#62 | 0.30%(+0.711)#2,817 |
| 63. | Huron | 1.00% | 0.20%(+0.801)#63 | 0.30%(+0.698)#2,848 |
| 64. | Elmore | 1.00% | 0.20%(+0.798)#64 | 0.30%(+0.695)#2,859 |
| 65. | New Richmond | 0.99% | 0.20%(+0.787)#65 | 0.30%(+0.684)#2,892 |
| 66. | Lithopolis | 0.96% | 0.20%(+0.757)#66 | 0.30%(+0.654)#2,960 |
| 67. | Delaware | 0.94% | 0.20%(+0.741)#67 | 0.30%(+0.638)#3,008 |
| 68. | Westerville | 0.94% | 0.20%(+0.739)#68 | 0.30%(+0.636)#3,016 |
| 69. | Ashley | 0.94% | 0.20%(+0.737)#69 | 0.30%(+0.634)#3,023 |
| 70. | Bailey Lakes | 0.91% | 0.20%(+0.705)#70 | 0.30%(+0.602)#3,104 |
| 71. | Heath | 0.90% | 0.20%(+0.695)#71 | 0.30%(+0.592)#3,150 |
| 72. | Mount Healthy Heights | 0.83% | 0.20%(+0.628)#72 | 0.30%(+0.525)#3,386 |
| 73. | Union | 0.81% | 0.20%(+0.611)#73 | 0.30%(+0.508)#3,451 |
| 74. | Spencerville | 0.80% | 0.20%(+0.598)#74 | 0.30%(+0.495)#3,513 |
| 75. | Brookfield Center | 0.80% | 0.20%(+0.596)#75 | 0.30%(+0.493)#3,520 |
| 76. | Columbiana | 0.78% | 0.20%(+0.576)#76 | 0.30%(+0.473)#3,604 |
| 77. | Suffield | 0.76% | 0.20%(+0.557)#77 | 0.30%(+0.454)#3,684 |
| 78. | Perrysburg | 0.76% | 0.20%(+0.555)#78 | 0.30%(+0.452)#3,691 |
| 79. | Aurora | 0.75% | 0.20%(+0.548)#79 | 0.30%(+0.445)#3,716 |
| 80. | Granville | 0.74% | 0.20%(+0.543)#80 | 0.30%(+0.440)#3,734 |
| 81. | Circleville | 0.74% | 0.20%(+0.541)#81 | 0.30%(+0.438)#3,743 |
| 82. | Oxford | 0.74% | 0.20%(+0.538)#82 | 0.30%(+0.435)#3,752 |
| 83. | Glenford | 0.74% | 0.20%(+0.537)#83 | 0.30%(+0.434)#3,760 |
| 84. | Chagrin Falls | 0.73% | 0.20%(+0.528)#84 | 0.30%(+0.425)#3,795 |
| 85. | Arcadia | 0.73% | 0.20%(+0.526)#85 | 0.30%(+0.422)#3,809 |
| 86. | Wyoming | 0.72% | 0.20%(+0.521)#86 | 0.30%(+0.418)#3,826 |
| 87. | Mentor On The Lake | 0.71% | 0.20%(+0.512)#87 | 0.30%(+0.409)#3,874 |
| 88. | Malvern | 0.71% | 0.20%(+0.506)#88 | 0.30%(+0.403)#3,895 |
| 89. | South Vienna | 0.70% | 0.20%(+0.497)#89 | 0.30%(+0.394)#3,940 |
| 90. | Wolfhurst | 0.70% | 0.20%(+0.497)#90 | 0.30%(+0.393)#3,944 |
| 91. | Wheelersburg | 0.69% | 0.20%(+0.491)#91 | 0.30%(+0.388)#3,967 |
| 92. | Forest | 0.69% | 0.20%(+0.486)#92 | 0.30%(+0.383)#3,984 |
| 93. | Four Bridges | 0.68% | 0.20%(+0.482)#93 | 0.30%(+0.379)#4,003 |
| 94. | London | 0.68% | 0.20%(+0.477)#94 | 0.30%(+0.374)#4,022 |
| 95. | Port Clinton | 0.66% | 0.20%(+0.463)#95 | 0.30%(+0.360)#4,084 |
| 96. | Bellefontaine | 0.66% | 0.20%(+0.459)#96 | 0.30%(+0.356)#4,105 |
| 97. | Russells Point | 0.65% | 0.20%(+0.444)#97 | 0.30%(+0.341)#4,182 |
| 98. | Berkey | 0.65% | 0.20%(+0.444)#98 | 0.30%(+0.341)#4,183 |
| 99. | Thurston | 0.61% | 0.20%(+0.414)#99 | 0.30%(+0.310)#4,320 |
| 100. | Middletown | 0.61% | 0.20%(+0.409)#100 | 0.30%(+0.305)#4,350 |
Common Questions
What are the Top 10 Cities with the Highest Percentage of Scandinavian Population in Ohio?
Top 10 Cities with the Highest Percentage of Scandinavian Population in Ohio are:
#1
22.67%
#2
17.12%
#3
11.60%
#4
6.42%
#5
4.85%
#6
4.76%
#7
4.66%
#8
4.51%
#9
4.39%
#10
3.97%
What city has the Highest Percentage of Scandinavian Population in Ohio?
Otway has the Highest Percentage of Scandinavian Population in Ohio with 22.67%.
What is the Percentage of Scandinavian Population in the State of Ohio?
Percentage of Scandinavian Population in Ohio is 0.20%.
What is the Percentage of Scandinavian Population in the United States?
Percentage of Scandinavian Population in the United States is 0.30%.