Cities with the Highest Percentage of Scandinavian Population in New Jersey
RELATED REPORTS & OPTIONS
Scandinavian
New Jersey
Compare Cities
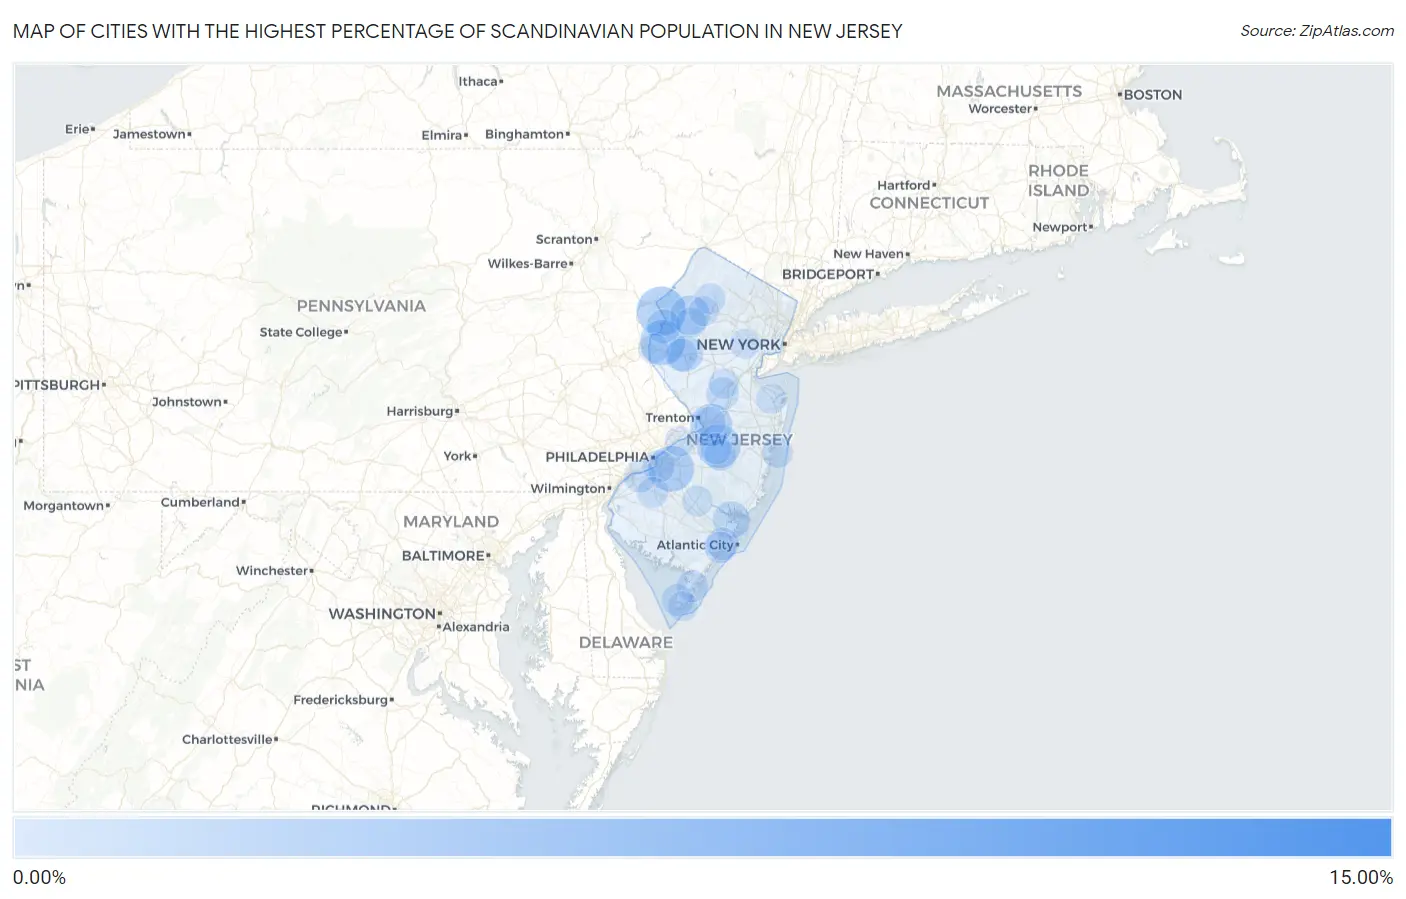
Map of Cities with the Highest Percentage of Scandinavian Population in New Jersey
0.00%
15.00%
Cities with the Highest Percentage of Scandinavian Population in New Jersey
| City | Scandinavian | vs State | vs National | |
| 1. | Marshallville | 11.06% | 0.094%(+11.0)#1 | 0.30%(+10.8)#102 |
| 2. | Ocean View | 8.35% | 0.094%(+8.26)#2 | 0.30%(+8.05)#153 |
| 3. | Columbia | 2.87% | 0.094%(+2.78)#3 | 0.30%(+2.57)#790 |
| 4. | Ashland | 2.37% | 0.094%(+2.27)#4 | 0.30%(+2.06)#1,032 |
| 5. | New Village | 2.32% | 0.094%(+2.23)#5 | 0.30%(+2.02)#1,068 |
| 6. | Titusville | 2.24% | 0.094%(+2.14)#6 | 0.30%(+1.93)#1,122 |
| 7. | Franklinville | 2.22% | 0.094%(+2.13)#7 | 0.30%(+1.92)#1,136 |
| 8. | Gillette | 2.19% | 0.094%(+2.10)#8 | 0.30%(+1.89)#1,152 |
| 9. | Mcguire Afb | 2.07% | 0.094%(+1.97)#9 | 0.30%(+1.76)#1,261 |
| 10. | Groveville | 1.89% | 0.094%(+1.80)#10 | 0.30%(+1.58)#1,404 |
| 11. | Ship Bottom Borough | 1.71% | 0.094%(+1.61)#11 | 0.30%(+1.40)#1,599 |
| 12. | Audubon Borough | 1.62% | 0.094%(+1.53)#12 | 0.30%(+1.32)#1,702 |
| 13. | Panther Valley | 1.51% | 0.094%(+1.42)#13 | 0.30%(+1.21)#1,838 |
| 14. | West Park | 1.35% | 0.094%(+1.25)#14 | 0.30%(+1.04)#2,076 |
| 15. | Sheppards Mill | 1.27% | 0.094%(+1.17)#15 | 0.30%(+0.962)#2,241 |
| 16. | Silver Lake Cdp Warren County | 1.23% | 0.094%(+1.14)#16 | 0.30%(+0.930)#2,314 |
| 17. | Port Republic | 1.22% | 0.094%(+1.13)#17 | 0.30%(+0.920)#2,328 |
| 18. | Hampton Borough | 1.13% | 0.094%(+1.03)#18 | 0.30%(+0.824)#2,535 |
| 19. | Annandale | 1.08% | 0.094%(+0.986)#19 | 0.30%(+0.775)#2,660 |
| 20. | Netcong Borough | 0.98% | 0.094%(+0.882)#20 | 0.30%(+0.672)#2,919 |
| 21. | High Bridge Borough | 0.95% | 0.094%(+0.860)#21 | 0.30%(+0.650)#2,972 |
| 22. | Fair Haven Borough | 0.92% | 0.094%(+0.823)#22 | 0.30%(+0.612)#3,079 |
| 23. | South Bound Brook Borough | 0.89% | 0.094%(+0.795)#23 | 0.30%(+0.584)#3,170 |
| 24. | Pine Beach Borough | 0.87% | 0.094%(+0.781)#24 | 0.30%(+0.570)#3,224 |
| 25. | Cranford | 0.87% | 0.094%(+0.774)#25 | 0.30%(+0.564)#3,246 |
| 26. | Hillsdale Borough | 0.83% | 0.094%(+0.736)#26 | 0.30%(+0.525)#3,385 |
| 27. | Belvidere | 0.79% | 0.094%(+0.696)#27 | 0.30%(+0.486)#3,548 |
| 28. | Oceanport Borough | 0.78% | 0.094%(+0.691)#28 | 0.30%(+0.480)#3,569 |
| 29. | Audubon Park Borough | 0.78% | 0.094%(+0.682)#29 | 0.30%(+0.472)#3,611 |
| 30. | Palermo | 0.77% | 0.094%(+0.674)#30 | 0.30%(+0.463)#3,651 |
| 31. | Atlantic Highlands Borough | 0.75% | 0.094%(+0.655)#31 | 0.30%(+0.444)#3,719 |
| 32. | Clayton Borough | 0.73% | 0.094%(+0.634)#32 | 0.30%(+0.423)#3,807 |
| 33. | Haddonfield Borough | 0.71% | 0.094%(+0.621)#33 | 0.30%(+0.410)#3,866 |
| 34. | Franklin Lakes Borough | 0.62% | 0.094%(+0.524)#34 | 0.30%(+0.313)#4,306 |
| 35. | Clinton | 0.61% | 0.094%(+0.519)#35 | 0.30%(+0.308)#4,328 |
| 36. | Hopewell Borough | 0.60% | 0.094%(+0.509)#36 | 0.30%(+0.298)#4,389 |
| 37. | Monmouth Junction | 0.59% | 0.094%(+0.501)#37 | 0.30%(+0.291)#4,428 |
| 38. | Northfield | 0.58% | 0.094%(+0.488)#38 | 0.30%(+0.277)#4,506 |
| 39. | Malaga | 0.57% | 0.094%(+0.480)#39 | 0.30%(+0.269)#4,550 |
| 40. | Gloucester City | 0.57% | 0.094%(+0.475)#40 | 0.30%(+0.264)#4,574 |
| 41. | Helmetta Borough | 0.56% | 0.094%(+0.471)#41 | 0.30%(+0.260)#4,596 |
| 42. | Highland Park Borough | 0.55% | 0.094%(+0.460)#42 | 0.30%(+0.249)#4,661 |
| 43. | North Cape May | 0.55% | 0.094%(+0.454)#43 | 0.30%(+0.244)#4,695 |
| 44. | Gibbstown | 0.55% | 0.094%(+0.454)#44 | 0.30%(+0.243)#4,699 |
| 45. | Red Bank Borough | 0.54% | 0.094%(+0.450)#45 | 0.30%(+0.240)#4,713 |
| 46. | Woodbine Borough | 0.53% | 0.094%(+0.436)#46 | 0.30%(+0.226)#4,797 |
| 47. | Franklin Borough | 0.51% | 0.094%(+0.413)#47 | 0.30%(+0.202)#4,943 |
| 48. | Beachwood Borough | 0.50% | 0.094%(+0.409)#48 | 0.30%(+0.199)#4,968 |
| 49. | Medford Lakes Borough | 0.49% | 0.094%(+0.399)#49 | 0.30%(+0.188)#5,039 |
| 50. | Sea Girt Borough | 0.49% | 0.094%(+0.399)#50 | 0.30%(+0.188)#5,043 |
| 51. | Cape May Court House | 0.49% | 0.094%(+0.392)#51 | 0.30%(+0.182)#5,091 |
| 52. | North Caldwell Borough | 0.48% | 0.094%(+0.389)#52 | 0.30%(+0.179)#5,107 |
| 53. | Lake Como Borough | 0.47% | 0.094%(+0.374)#53 | 0.30%(+0.164)#5,227 |
| 54. | Browns Mills | 0.47% | 0.094%(+0.374)#54 | 0.30%(+0.163)#5,234 |
| 55. | Bloomsbury Borough | 0.47% | 0.094%(+0.372)#55 | 0.30%(+0.161)#5,245 |
| 56. | Woodlynne Borough | 0.45% | 0.094%(+0.354)#56 | 0.30%(+0.143)#5,387 |
| 57. | Linwood | 0.45% | 0.094%(+0.352)#57 | 0.30%(+0.142)#5,407 |
| 58. | Union Beach Borough | 0.43% | 0.094%(+0.341)#58 | 0.30%(+0.130)#5,501 |
| 59. | Wrightstown Borough | 0.43% | 0.094%(+0.335)#59 | 0.30%(+0.124)#5,562 |
| 60. | Yardville | 0.42% | 0.094%(+0.328)#60 | 0.30%(+0.117)#5,621 |
| 61. | Harvey Cedars Borough | 0.42% | 0.094%(+0.324)#61 | 0.30%(+0.113)#5,656 |
| 62. | Lincoln Park Borough | 0.41% | 0.094%(+0.320)#62 | 0.30%(+0.109)#5,691 |
| 63. | Centre Grove | 0.41% | 0.094%(+0.317)#63 | 0.30%(+0.107)#5,718 |
| 64. | Keansburg Borough | 0.41% | 0.094%(+0.316)#64 | 0.30%(+0.105)#5,728 |
| 65. | Mendham Borough | 0.40% | 0.094%(+0.309)#65 | 0.30%(+0.098)#5,792 |
| 66. | Fort Dix | 0.39% | 0.094%(+0.292)#66 | 0.30%(+0.081)#5,942 |
| 67. | Richwood | 0.38% | 0.094%(+0.289)#67 | 0.30%(+0.079)#5,972 |
| 68. | Carlstadt Borough | 0.38% | 0.094%(+0.285)#68 | 0.30%(+0.074)#6,014 |
| 69. | English Creek | 0.37% | 0.094%(+0.280)#69 | 0.30%(+0.069)#6,068 |
| 70. | The College Of New Jersey | 0.37% | 0.094%(+0.279)#70 | 0.30%(+0.068)#6,084 |
| 71. | South Dennis | 0.36% | 0.094%(+0.270)#71 | 0.30%(+0.059)#6,169 |
| 72. | Saddle River Borough | 0.36% | 0.094%(+0.263)#72 | 0.30%(+0.053)#6,229 |
| 73. | Seaville | 0.36% | 0.094%(+0.262)#73 | 0.30%(+0.051)#6,246 |
| 74. | Dover Beaches North | 0.35% | 0.094%(+0.260)#74 | 0.30%(+0.049)#6,257 |
| 75. | Lake Mohawk | 0.35% | 0.094%(+0.257)#75 | 0.30%(+0.046)#6,294 |
| 76. | Metuchen Borough | 0.33% | 0.094%(+0.241)#76 | 0.30%(+0.030)#6,458 |
| 77. | Island Heights Borough | 0.33% | 0.094%(+0.235)#77 | 0.30%(+0.024)#6,518 |
| 78. | Hammonton | 0.31% | 0.094%(+0.219)#78 | 0.30%(+0.008)#6,677 |
| 79. | Garwood Borough | 0.31% | 0.094%(+0.215)#79 | 0.30%(+0.004)#6,717 |
| 80. | Preakness | 0.31% | 0.094%(+0.213)#80 | 0.30%(+0.002)#6,737 |
| 81. | Washington Borough | 0.30% | 0.094%(+0.210)#81 | 0.30%(-0.000)#6,771 |
| 82. | Whippany | 0.29% | 0.094%(+0.199)#82 | 0.30%(-0.012)#6,920 |
| 83. | Franklin Park | 0.29% | 0.094%(+0.197)#83 | 0.30%(-0.014)#6,947 |
| 84. | Beach Haven Borough | 0.28% | 0.094%(+0.189)#84 | 0.30%(-0.022)#7,037 |
| 85. | Upper Pohatcong | 0.28% | 0.094%(+0.188)#85 | 0.30%(-0.022)#7,045 |
| 86. | Beverly | 0.28% | 0.094%(+0.186)#86 | 0.30%(-0.025)#7,072 |
| 87. | Seaside Park Borough | 0.28% | 0.094%(+0.184)#87 | 0.30%(-0.026)#7,086 |
| 88. | Bay Head Borough | 0.27% | 0.094%(+0.180)#88 | 0.30%(-0.031)#7,145 |
| 89. | Rockaway Borough | 0.27% | 0.094%(+0.180)#89 | 0.30%(-0.031)#7,149 |
| 90. | Hackettstown | 0.27% | 0.094%(+0.173)#90 | 0.30%(-0.037)#7,238 |
| 91. | Summit | 0.27% | 0.094%(+0.172)#91 | 0.30%(-0.038)#7,247 |
| 92. | Lincroft | 0.26% | 0.094%(+0.171)#92 | 0.30%(-0.039)#7,259 |
| 93. | Gibbsboro Borough | 0.26% | 0.094%(+0.170)#93 | 0.30%(-0.041)#7,282 |
| 94. | Byram Center | 0.25% | 0.094%(+0.160)#94 | 0.30%(-0.050)#7,436 |
| 95. | Somerdale Borough | 0.25% | 0.094%(+0.160)#95 | 0.30%(-0.051)#7,453 |
| 96. | Basking Ridge | 0.25% | 0.094%(+0.159)#96 | 0.30%(-0.051)#7,459 |
| 97. | Upper Saddle River Borough | 0.25% | 0.094%(+0.159)#97 | 0.30%(-0.052)#7,465 |
| 98. | Cape May | 0.25% | 0.094%(+0.155)#98 | 0.30%(-0.056)#7,518 |
| 99. | Waldwick Borough | 0.25% | 0.094%(+0.155)#99 | 0.30%(-0.056)#7,521 |
| 100. | Emerson Borough | 0.25% | 0.094%(+0.154)#100 | 0.30%(-0.057)#7,535 |
Common Questions
What are the Top 10 Cities with the Highest Percentage of Scandinavian Population in New Jersey?
Top 10 Cities with the Highest Percentage of Scandinavian Population in New Jersey are:
#1
2.87%
#2
2.37%
#3
2.32%
#4
2.07%
#5
1.89%
#6
1.51%
#7
1.22%
#8
1.08%
#9
0.79%
#10
0.61%
What city has the Highest Percentage of Scandinavian Population in New Jersey?
Columbia has the Highest Percentage of Scandinavian Population in New Jersey with 2.87%.
What is the Percentage of Scandinavian Population in the State of New Jersey?
Percentage of Scandinavian Population in New Jersey is 0.094%.
What is the Percentage of Scandinavian Population in the United States?
Percentage of Scandinavian Population in the United States is 0.30%.