Cavetown, MD
Cavetown Map
Cavetown Overview
974
TOTAL POPULATION
483
MALE POPULATION
491
FEMALE POPULATION
98.37
MALES / 100 FEMALES
101.66
FEMALES / 100 MALES
57.4
MEDIAN AGE
2.7
AVG FAMILY SIZE
2.5
AVG HOUSEHOLD SIZE
$43,586
PER CAPITA INCOME
$102,029
AVG FAMILY INCOME
$101,706
AVG HOUSEHOLD INCOME
1.4%
WAGE / INCOME GAP [ % ]
98.6¢/ $1
WAGE / INCOME GAP [ $ ]
0.29
INEQUALITY / GINI INDEX
422
LABOR FORCE [ PEOPLE ]
49.8%
PERCENT IN LABOR FORCE
2.1%
UNEMPLOYMENT RATE
Cavetown Area Codes
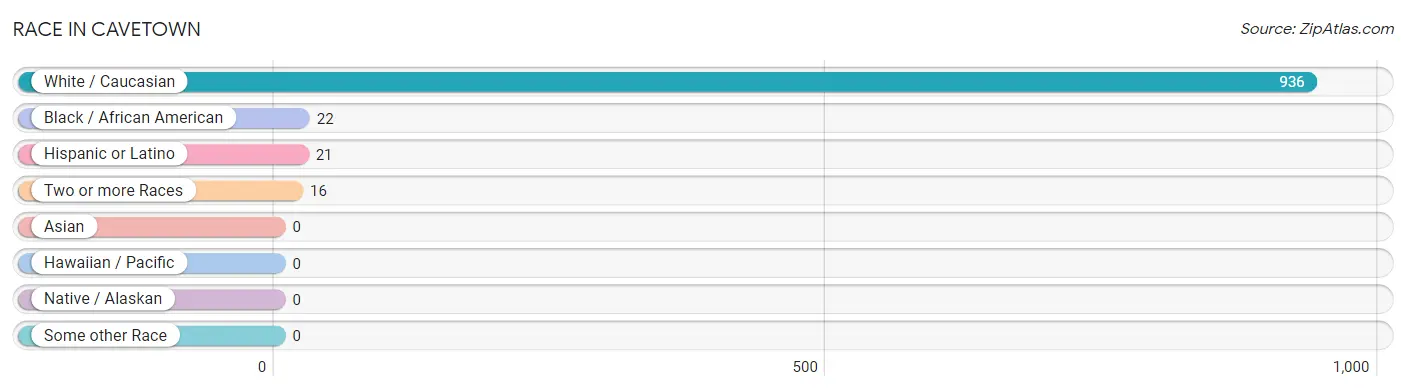
Race in Cavetown
The most populous races in Cavetown are White / Caucasian (936 | 96.1%), Black / African American (22 | 2.3%), and Hispanic or Latino (21 | 2.2%).
| Race | # Population | % Population |
| Asian | 0 | 0.0% |
| Black / African American | 22 | 2.3% |
| Hawaiian / Pacific | 0 | 0.0% |
| Hispanic or Latino | 21 | 2.2% |
| Native / Alaskan | 0 | 0.0% |
| White / Caucasian | 936 | 96.1% |
| Two or more Races | 16 | 1.6% |
| Some other Race | 0 | 0.0% |
| Total | 974 | 100.0% |
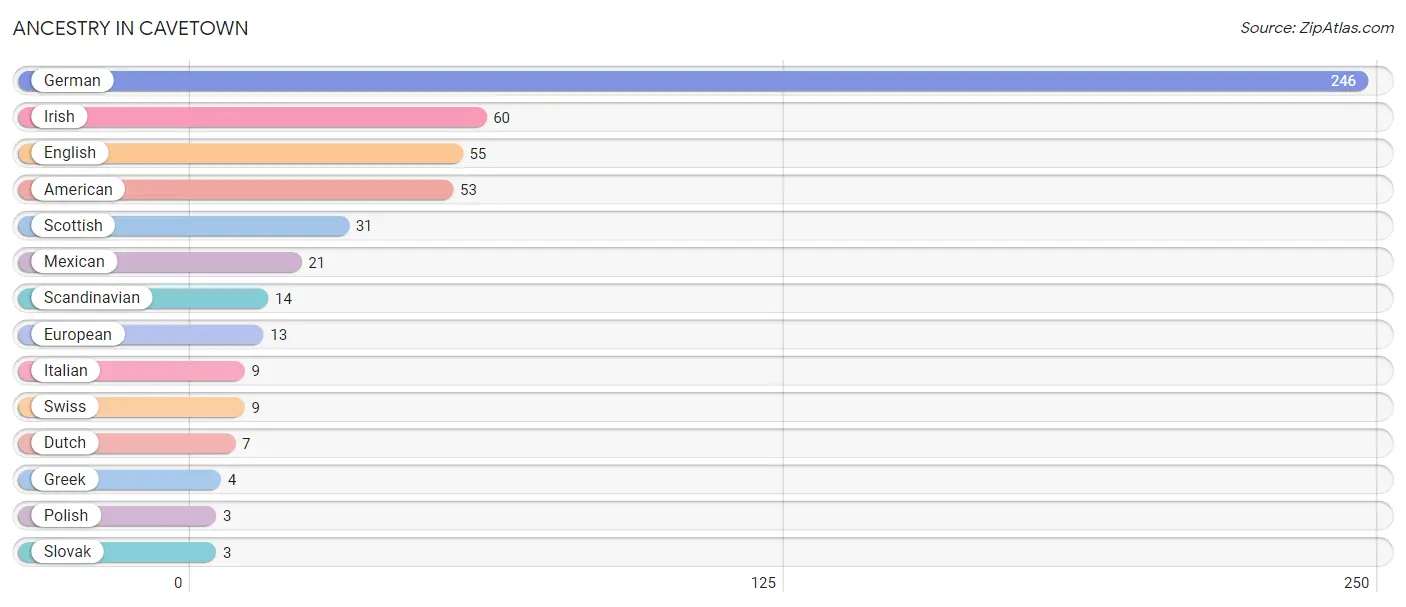
Ancestry in Cavetown
The most populous ancestries reported in Cavetown are German (246 | 25.3%), Irish (60 | 6.2%), English (55 | 5.7%), American (53 | 5.4%), and Scottish (31 | 3.2%), together accounting for 45.7% of all Cavetown residents.
| Ancestry | # Population | % Population |
| American | 53 | 5.4% |
| Dutch | 7 | 0.7% |
| English | 55 | 5.7% |
| European | 13 | 1.3% |
| German | 246 | 25.3% |
| Greek | 4 | 0.4% |
| Irish | 60 | 6.2% |
| Italian | 9 | 0.9% |
| Mexican | 21 | 2.2% |
| Polish | 3 | 0.3% |
| Scandinavian | 14 | 1.4% |
| Scottish | 31 | 3.2% |
| Slovak | 3 | 0.3% |
| Swiss | 9 | 0.9% | View All 14 Rows |
Immigrants in Cavetown

| Immigration Origin | # Population | % Population | View All 0 Rows |
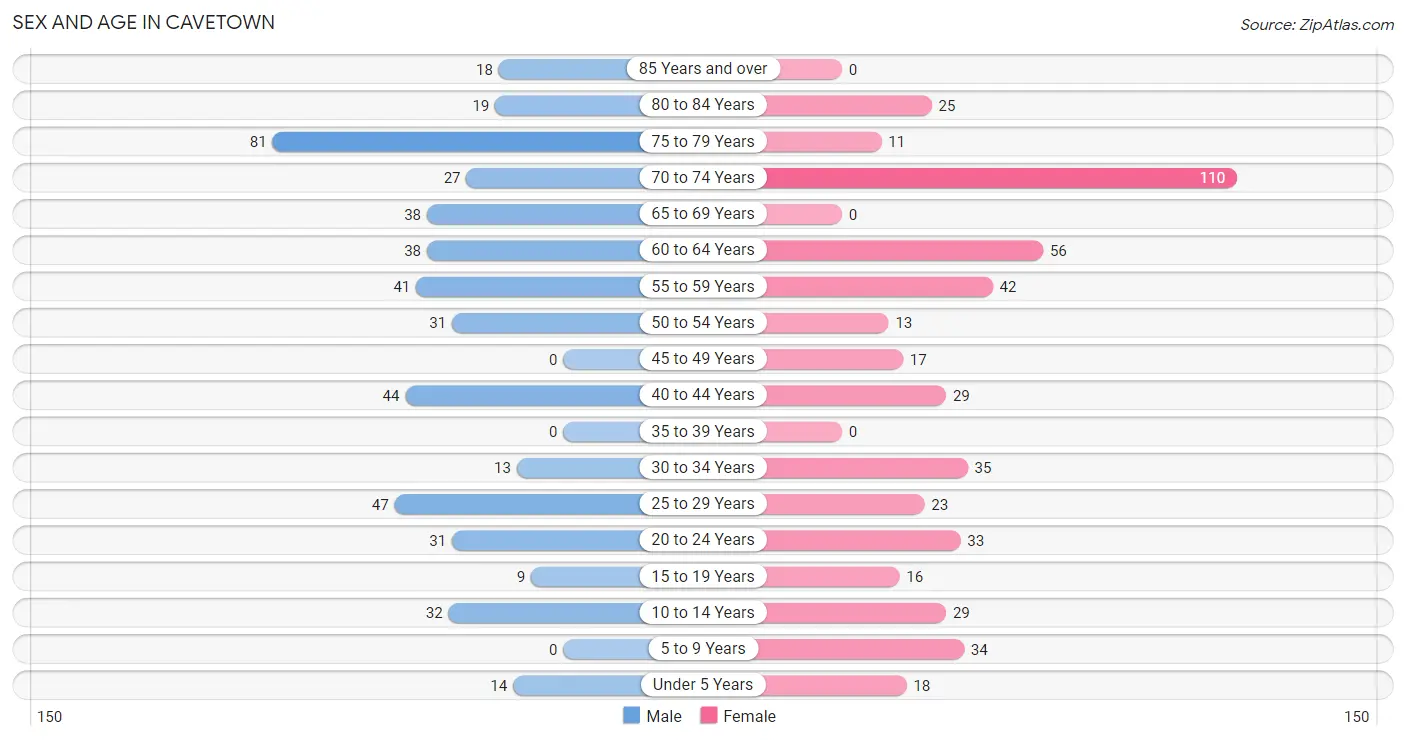
Sex and Age in Cavetown
Sex and Age in Cavetown
The most populous age groups in Cavetown are 75 to 79 Years (81 | 16.8%) for men and 70 to 74 Years (110 | 22.4%) for women.
| Age Bracket | Male | Female |
| Under 5 Years | 14 (2.9%) | 18 (3.7%) |
| 5 to 9 Years | 0 (0.0%) | 34 (6.9%) |
| 10 to 14 Years | 32 (6.6%) | 29 (5.9%) |
| 15 to 19 Years | 9 (1.9%) | 16 (3.3%) |
| 20 to 24 Years | 31 (6.4%) | 33 (6.7%) |
| 25 to 29 Years | 47 (9.7%) | 23 (4.7%) |
| 30 to 34 Years | 13 (2.7%) | 35 (7.1%) |
| 35 to 39 Years | 0 (0.0%) | 0 (0.0%) |
| 40 to 44 Years | 44 (9.1%) | 29 (5.9%) |
| 45 to 49 Years | 0 (0.0%) | 17 (3.5%) |
| 50 to 54 Years | 31 (6.4%) | 13 (2.6%) |
| 55 to 59 Years | 41 (8.5%) | 42 (8.6%) |
| 60 to 64 Years | 38 (7.9%) | 56 (11.4%) |
| 65 to 69 Years | 38 (7.9%) | 0 (0.0%) |
| 70 to 74 Years | 27 (5.6%) | 110 (22.4%) |
| 75 to 79 Years | 81 (16.8%) | 11 (2.2%) |
| 80 to 84 Years | 19 (3.9%) | 25 (5.1%) |
| 85 Years and over | 18 (3.7%) | 0 (0.0%) |
| Total | 483 (100.0%) | 491 (100.0%) |
Families and Households in Cavetown
Median Family Size in Cavetown
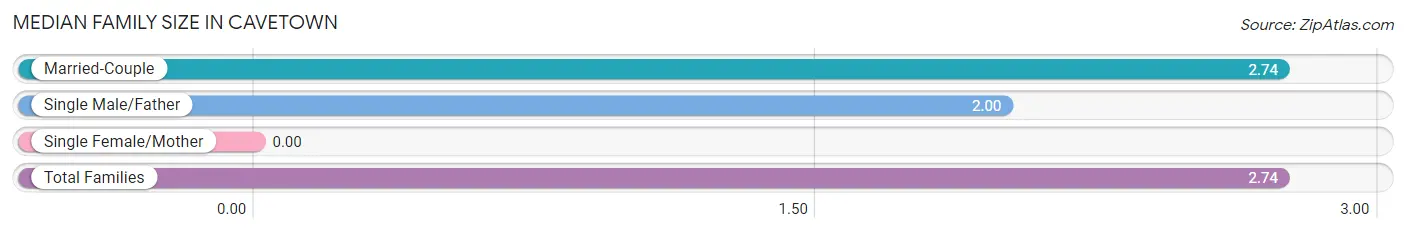
| Family Type | # Families | Family Size |
| Married-Couple | 329 (99.1%) | 2.74 |
| Single Male/Father | 3 (0.9%) | 2.00 |
| Single Female/Mother | 0 (0.0%) | - |
| Total Families | 332 (100.0%) | 2.74 |
Median Household Size in Cavetown
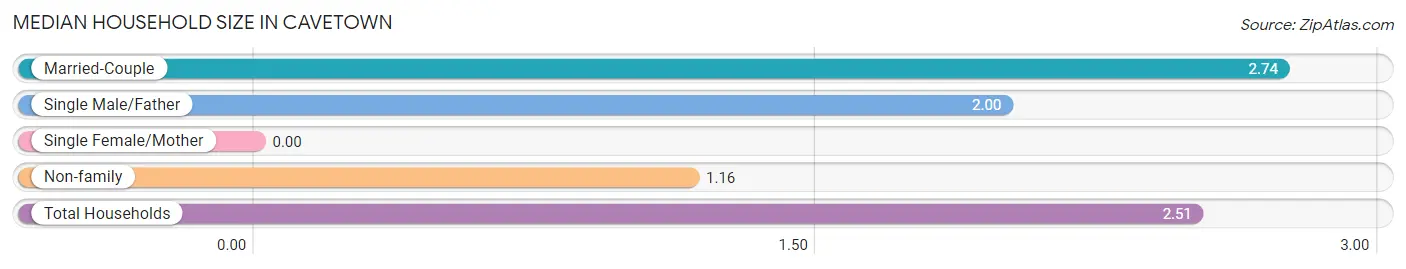
| Household Type | # Households | Household Size |
| Married-Couple | 329 (84.8%) | 2.74 |
| Single Male/Father | 3 (0.8%) | 2.00 |
| Single Female/Mother | 0 (0.0%) | - |
| Non-family | 56 (14.4%) | 1.16 |
| Total Households | 388 (100.0%) | 2.51 |
Household Size by Marriage Status in Cavetown
Out of a total of 388 households in Cavetown, 332 (85.6%) are family households, while 56 (14.4%) are nonfamily households. The most numerous type of family households are 2-person households, comprising 187, and the most common type of nonfamily households are 1-person households, comprising 48.
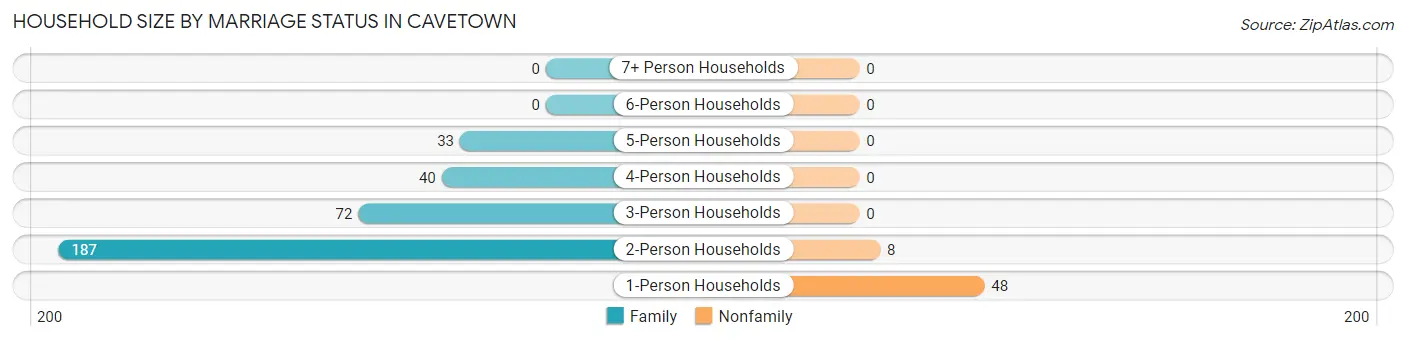
| Household Size | Family Households | Nonfamily Households |
| 1-Person Households | - | 48 (12.4%) |
| 2-Person Households | 187 (48.2%) | 8 (2.1%) |
| 3-Person Households | 72 (18.6%) | 0 (0.0%) |
| 4-Person Households | 40 (10.3%) | 0 (0.0%) |
| 5-Person Households | 33 (8.5%) | 0 (0.0%) |
| 6-Person Households | 0 (0.0%) | 0 (0.0%) |
| 7+ Person Households | 0 (0.0%) | 0 (0.0%) |
| Total | 332 (85.6%) | 56 (14.4%) |
Female Fertility in Cavetown
Fertility by Age in Cavetown
Average fertility rate in Cavetown is 65.0 births per 1,000 women. Women in the age bracket of 20 to 34 years have the highest fertility rate with 110.0 births per 1,000 women. Women in the age bracket of 20 to 34 years acount for 100.0% of all women with births.
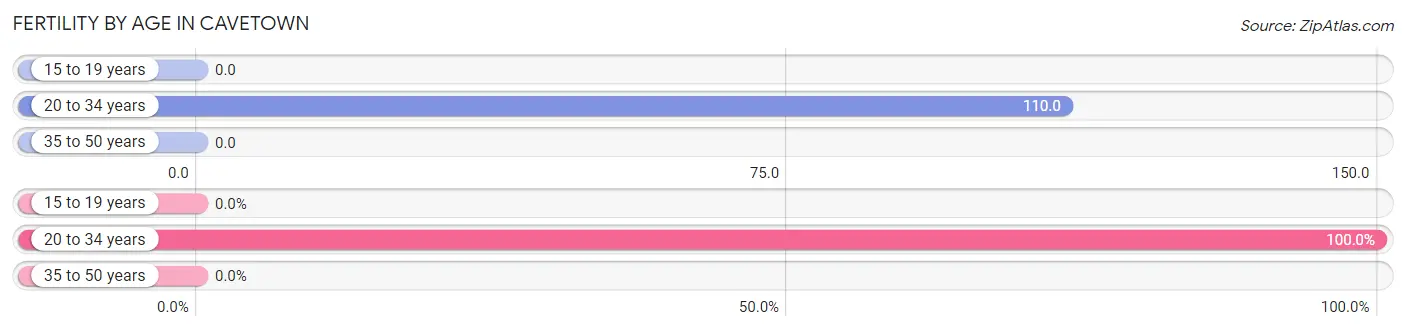
| Age Bracket | Women with Births | Births / 1,000 Women |
| 15 to 19 years | 0 (0.0%) | 0.0 |
| 20 to 34 years | 10 (100.0%) | 110.0 |
| 35 to 50 years | 0 (0.0%) | 0.0 |
| Total | 10 (100.0%) | 65.0 |
Fertility by Age by Marriage Status in Cavetown
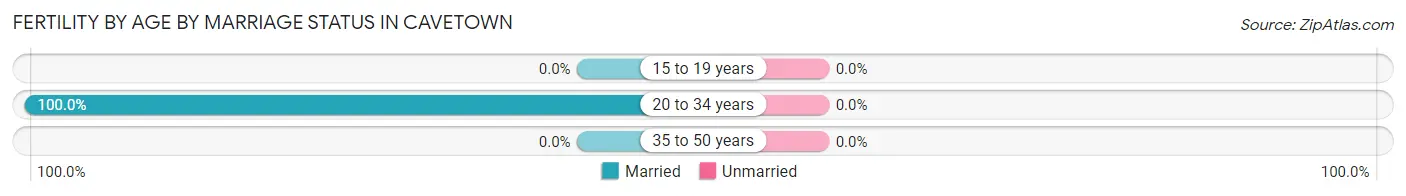
| Age Bracket | Married | Unmarried |
| 15 to 19 years | 0 (0.0%) | 0 (0.0%) |
| 20 to 34 years | 10 (100.0%) | 0 (0.0%) |
| 35 to 50 years | 0 (0.0%) | 0 (0.0%) |
| Total | 10 (100.0%) | 0 (0.0%) |
Fertility by Education in Cavetown
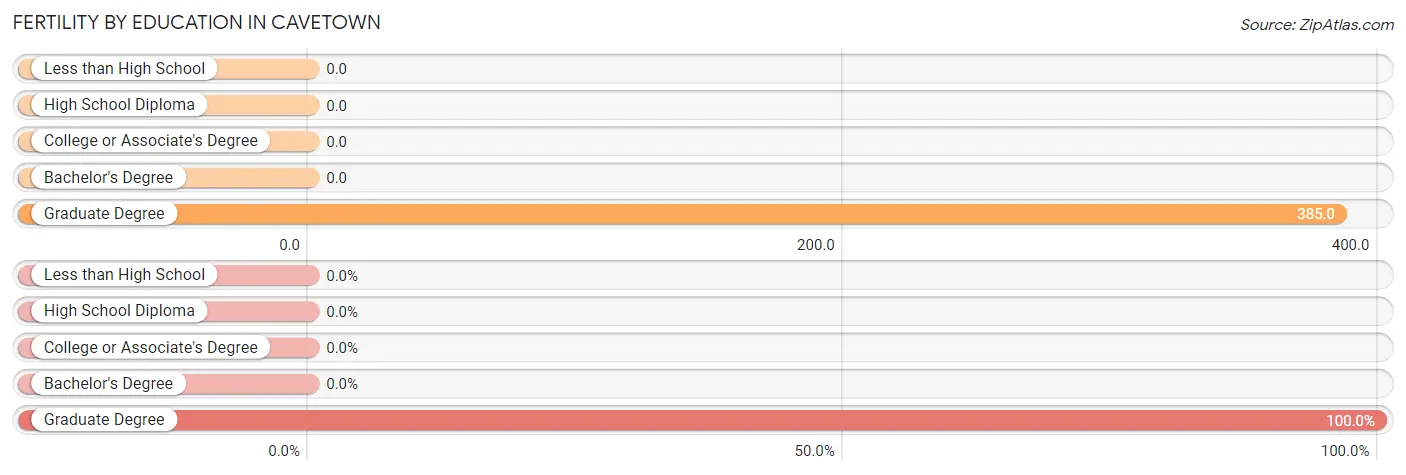
| Educational Attainment | Women with Births | Births / 1,000 Women |
| Less than High School | 0 (0.0%) | 0.0 |
| High School Diploma | 0 (0.0%) | 0.0 |
| College or Associate's Degree | 0 (0.0%) | 0.0 |
| Bachelor's Degree | 0 (0.0%) | 0.0 |
| Graduate Degree | 10 (100.0%) | 385.0 |
| Total | 10 (100.0%) | 65.0 |
Fertility by Education by Marriage Status in Cavetown
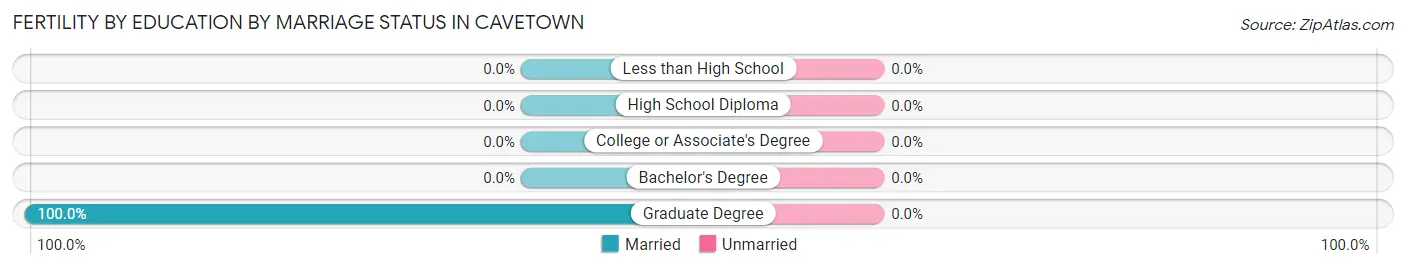
| Educational Attainment | Married | Unmarried |
| Less than High School | 0 (0.0%) | 0 (0.0%) |
| High School Diploma | 0 (0.0%) | 0 (0.0%) |
| College or Associate's Degree | 0 (0.0%) | 0 (0.0%) |
| Bachelor's Degree | 0 (0.0%) | 0 (0.0%) |
| Graduate Degree | 10 (100.0%) | 0 (0.0%) |
| Total | 10 (100.0%) | 0 (0.0%) |
Income in Cavetown
Income Overview in Cavetown
Per Capita Income in Cavetown is $43,586, while median incomes of families and households are $102,029 and $101,706 respectively.
| Characteristic | Number | Measure |
| Per Capita Income | 974 | $43,586 |
| Median Family Income | 332 | $102,029 |
| Mean Family Income | 332 | $117,845 |
| Median Household Income | 388 | $101,706 |
| Mean Household Income | 388 | $108,369 |
| Income Deficit | 332 | $0 |
| Wage / Income Gap (%) | 974 | 1.37% |
| Wage / Income Gap ($) | 974 | 98.63¢ per $1 |
| Gini / Inequality Index | 974 | 0.29 |
Earnings by Sex in Cavetown
Average Earnings in Cavetown are $58,835, $59,000 for men and $58,194 for women, a difference of 1.4%.
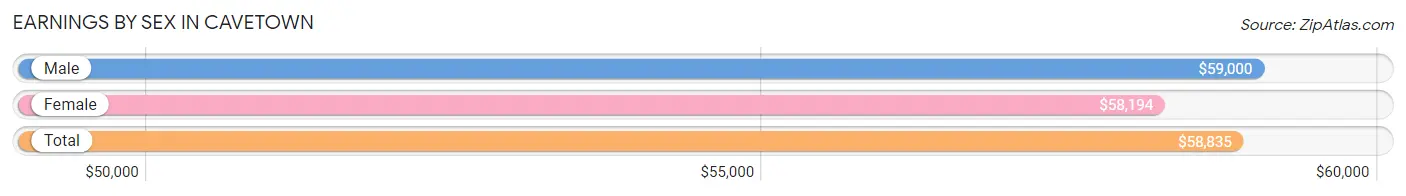
| Sex | Number | Average Earnings |
| Male | 244 (44.3%) | $59,000 |
| Female | 307 (55.7%) | $58,194 |
| Total | 551 (100.0%) | $58,835 |
Earnings by Sex by Income Bracket in Cavetown
The most common earnings brackets in Cavetown are $55,000 to $64,999 for men (61 | 25.0%) and $65,000 to $74,999 for women (104 | 33.9%).
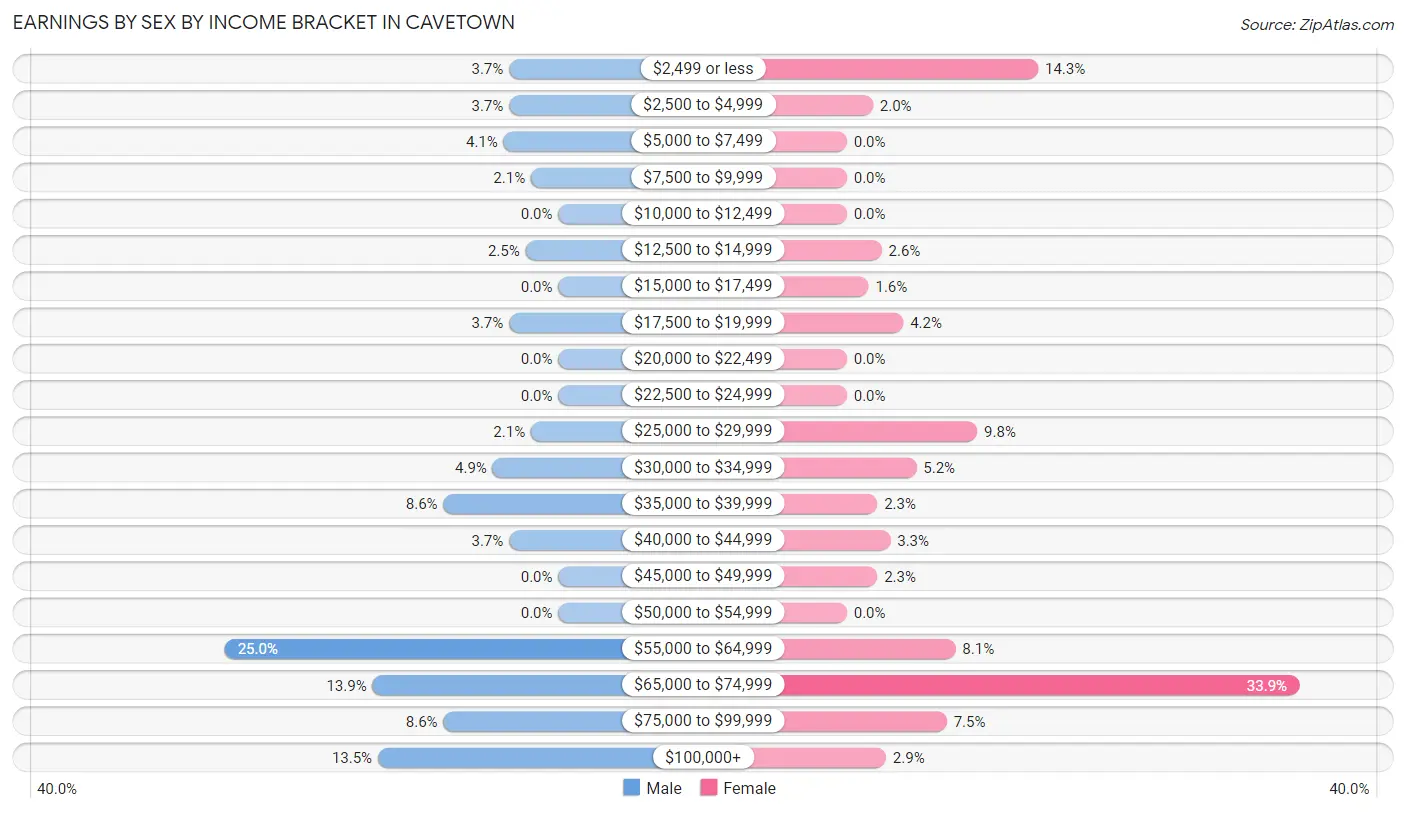
| Income | Male | Female |
| $2,499 or less | 9 (3.7%) | 44 (14.3%) |
| $2,500 to $4,999 | 9 (3.7%) | 6 (1.9%) |
| $5,000 to $7,499 | 10 (4.1%) | 0 (0.0%) |
| $7,500 to $9,999 | 5 (2.1%) | 0 (0.0%) |
| $10,000 to $12,499 | 0 (0.0%) | 0 (0.0%) |
| $12,500 to $14,999 | 6 (2.5%) | 8 (2.6%) |
| $15,000 to $17,499 | 0 (0.0%) | 5 (1.6%) |
| $17,500 to $19,999 | 9 (3.7%) | 13 (4.2%) |
| $20,000 to $22,499 | 0 (0.0%) | 0 (0.0%) |
| $22,500 to $24,999 | 0 (0.0%) | 0 (0.0%) |
| $25,000 to $29,999 | 5 (2.1%) | 30 (9.8%) |
| $30,000 to $34,999 | 12 (4.9%) | 16 (5.2%) |
| $35,000 to $39,999 | 21 (8.6%) | 7 (2.3%) |
| $40,000 to $44,999 | 9 (3.7%) | 10 (3.3%) |
| $45,000 to $49,999 | 0 (0.0%) | 7 (2.3%) |
| $50,000 to $54,999 | 0 (0.0%) | 0 (0.0%) |
| $55,000 to $64,999 | 61 (25.0%) | 25 (8.1%) |
| $65,000 to $74,999 | 34 (13.9%) | 104 (33.9%) |
| $75,000 to $99,999 | 21 (8.6%) | 23 (7.5%) |
| $100,000+ | 33 (13.5%) | 9 (2.9%) |
| Total | 244 (100.0%) | 307 (100.0%) |
Earnings by Sex by Educational Attainment in Cavetown
Average earnings in Cavetown are $62,688 for men and $65,972 for women, a difference of 5.0%. Men with an educational attainment of college or associate's degree enjoy the highest average annual earnings of $66,538, while those with high school diploma education earn the least with $57,292. Women with an educational attainment of graduate degree earn the most with the average annual earnings of $66,389, while those with college or associate's degree education have the smallest earnings of $34,219.
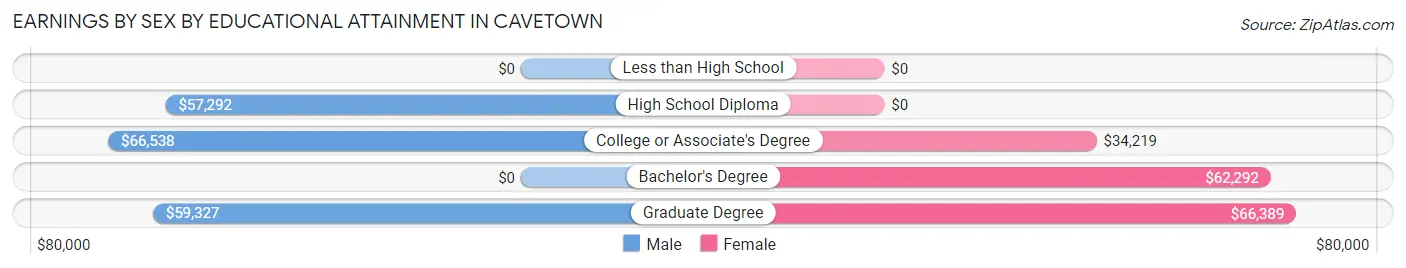
| Educational Attainment | Male Income | Female Income |
| Less than High School | - | - |
| High School Diploma | $57,292 | $0 |
| College or Associate's Degree | $66,538 | $34,219 |
| Bachelor's Degree | - | - |
| Graduate Degree | $59,327 | $66,389 |
| Total | $62,688 | $65,972 |
Family Income in Cavetown
Family Income Brackets in Cavetown
According to the Cavetown family income data, there are 187 families falling into the $100,000 to $149,999 income range, which is the most common income bracket and makes up 56.3% of all families.
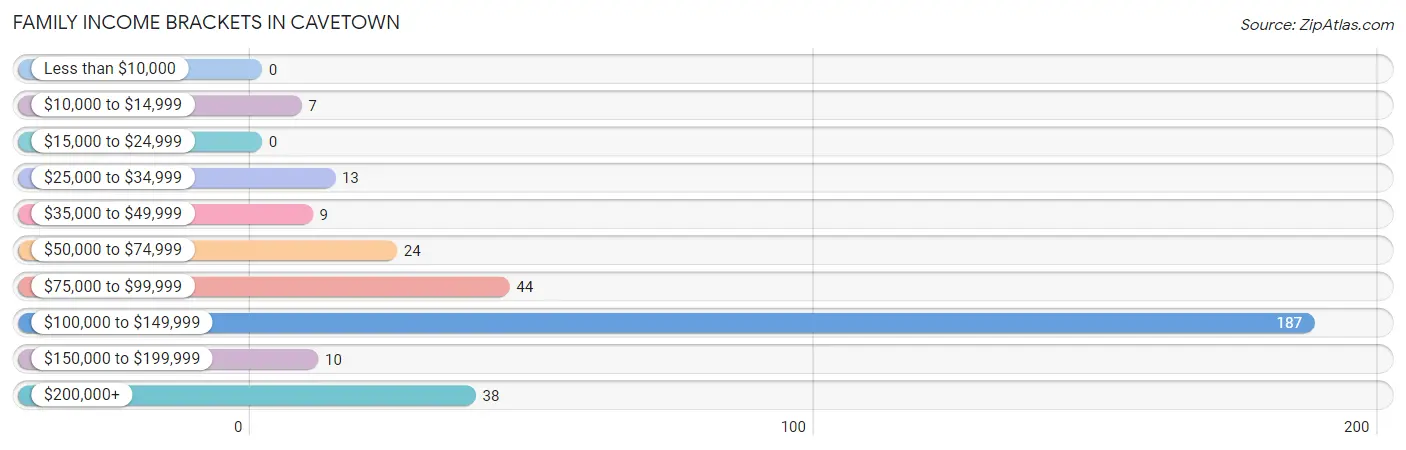
| Income Bracket | # Families | % Families |
| Less than $10,000 | 0 | 0.0% |
| $10,000 to $14,999 | 7 | 2.1% |
| $15,000 to $24,999 | 0 | 0.0% |
| $25,000 to $34,999 | 13 | 3.9% |
| $35,000 to $49,999 | 9 | 2.7% |
| $50,000 to $74,999 | 24 | 7.2% |
| $75,000 to $99,999 | 44 | 13.3% |
| $100,000 to $149,999 | 187 | 56.3% |
| $150,000 to $199,999 | 10 | 3.0% |
| $200,000+ | 38 | 11.4% |
Family Income by Famaliy Size in Cavetown
4-person families (40 | 12.0%) account for the highest median family income in Cavetown with $227,500 per family, while 4-person families (40 | 12.0%) have the highest median income of $56,875 per family member.
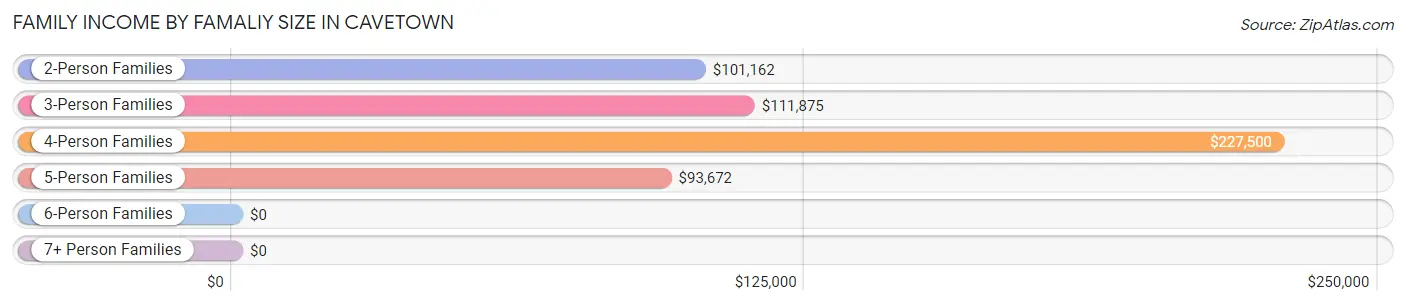
| Income Bracket | # Families | Median Income |
| 2-Person Families | 187 (56.3%) | $101,162 |
| 3-Person Families | 72 (21.7%) | $111,875 |
| 4-Person Families | 40 (12.0%) | $227,500 |
| 5-Person Families | 33 (9.9%) | $93,672 |
| 6-Person Families | 0 (0.0%) | $0 |
| 7+ Person Families | 0 (0.0%) | $0 |
| Total | 332 (100.0%) | $102,029 |
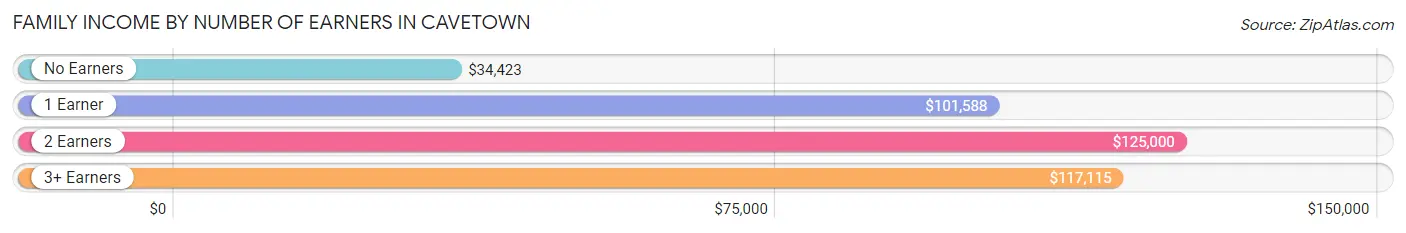
Family Income by Number of Earners in Cavetown
The median family income in Cavetown is $102,029, with families comprising 2 earners (126) having the highest median family income of $125,000, while families with no earners (34) have the lowest median family income of $34,423, accounting for 38.0% and 10.2% of families, respectively.
| Number of Earners | # Families | Median Income |
| No Earners | 34 (10.2%) | $34,423 |
| 1 Earner | 126 (38.0%) | $101,588 |
| 2 Earners | 126 (38.0%) | $125,000 |
| 3+ Earners | 46 (13.9%) | $117,115 |
| Total | 332 (100.0%) | $102,029 |
Household Income in Cavetown
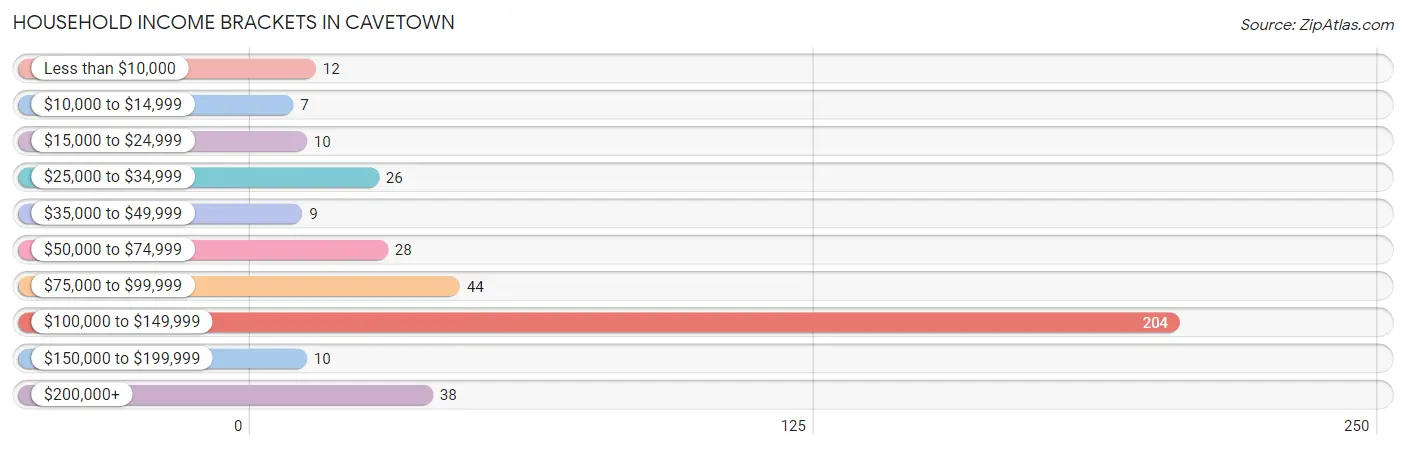
Household Income Brackets in Cavetown
With 204 households falling in the category, the $100,000 to $149,999 income range is the most frequent in Cavetown, accounting for 52.6% of all households. In contrast, only 7 households (1.8%) fall into the $10,000 to $14,999 income bracket, making it the least populous group.
| Income Bracket | # Households | % Households |
| Less than $10,000 | 12 | 3.1% |
| $10,000 to $14,999 | 7 | 1.8% |
| $15,000 to $24,999 | 10 | 2.6% |
| $25,000 to $34,999 | 26 | 6.7% |
| $35,000 to $49,999 | 9 | 2.3% |
| $50,000 to $74,999 | 28 | 7.2% |
| $75,000 to $99,999 | 44 | 11.3% |
| $100,000 to $149,999 | 204 | 52.6% |
| $150,000 to $199,999 | 10 | 2.6% |
| $200,000+ | 38 | 9.8% |
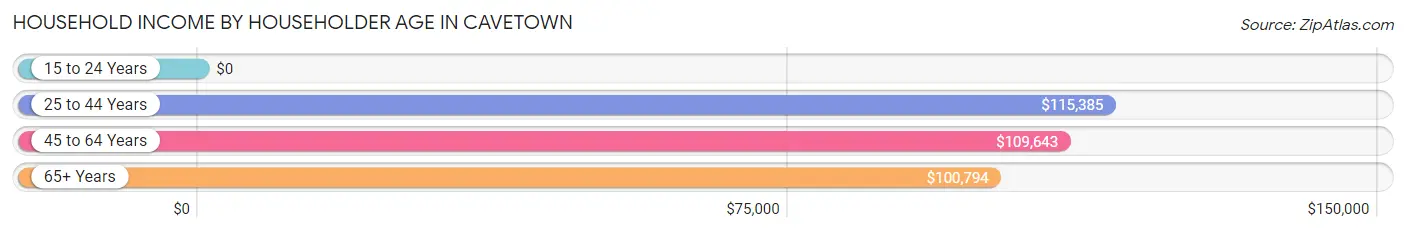
Household Income by Householder Age in Cavetown
The median household income in Cavetown is $101,706, with the highest median household income of $115,385 found in the 25 to 44 years age bracket for the primary householder. A total of 86 households (22.2%) fall into this category. Meanwhile, the 15 to 24 years age bracket for the primary householder has the lowest median household income of $0, with 8 households (2.1%) in this group.
| Income Bracket | # Households | Median Income |
| 15 to 24 Years | 8 (2.1%) | $0 |
| 25 to 44 Years | 86 (22.2%) | $115,385 |
| 45 to 64 Years | 106 (27.3%) | $109,643 |
| 65+ Years | 188 (48.4%) | $100,794 |
| Total | 388 (100.0%) | $101,706 |
Poverty in Cavetown
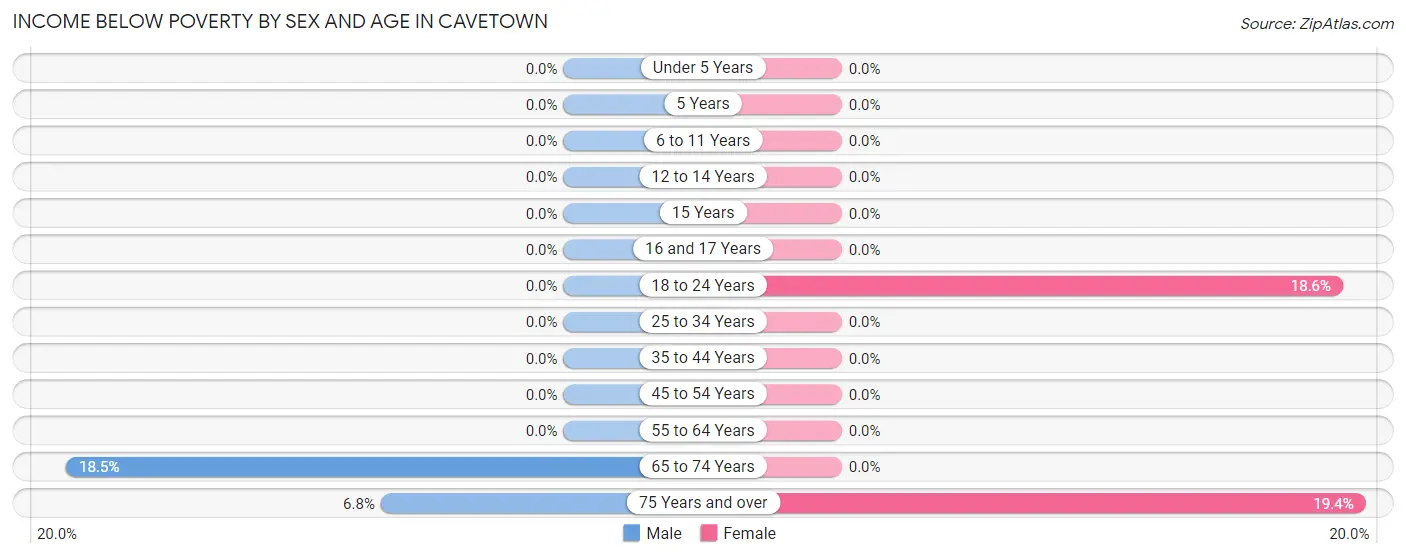
Income Below Poverty by Sex and Age in Cavetown
With 4.1% poverty level for males and 3.0% for females among the residents of Cavetown, 65 to 74 year old males and 75 year old and over females are the most vulnerable to poverty, with 12 males (18.5%) and 7 females (19.4%) in their respective age groups living below the poverty level.
| Age Bracket | Male | Female |
| Under 5 Years | 0 (0.0%) | 0 (0.0%) |
| 5 Years | 0 (0.0%) | 0 (0.0%) |
| 6 to 11 Years | 0 (0.0%) | 0 (0.0%) |
| 12 to 14 Years | 0 (0.0%) | 0 (0.0%) |
| 15 Years | 0 (0.0%) | 0 (0.0%) |
| 16 and 17 Years | 0 (0.0%) | 0 (0.0%) |
| 18 to 24 Years | 0 (0.0%) | 8 (18.6%) |
| 25 to 34 Years | 0 (0.0%) | 0 (0.0%) |
| 35 to 44 Years | 0 (0.0%) | 0 (0.0%) |
| 45 to 54 Years | 0 (0.0%) | 0 (0.0%) |
| 55 to 64 Years | 0 (0.0%) | 0 (0.0%) |
| 65 to 74 Years | 12 (18.5%) | 0 (0.0%) |
| 75 Years and over | 8 (6.8%) | 7 (19.4%) |
| Total | 20 (4.1%) | 15 (3.0%) |
Income Above Poverty by Sex and Age in Cavetown
According to the poverty statistics in Cavetown, males aged under 5 years and females aged under 5 years are the age groups that are most secure financially, with 100.0% of males and 100.0% of females in these age groups living above the poverty line.
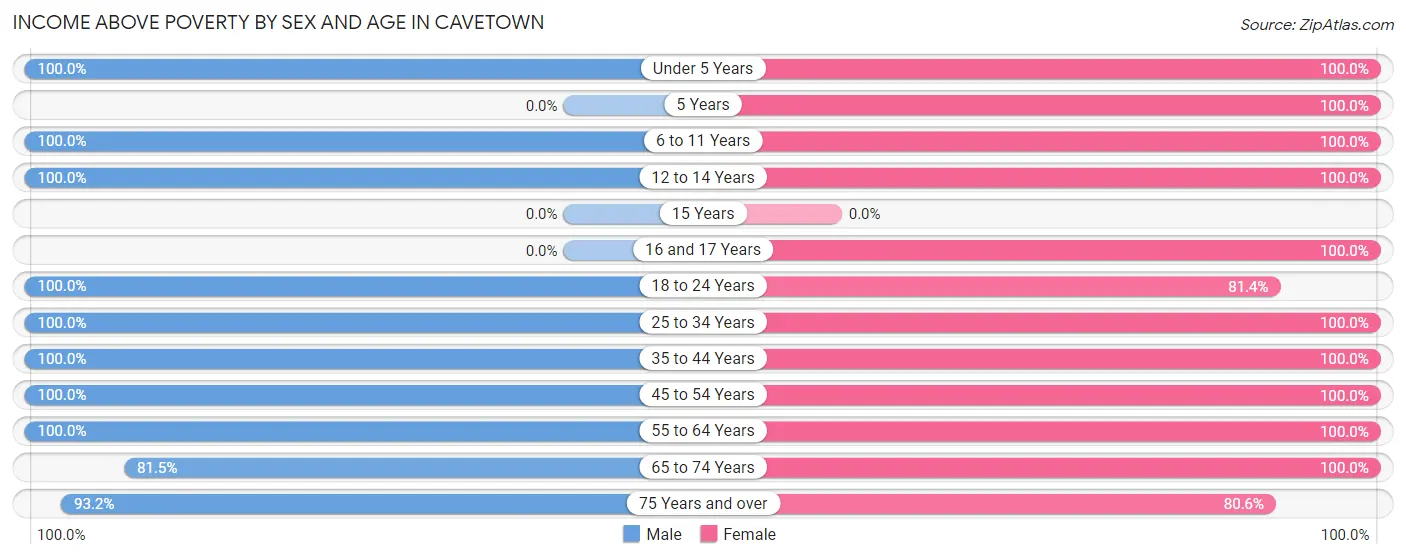
| Age Bracket | Male | Female |
| Under 5 Years | 14 (100.0%) | 18 (100.0%) |
| 5 Years | 0 (0.0%) | 9 (100.0%) |
| 6 to 11 Years | 9 (100.0%) | 41 (100.0%) |
| 12 to 14 Years | 23 (100.0%) | 13 (100.0%) |
| 15 Years | 0 (0.0%) | 0 (0.0%) |
| 16 and 17 Years | 0 (0.0%) | 6 (100.0%) |
| 18 to 24 Years | 40 (100.0%) | 35 (81.4%) |
| 25 to 34 Years | 60 (100.0%) | 58 (100.0%) |
| 35 to 44 Years | 44 (100.0%) | 29 (100.0%) |
| 45 to 54 Years | 31 (100.0%) | 30 (100.0%) |
| 55 to 64 Years | 79 (100.0%) | 98 (100.0%) |
| 65 to 74 Years | 53 (81.5%) | 110 (100.0%) |
| 75 Years and over | 110 (93.2%) | 29 (80.6%) |
| Total | 463 (95.9%) | 476 (97.0%) |
Income Below Poverty Among Married-Couple Families in Cavetown
The poverty statistics for married-couple families in Cavetown show that 2.1% or 7 of the total 329 families live below the poverty line. Families with no children have the highest poverty rate of 2.8%, comprising of 7 families. On the other hand, families with 1 or 2 children have the lowest poverty rate of 0.0%, which includes 0 families.
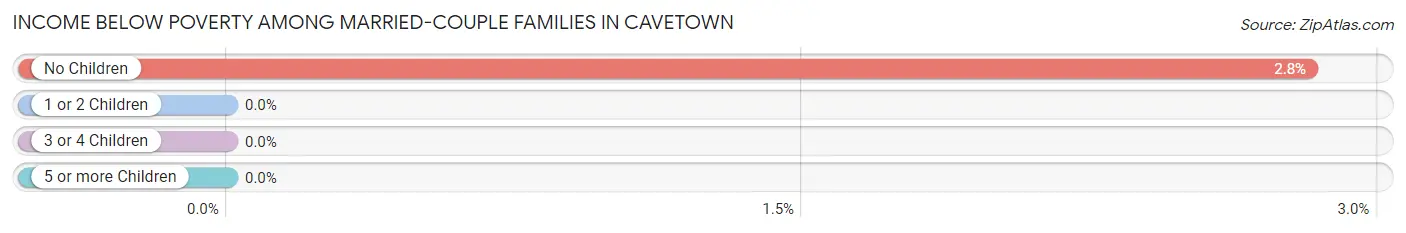
| Children | Above Poverty | Below Poverty |
| No Children | 241 (97.2%) | 7 (2.8%) |
| 1 or 2 Children | 56 (100.0%) | 0 (0.0%) |
| 3 or 4 Children | 25 (100.0%) | 0 (0.0%) |
| 5 or more Children | 0 (0.0%) | 0 (0.0%) |
| Total | 322 (97.9%) | 7 (2.1%) |
Income Below Poverty Among Single-Parent Households in Cavetown
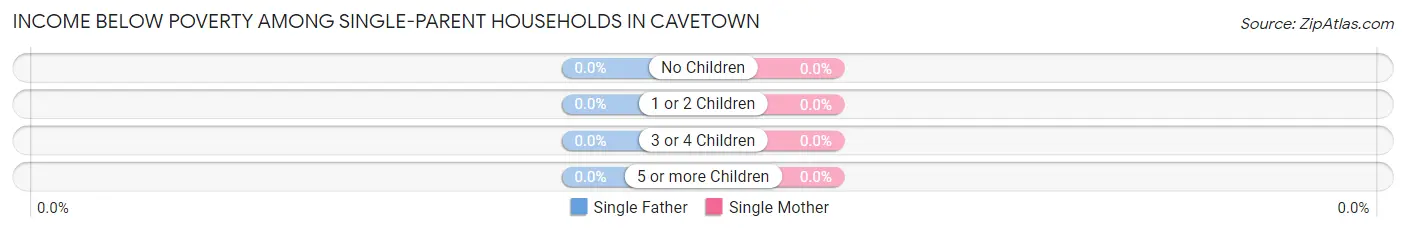
| Children | Single Father | Single Mother |
| No Children | 0 (0.0%) | 0 (0.0%) |
| 1 or 2 Children | 0 (0.0%) | 0 (0.0%) |
| 3 or 4 Children | 0 (0.0%) | 0 (0.0%) |
| 5 or more Children | 0 (0.0%) | 0 (0.0%) |
| Total | 0 (0.0%) | 0 (0.0%) |
Income Below Poverty Among Married-Couple vs Single-Parent Households in Cavetown
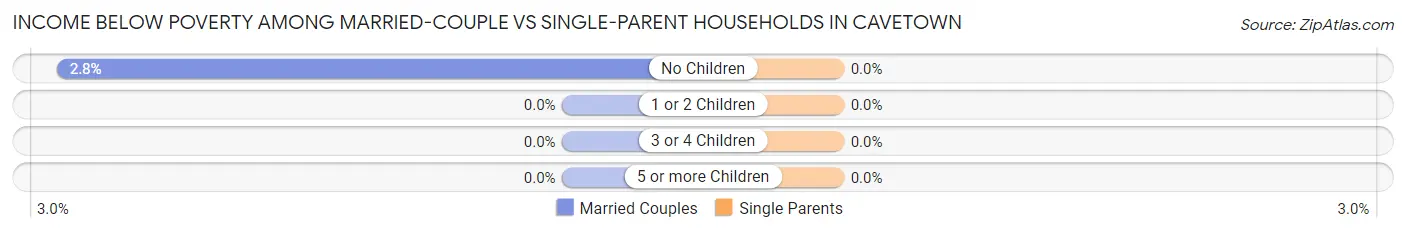
| Children | Married-Couple Families | Single-Parent Households |
| No Children | 7 (2.8%) | 0 (0.0%) |
| 1 or 2 Children | 0 (0.0%) | 0 (0.0%) |
| 3 or 4 Children | 0 (0.0%) | 0 (0.0%) |
| 5 or more Children | 0 (0.0%) | 0 (0.0%) |
| Total | 7 (2.1%) | 0 (0.0%) |
Employment Characteristics in Cavetown
Employment by Class of Employer in Cavetown
Among the 408 employed individuals in Cavetown, private company employees (216 | 52.9%), state government employees (48 | 11.8%), and not-for-profit organizations (47 | 11.5%) make up the most common classes of employment.
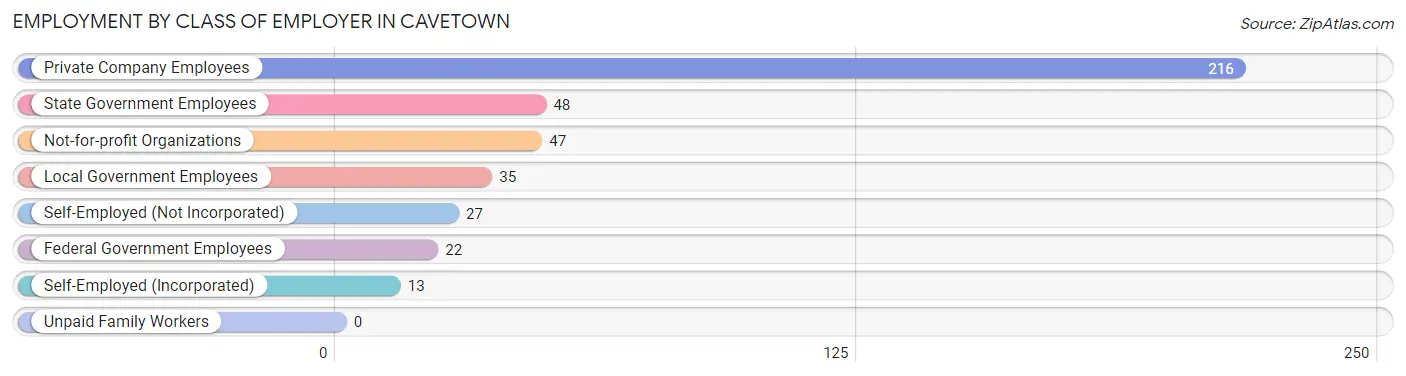
| Employer Class | # Employees | % Employees |
| Private Company Employees | 216 | 52.9% |
| Self-Employed (Incorporated) | 13 | 3.2% |
| Self-Employed (Not Incorporated) | 27 | 6.6% |
| Not-for-profit Organizations | 47 | 11.5% |
| Local Government Employees | 35 | 8.6% |
| State Government Employees | 48 | 11.8% |
| Federal Government Employees | 22 | 5.4% |
| Unpaid Family Workers | 0 | 0.0% |
| Total | 408 | 100.0% |
Employment Status by Age in Cavetown
According to the labor force statistics for Cavetown, out of the total population over 16 years of age (847), 49.8% or 422 individuals are in the labor force, with 2.1% or 9 of them unemployed. The age group with the highest labor force participation rate is 30 to 34 years, with 100.0% or 48 individuals in the labor force. Within the labor force, the 65 to 74 years age range has the highest percentage of unemployed individuals, with 39.1% or 9 of them being unemployed.
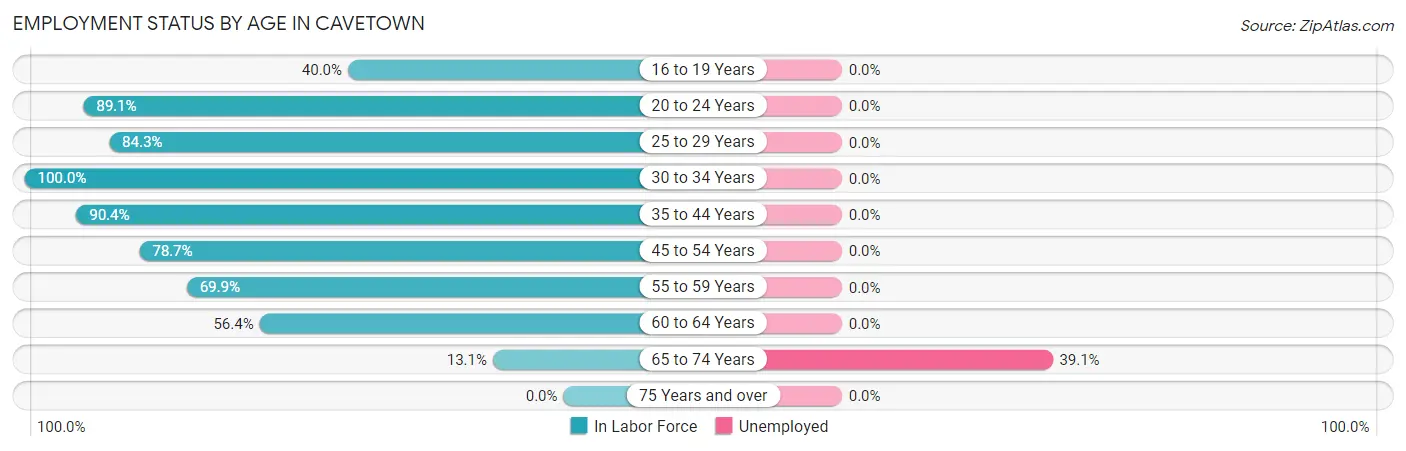
| Age Bracket | In Labor Force | Unemployed |
| 16 to 19 Years | 10 (40.0%) | 0 (0.0%) |
| 20 to 24 Years | 57 (89.1%) | 0 (0.0%) |
| 25 to 29 Years | 59 (84.3%) | 0 (0.0%) |
| 30 to 34 Years | 48 (100.0%) | 0 (0.0%) |
| 35 to 44 Years | 66 (90.4%) | 0 (0.0%) |
| 45 to 54 Years | 48 (78.7%) | 0 (0.0%) |
| 55 to 59 Years | 58 (69.9%) | 0 (0.0%) |
| 60 to 64 Years | 53 (56.4%) | 0 (0.0%) |
| 65 to 74 Years | 23 (13.1%) | 9 (39.1%) |
| 75 Years and over | 0 (0.0%) | 0 (0.0%) |
| Total | 422 (49.8%) | 9 (2.1%) |
Employment Status by Educational Attainment in Cavetown
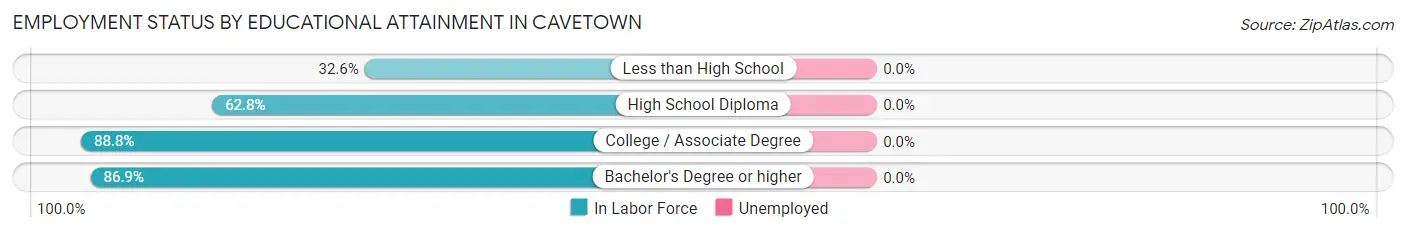
| Educational Attainment | In Labor Force | Unemployed |
| Less than High School | 14 (32.6%) | 0 (0.0%) |
| High School Diploma | 54 (62.8%) | 0 (0.0%) |
| College / Associate Degree | 158 (88.8%) | 0 (0.0%) |
| Bachelor's Degree or higher | 106 (86.9%) | 0 (0.0%) |
| Total | 332 (77.4%) | 0 (0.0%) |
Employment Occupations by Sex in Cavetown
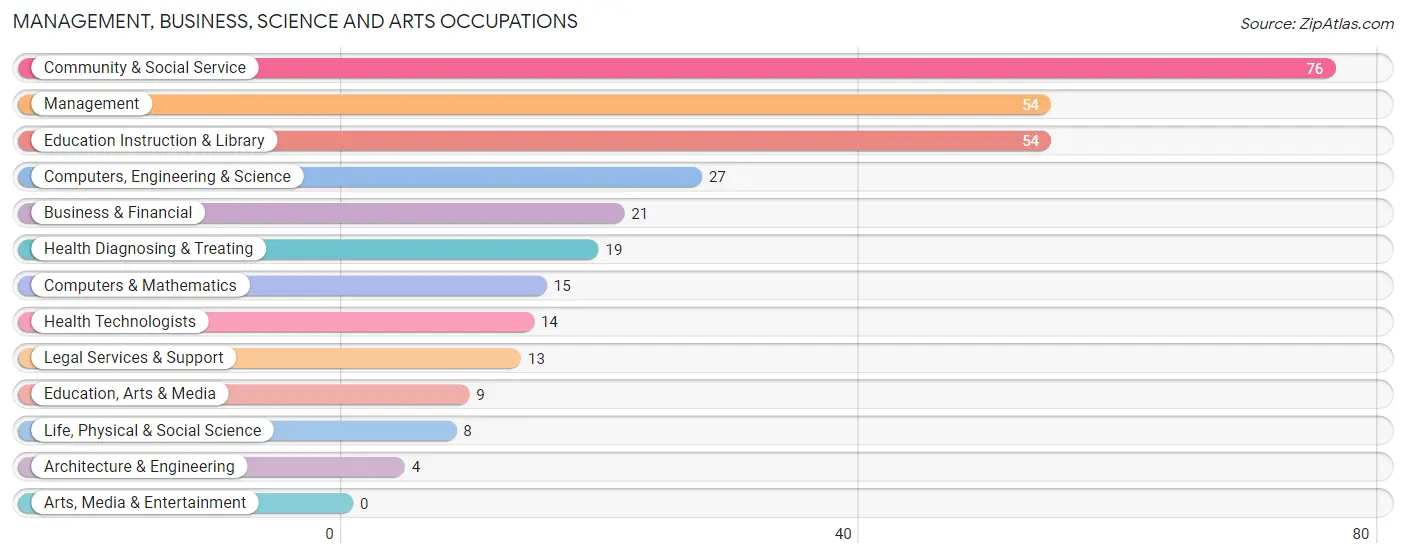
Management, Business, Science and Arts Occupations
The most common Management, Business, Science and Arts occupations in Cavetown are Community & Social Service (76 | 18.4%), Management (54 | 13.1%), Education Instruction & Library (54 | 13.1%), Computers, Engineering & Science (27 | 6.5%), and Business & Financial (21 | 5.1%).
Management, Business, Science and Arts Occupations by Sex
Within the Management, Business, Science and Arts occupations in Cavetown, the most male-oriented occupations are Computers & Mathematics (100.0%), Architecture & Engineering (100.0%), and Education, Arts & Media (100.0%), while the most female-oriented occupations are Life, Physical & Social Science (100.0%), Health Diagnosing & Treating (100.0%), and Health Technologists (100.0%).
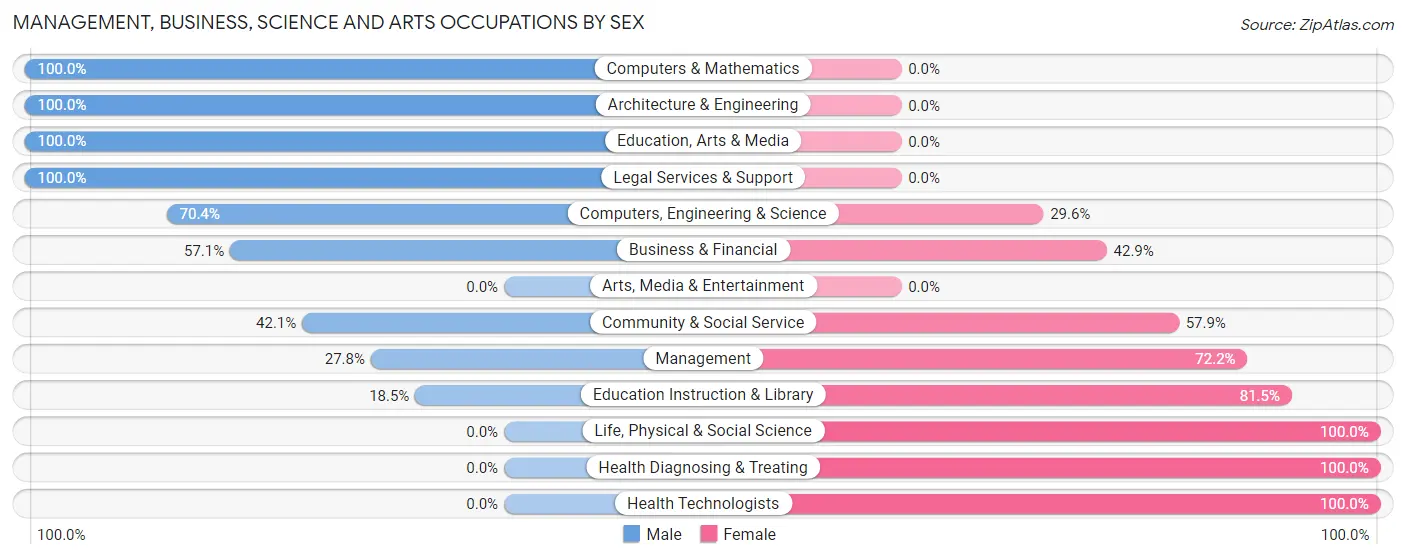
| Occupation | Male | Female |
| Management | 15 (27.8%) | 39 (72.2%) |
| Business & Financial | 12 (57.1%) | 9 (42.9%) |
| Computers, Engineering & Science | 19 (70.4%) | 8 (29.6%) |
| Computers & Mathematics | 15 (100.0%) | 0 (0.0%) |
| Architecture & Engineering | 4 (100.0%) | 0 (0.0%) |
| Life, Physical & Social Science | 0 (0.0%) | 8 (100.0%) |
| Community & Social Service | 32 (42.1%) | 44 (57.9%) |
| Education, Arts & Media | 9 (100.0%) | 0 (0.0%) |
| Legal Services & Support | 13 (100.0%) | 0 (0.0%) |
| Education Instruction & Library | 10 (18.5%) | 44 (81.5%) |
| Arts, Media & Entertainment | 0 (0.0%) | 0 (0.0%) |
| Health Diagnosing & Treating | 0 (0.0%) | 19 (100.0%) |
| Health Technologists | 0 (0.0%) | 14 (100.0%) |
| Total (Category) | 78 (39.6%) | 119 (60.4%) |
| Total (Overall) | 235 (56.9%) | 178 (43.1%) |
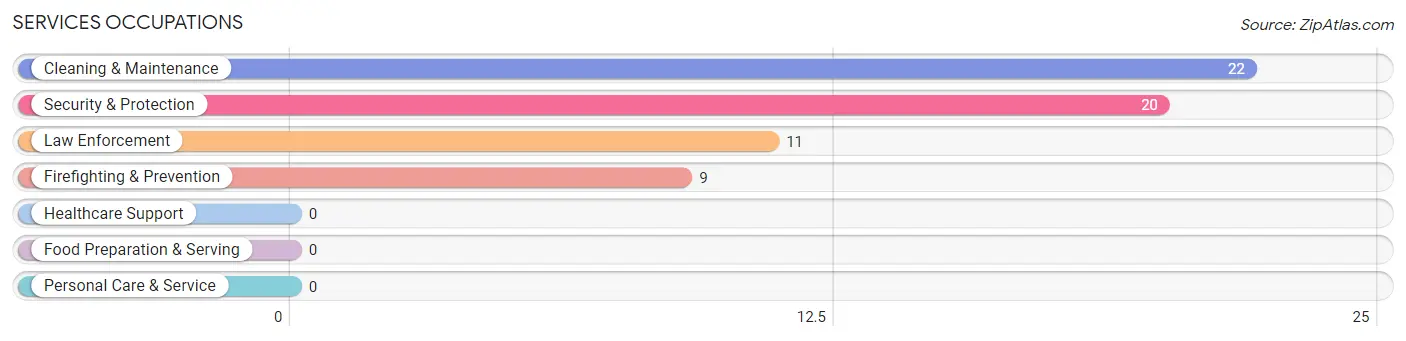
Services Occupations
The most common Services occupations in Cavetown are Cleaning & Maintenance (22 | 5.3%), Security & Protection (20 | 4.8%), Law Enforcement (11 | 2.7%), and Firefighting & Prevention (9 | 2.2%).
Services Occupations by Sex
Within the Services occupations in Cavetown, the most male-oriented occupations are Firefighting & Prevention (100.0%), Security & Protection (80.0%), and Law Enforcement (63.6%), while the most female-oriented occupations are Cleaning & Maintenance (45.5%), Law Enforcement (36.4%), and Security & Protection (20.0%).
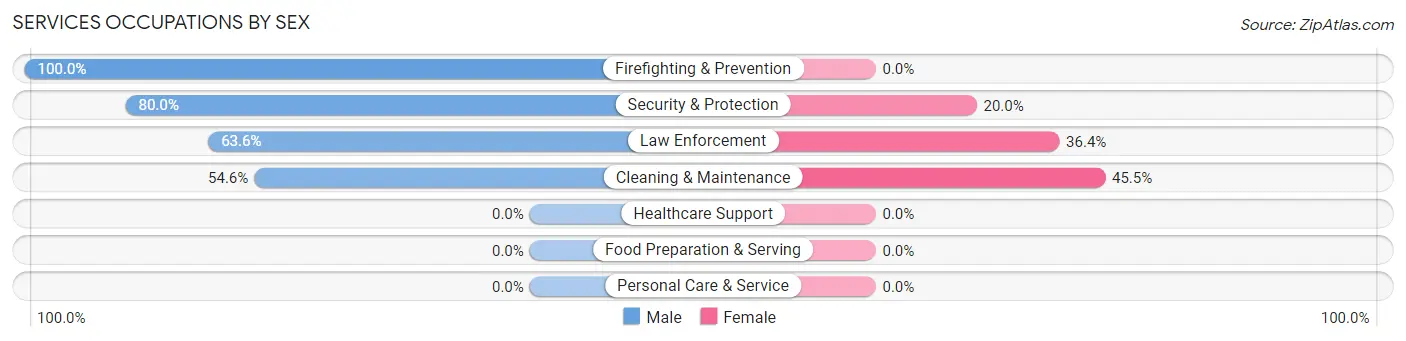
| Occupation | Male | Female |
| Healthcare Support | 0 (0.0%) | 0 (0.0%) |
| Security & Protection | 16 (80.0%) | 4 (20.0%) |
| Firefighting & Prevention | 9 (100.0%) | 0 (0.0%) |
| Law Enforcement | 7 (63.6%) | 4 (36.4%) |
| Food Preparation & Serving | 0 (0.0%) | 0 (0.0%) |
| Cleaning & Maintenance | 12 (54.5%) | 10 (45.5%) |
| Personal Care & Service | 0 (0.0%) | 0 (0.0%) |
| Total (Category) | 28 (66.7%) | 14 (33.3%) |
| Total (Overall) | 235 (56.9%) | 178 (43.1%) |
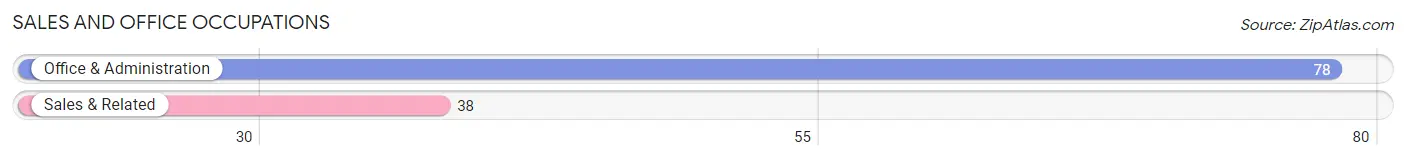
Sales and Office Occupations
The most common Sales and Office occupations in Cavetown are Office & Administration (78 | 18.9%), and Sales & Related (38 | 9.2%).
Sales and Office Occupations by Sex
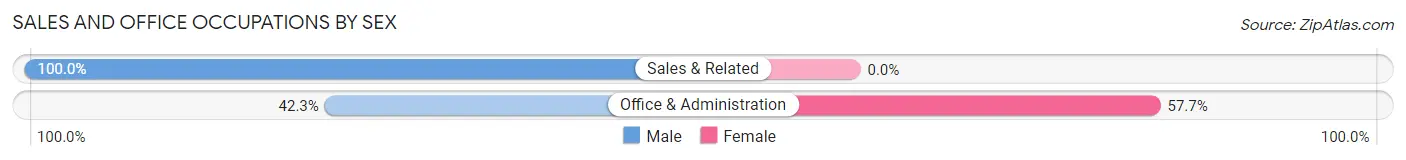
| Occupation | Male | Female |
| Sales & Related | 38 (100.0%) | 0 (0.0%) |
| Office & Administration | 33 (42.3%) | 45 (57.7%) |
| Total (Category) | 71 (61.2%) | 45 (38.8%) |
| Total (Overall) | 235 (56.9%) | 178 (43.1%) |
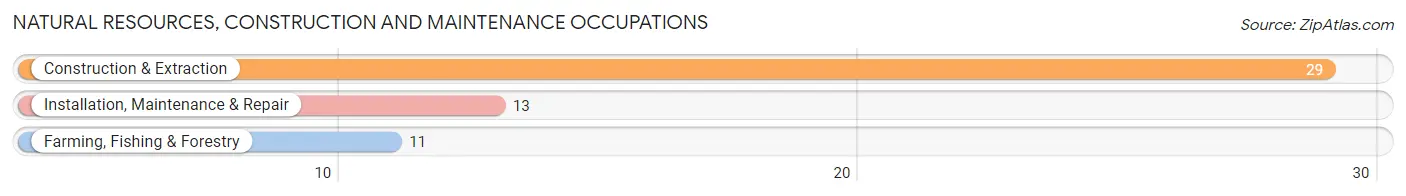
Natural Resources, Construction and Maintenance Occupations
The most common Natural Resources, Construction and Maintenance occupations in Cavetown are Construction & Extraction (29 | 7.0%), Installation, Maintenance & Repair (13 | 3.2%), and Farming, Fishing & Forestry (11 | 2.7%).
Natural Resources, Construction and Maintenance Occupations by Sex
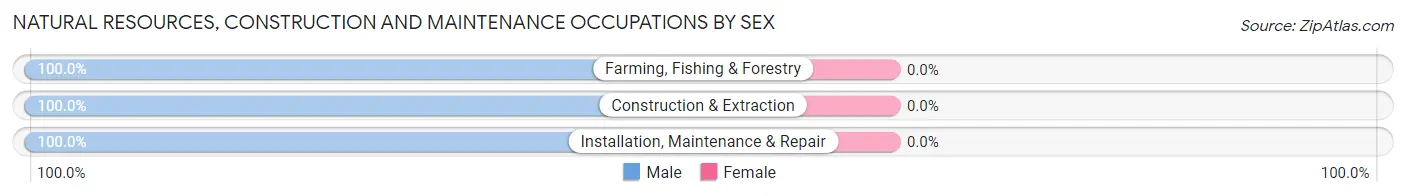
| Occupation | Male | Female |
| Farming, Fishing & Forestry | 11 (100.0%) | 0 (0.0%) |
| Construction & Extraction | 29 (100.0%) | 0 (0.0%) |
| Installation, Maintenance & Repair | 13 (100.0%) | 0 (0.0%) |
| Total (Category) | 53 (100.0%) | 0 (0.0%) |
| Total (Overall) | 235 (56.9%) | 178 (43.1%) |
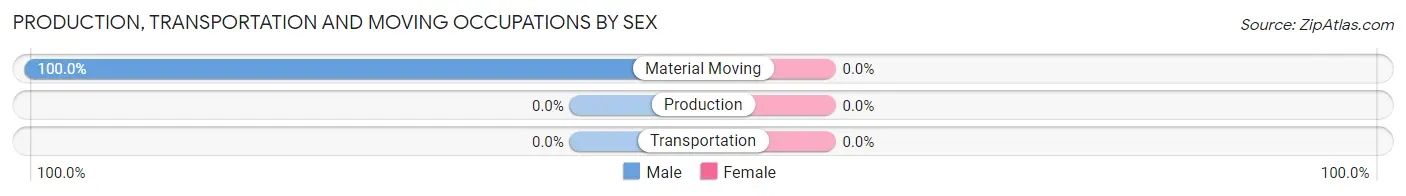
Production, Transportation and Moving Occupations
The most common Production, Transportation and Moving occupations in Cavetown are , and Material Moving (5 | 1.2%).
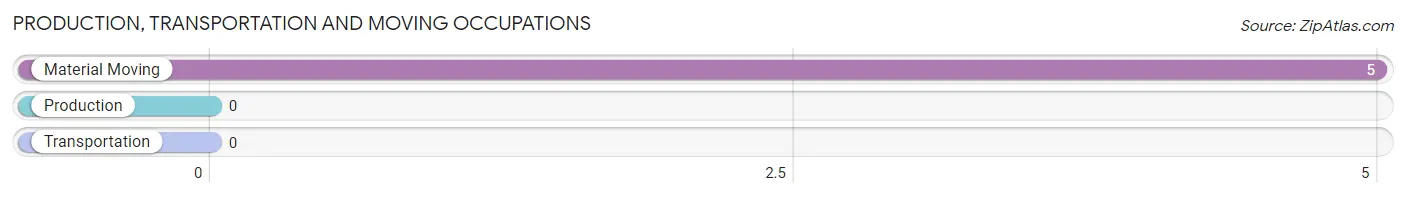
Production, Transportation and Moving Occupations by Sex
| Occupation | Male | Female |
| Production | 0 (0.0%) | 0 (0.0%) |
| Transportation | 0 (0.0%) | 0 (0.0%) |
| Material Moving | 5 (100.0%) | 0 (0.0%) |
| Total (Category) | 5 (100.0%) | 0 (0.0%) |
| Total (Overall) | 235 (56.9%) | 178 (43.1%) |
Employment Industries by Sex in Cavetown
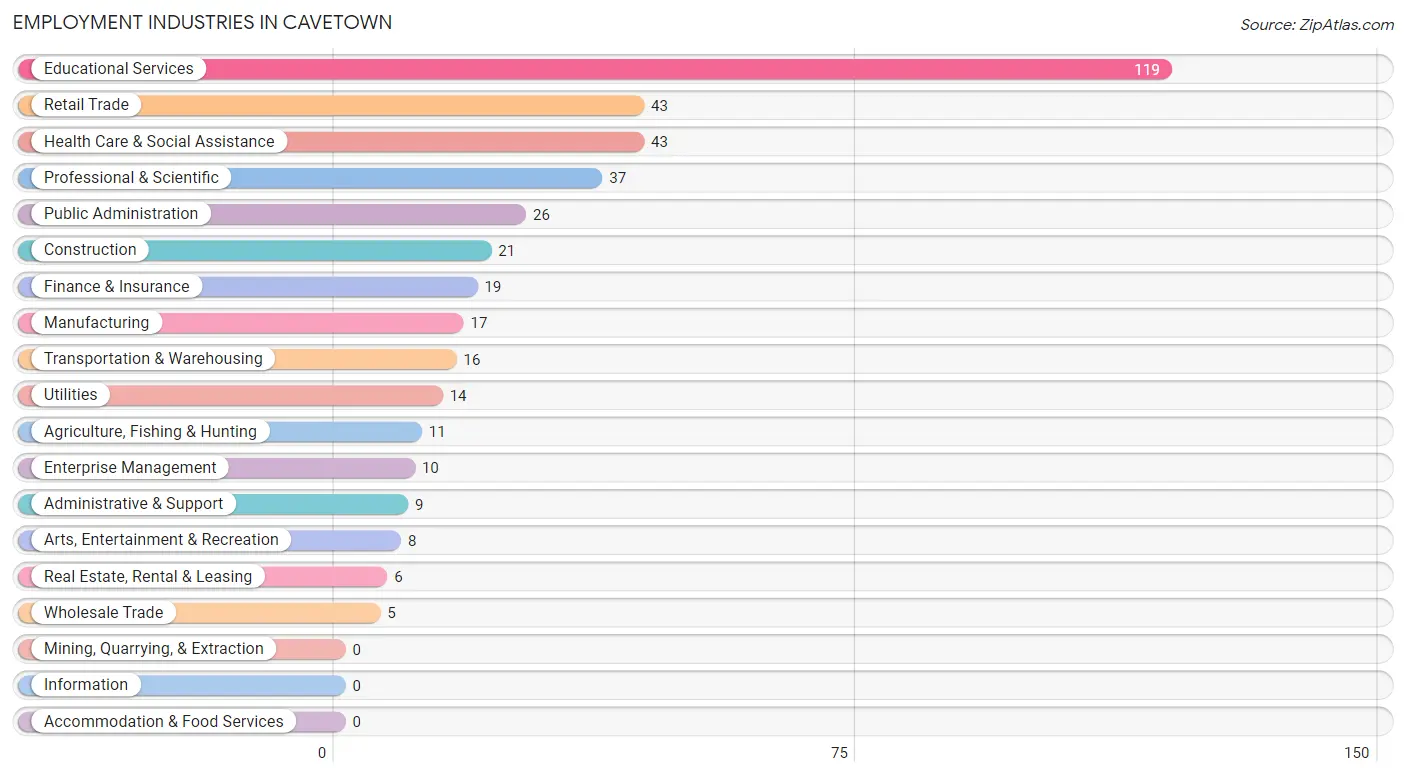
Employment Industries in Cavetown
The major employment industries in Cavetown include Educational Services (119 | 28.8%), Retail Trade (43 | 10.4%), Health Care & Social Assistance (43 | 10.4%), Professional & Scientific (37 | 9.0%), and Public Administration (26 | 6.3%).
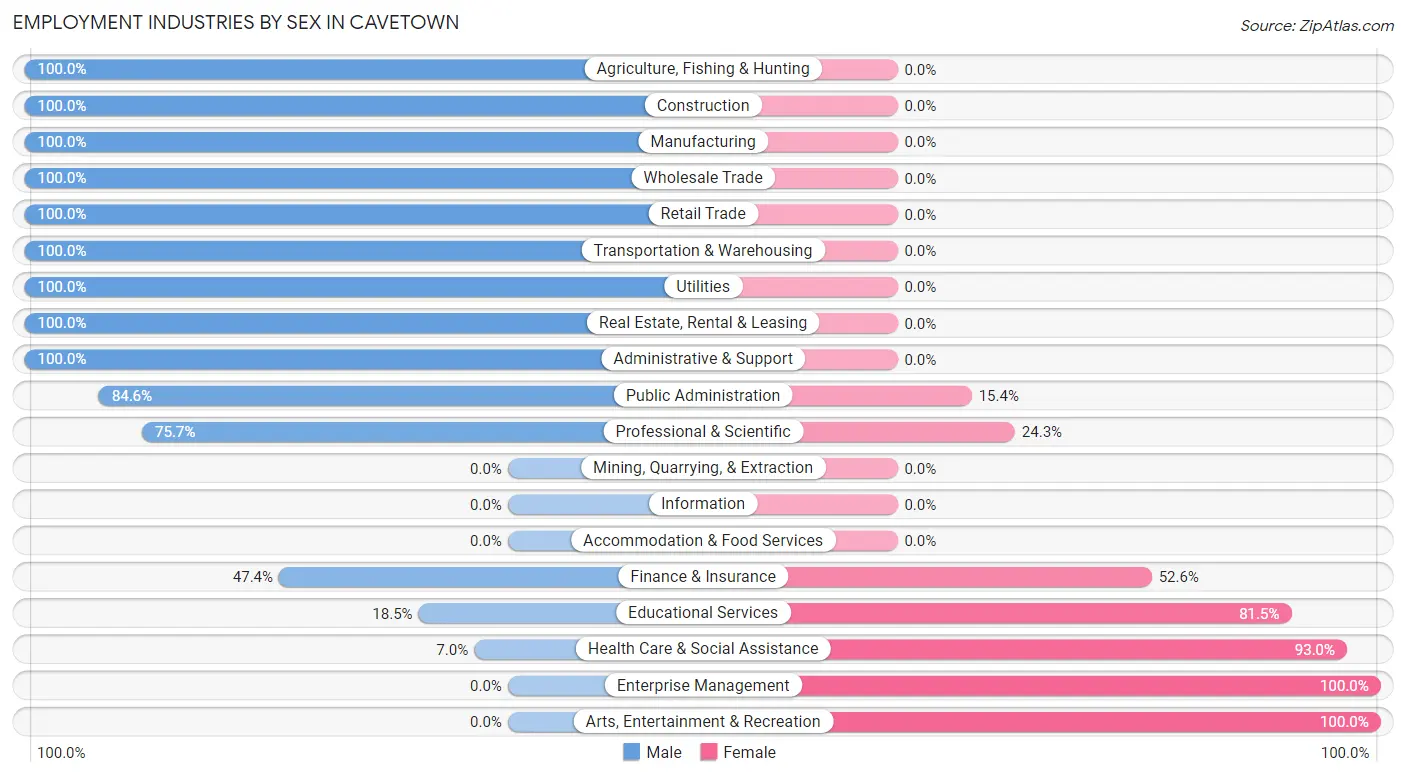
Employment Industries by Sex in Cavetown
The Cavetown industries that see more men than women are Agriculture, Fishing & Hunting (100.0%), Construction (100.0%), and Manufacturing (100.0%), whereas the industries that tend to have a higher number of women are Enterprise Management (100.0%), Arts, Entertainment & Recreation (100.0%), and Health Care & Social Assistance (93.0%).
| Industry | Male | Female |
| Agriculture, Fishing & Hunting | 11 (100.0%) | 0 (0.0%) |
| Mining, Quarrying, & Extraction | 0 (0.0%) | 0 (0.0%) |
| Construction | 21 (100.0%) | 0 (0.0%) |
| Manufacturing | 17 (100.0%) | 0 (0.0%) |
| Wholesale Trade | 5 (100.0%) | 0 (0.0%) |
| Retail Trade | 43 (100.0%) | 0 (0.0%) |
| Transportation & Warehousing | 16 (100.0%) | 0 (0.0%) |
| Utilities | 14 (100.0%) | 0 (0.0%) |
| Information | 0 (0.0%) | 0 (0.0%) |
| Finance & Insurance | 9 (47.4%) | 10 (52.6%) |
| Real Estate, Rental & Leasing | 6 (100.0%) | 0 (0.0%) |
| Professional & Scientific | 28 (75.7%) | 9 (24.3%) |
| Enterprise Management | 0 (0.0%) | 10 (100.0%) |
| Administrative & Support | 9 (100.0%) | 0 (0.0%) |
| Educational Services | 22 (18.5%) | 97 (81.5%) |
| Health Care & Social Assistance | 3 (7.0%) | 40 (93.0%) |
| Arts, Entertainment & Recreation | 0 (0.0%) | 8 (100.0%) |
| Accommodation & Food Services | 0 (0.0%) | 0 (0.0%) |
| Public Administration | 22 (84.6%) | 4 (15.4%) |
| Total | 235 (56.9%) | 178 (43.1%) |
Education in Cavetown
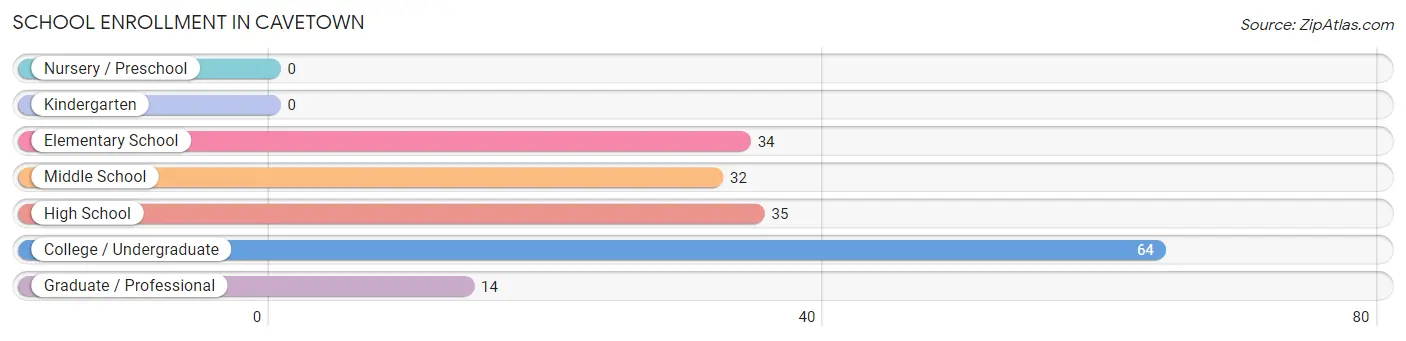
School Enrollment in Cavetown
The most common levels of schooling among the 179 students in Cavetown are college / undergraduate (64 | 35.7%), high school (35 | 19.6%), and elementary school (34 | 19.0%).
| School Level | # Students | % Students |
| Nursery / Preschool | 0 | 0.0% |
| Kindergarten | 0 | 0.0% |
| Elementary School | 34 | 19.0% |
| Middle School | 32 | 17.9% |
| High School | 35 | 19.6% |
| College / Undergraduate | 64 | 35.7% |
| Graduate / Professional | 14 | 7.8% |
| Total | 179 | 100.0% |
School Enrollment by Age by Funding Source in Cavetown
Out of a total of 179 students who are enrolled in schools in Cavetown, 31 (17.3%) attend a private institution, while the remaining 148 (82.7%) are enrolled in public schools. The age group of 20 to 24 year olds has the highest likelihood of being enrolled in private schools, with 15 (100.0% in the age bracket) enrolled. Conversely, the age group of 5 to 9 year old has the lowest likelihood of being enrolled in a private school, with 25 (100.0% in the age bracket) attending a public institution.
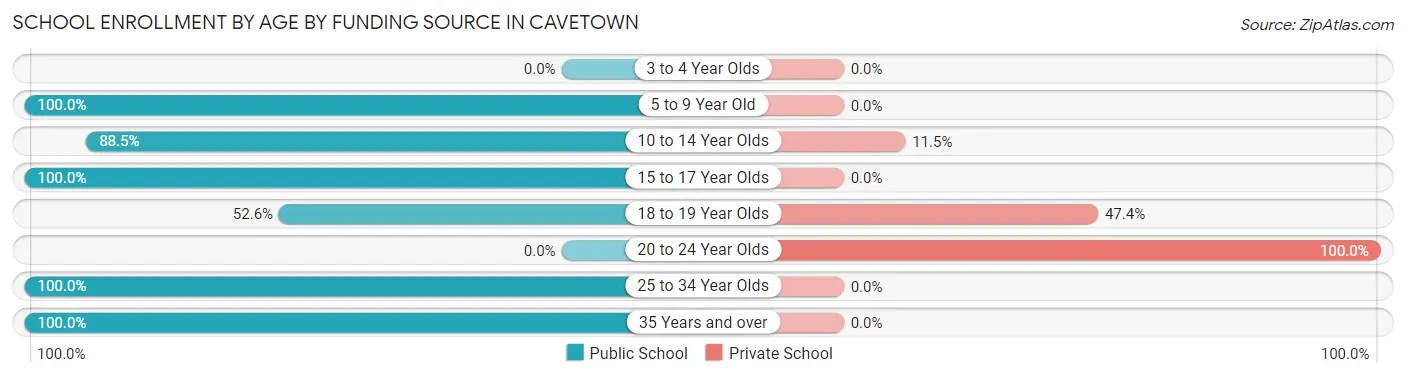
| Age Bracket | Public School | Private School |
| 3 to 4 Year Olds | 0 (0.0%) | 0 (0.0%) |
| 5 to 9 Year Old | 25 (100.0%) | 0 (0.0%) |
| 10 to 14 Year Olds | 54 (88.5%) | 7 (11.5%) |
| 15 to 17 Year Olds | 6 (100.0%) | 0 (0.0%) |
| 18 to 19 Year Olds | 10 (52.6%) | 9 (47.4%) |
| 20 to 24 Year Olds | 0 (0.0%) | 15 (100.0%) |
| 25 to 34 Year Olds | 47 (100.0%) | 0 (0.0%) |
| 35 Years and over | 6 (100.0%) | 0 (0.0%) |
| Total | 148 (82.7%) | 31 (17.3%) |
Educational Attainment by Field of Study in Cavetown
Education (38 | 23.6%), social sciences (23 | 14.3%), literature & languages (16 | 9.9%), liberal arts & history (15 | 9.3%), and bio, nature & agricultural (14 | 8.7%) are the most common fields of study among 161 individuals in Cavetown who have obtained a bachelor's degree or higher.
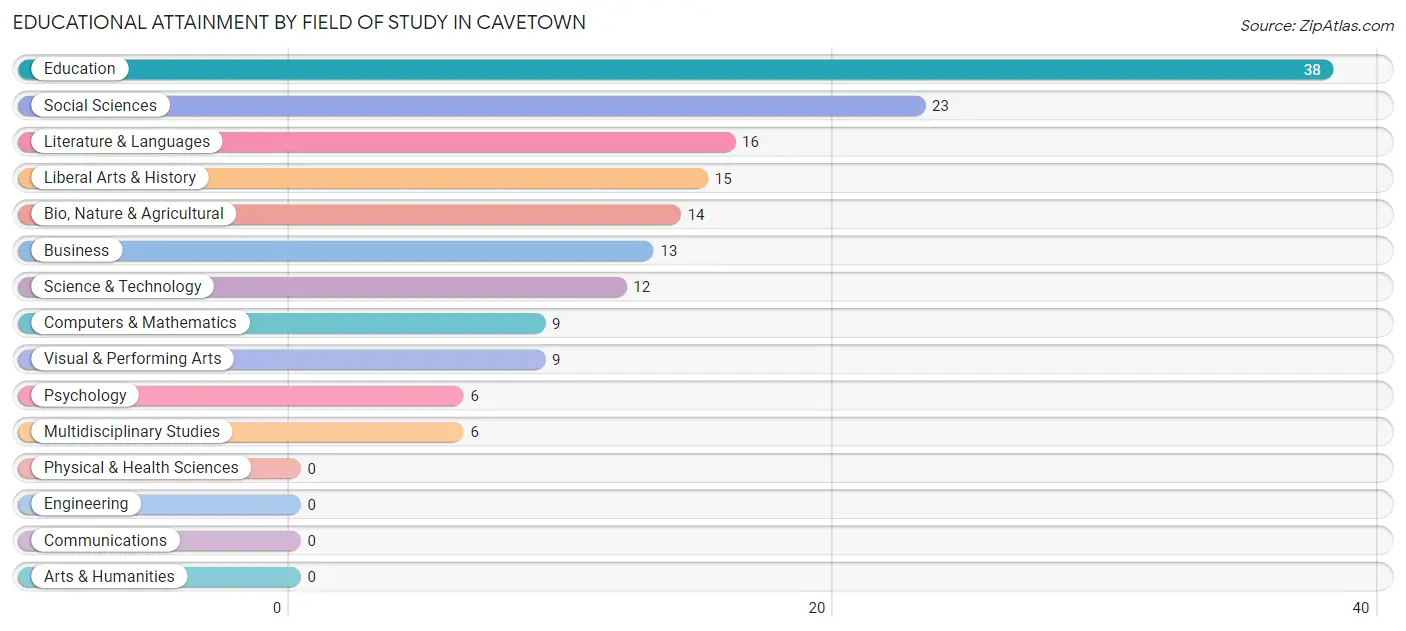
| Field of Study | # Graduates | % Graduates |
| Computers & Mathematics | 9 | 5.6% |
| Bio, Nature & Agricultural | 14 | 8.7% |
| Physical & Health Sciences | 0 | 0.0% |
| Psychology | 6 | 3.7% |
| Social Sciences | 23 | 14.3% |
| Engineering | 0 | 0.0% |
| Multidisciplinary Studies | 6 | 3.7% |
| Science & Technology | 12 | 7.4% |
| Business | 13 | 8.1% |
| Education | 38 | 23.6% |
| Literature & Languages | 16 | 9.9% |
| Liberal Arts & History | 15 | 9.3% |
| Visual & Performing Arts | 9 | 5.6% |
| Communications | 0 | 0.0% |
| Arts & Humanities | 0 | 0.0% |
| Total | 161 | 100.0% |
Transportation & Commute in Cavetown
Vehicle Availability by Sex in Cavetown
The most prevalent vehicle ownership categories in Cavetown are males with 2 vehicles (124, accounting for 53.9%) and females with 2 vehicles (87, making up 69.7%).
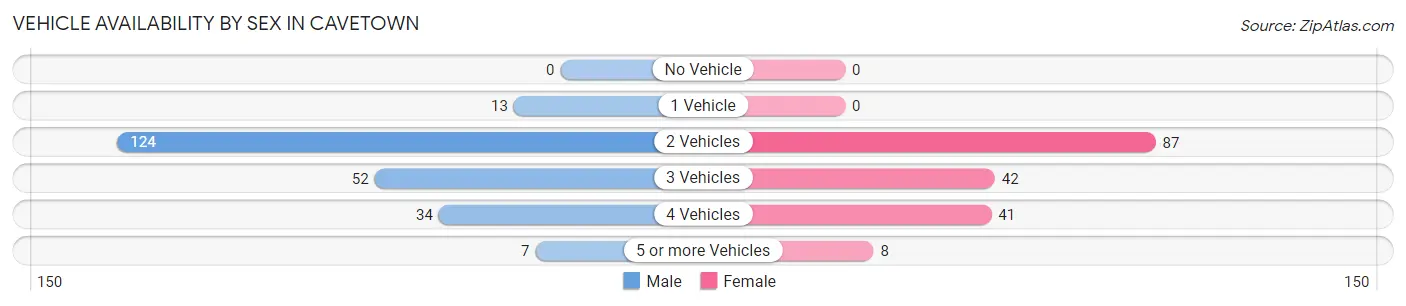
| Vehicles Available | Male | Female |
| No Vehicle | 0 (0.0%) | 0 (0.0%) |
| 1 Vehicle | 13 (5.7%) | 0 (0.0%) |
| 2 Vehicles | 124 (53.9%) | 87 (48.9%) |
| 3 Vehicles | 52 (22.6%) | 42 (23.6%) |
| 4 Vehicles | 34 (14.8%) | 41 (23.0%) |
| 5 or more Vehicles | 7 (3.0%) | 8 (4.5%) |
| Total | 230 (100.0%) | 178 (100.0%) |
Commute Time in Cavetown
The most frequently occuring commute durations in Cavetown are 15 to 19 minutes (84 commuters, 22.8%), 20 to 24 minutes (76 commuters, 20.6%), and 25 to 29 minutes (41 commuters, 11.1%).
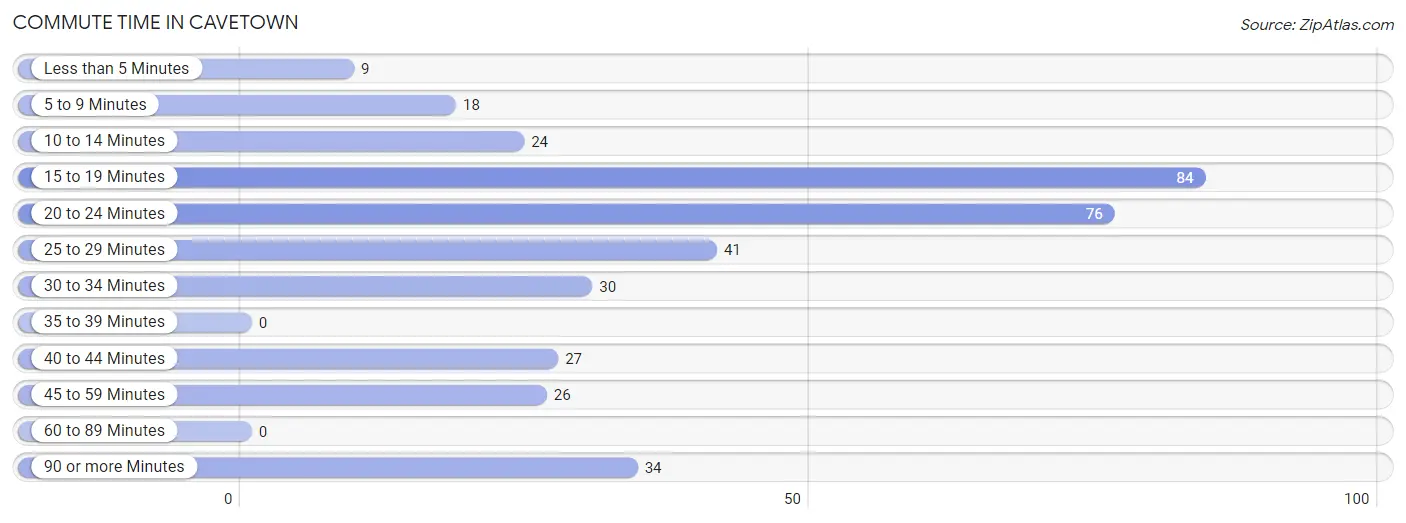
| Commute Time | # Commuters | % Commuters |
| Less than 5 Minutes | 9 | 2.4% |
| 5 to 9 Minutes | 18 | 4.9% |
| 10 to 14 Minutes | 24 | 6.5% |
| 15 to 19 Minutes | 84 | 22.8% |
| 20 to 24 Minutes | 76 | 20.6% |
| 25 to 29 Minutes | 41 | 11.1% |
| 30 to 34 Minutes | 30 | 8.1% |
| 35 to 39 Minutes | 0 | 0.0% |
| 40 to 44 Minutes | 27 | 7.3% |
| 45 to 59 Minutes | 26 | 7.0% |
| 60 to 89 Minutes | 0 | 0.0% |
| 90 or more Minutes | 34 | 9.2% |
Commute Time by Sex in Cavetown
The most common commute times in Cavetown are 20 to 24 minutes (66 commuters, 32.0%) for males and 15 to 19 minutes (58 commuters, 35.6%) for females.
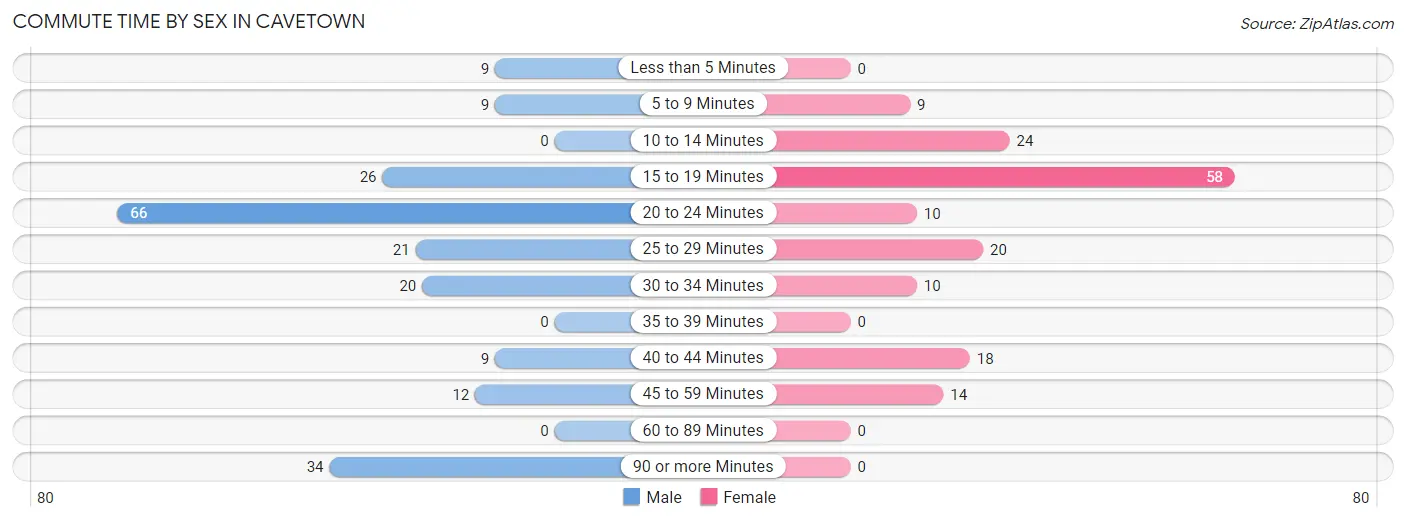
| Commute Time | Male | Female |
| Less than 5 Minutes | 9 (4.4%) | 0 (0.0%) |
| 5 to 9 Minutes | 9 (4.4%) | 9 (5.5%) |
| 10 to 14 Minutes | 0 (0.0%) | 24 (14.7%) |
| 15 to 19 Minutes | 26 (12.6%) | 58 (35.6%) |
| 20 to 24 Minutes | 66 (32.0%) | 10 (6.1%) |
| 25 to 29 Minutes | 21 (10.2%) | 20 (12.3%) |
| 30 to 34 Minutes | 20 (9.7%) | 10 (6.1%) |
| 35 to 39 Minutes | 0 (0.0%) | 0 (0.0%) |
| 40 to 44 Minutes | 9 (4.4%) | 18 (11.0%) |
| 45 to 59 Minutes | 12 (5.8%) | 14 (8.6%) |
| 60 to 89 Minutes | 0 (0.0%) | 0 (0.0%) |
| 90 or more Minutes | 34 (16.5%) | 0 (0.0%) |
Time of Departure to Work by Sex in Cavetown
The most frequent times of departure to work in Cavetown are 7:00 AM to 7:29 AM (43, 20.9%) for males and 6:30 AM to 6:59 AM (52, 31.9%) for females.
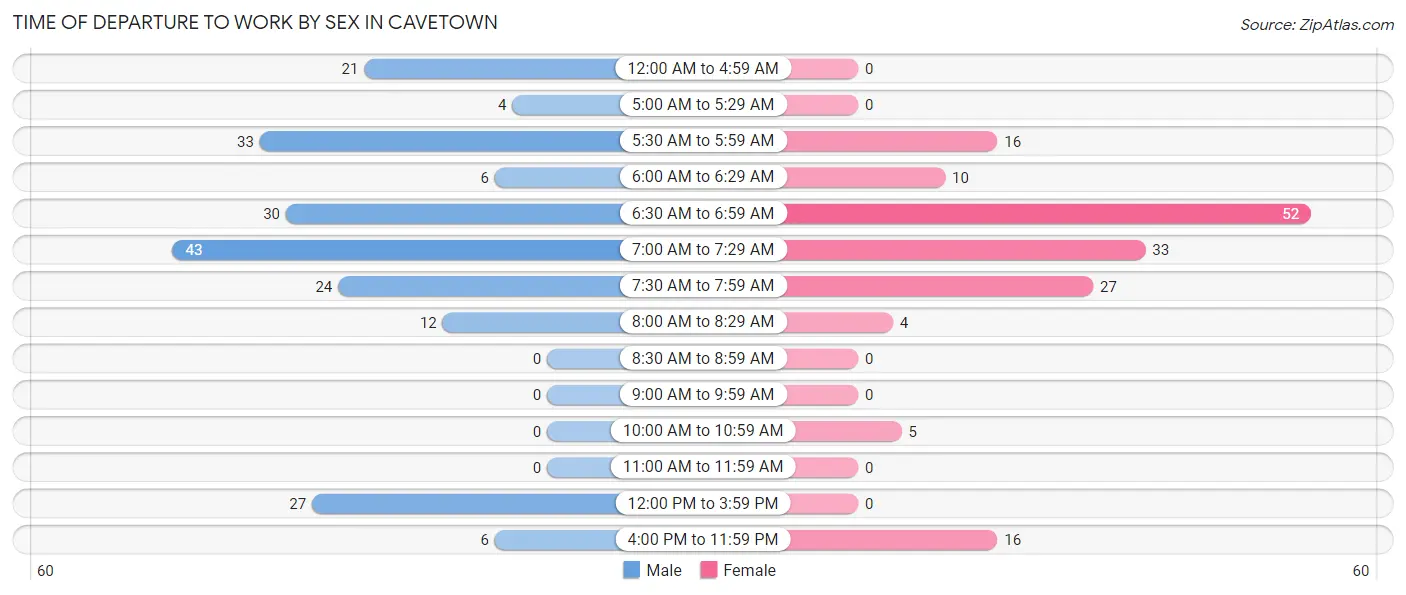
| Time of Departure | Male | Female |
| 12:00 AM to 4:59 AM | 21 (10.2%) | 0 (0.0%) |
| 5:00 AM to 5:29 AM | 4 (1.9%) | 0 (0.0%) |
| 5:30 AM to 5:59 AM | 33 (16.0%) | 16 (9.8%) |
| 6:00 AM to 6:29 AM | 6 (2.9%) | 10 (6.1%) |
| 6:30 AM to 6:59 AM | 30 (14.6%) | 52 (31.9%) |
| 7:00 AM to 7:29 AM | 43 (20.9%) | 33 (20.3%) |
| 7:30 AM to 7:59 AM | 24 (11.7%) | 27 (16.6%) |
| 8:00 AM to 8:29 AM | 12 (5.8%) | 4 (2.5%) |
| 8:30 AM to 8:59 AM | 0 (0.0%) | 0 (0.0%) |
| 9:00 AM to 9:59 AM | 0 (0.0%) | 0 (0.0%) |
| 10:00 AM to 10:59 AM | 0 (0.0%) | 5 (3.1%) |
| 11:00 AM to 11:59 AM | 0 (0.0%) | 0 (0.0%) |
| 12:00 PM to 3:59 PM | 27 (13.1%) | 0 (0.0%) |
| 4:00 PM to 11:59 PM | 6 (2.9%) | 16 (9.8%) |
| Total | 206 (100.0%) | 163 (100.0%) |
Housing Occupancy in Cavetown
Occupancy by Ownership in Cavetown
Of the total 388 dwellings in Cavetown, owner-occupied units account for 348 (89.7%), while renter-occupied units make up 40 (10.3%).
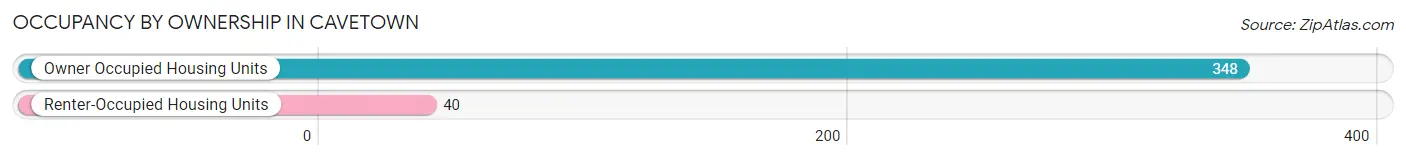
| Occupancy | # Housing Units | % Housing Units |
| Owner Occupied Housing Units | 348 | 89.7% |
| Renter-Occupied Housing Units | 40 | 10.3% |
| Total Occupied Housing Units | 388 | 100.0% |
Occupancy by Household Size in Cavetown
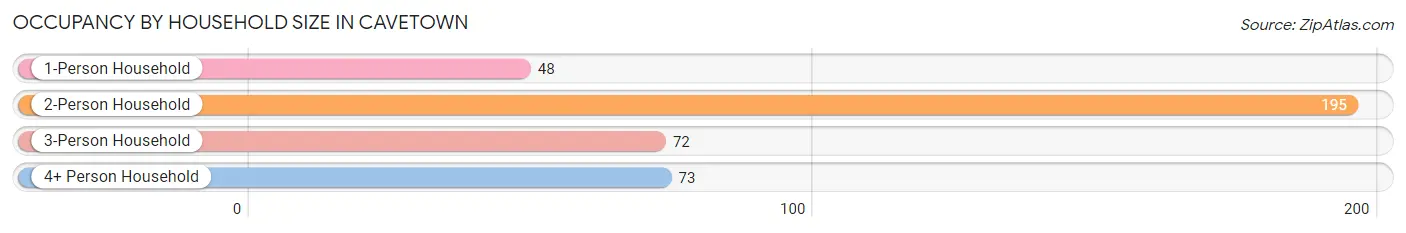
| Household Size | # Housing Units | % Housing Units |
| 1-Person Household | 48 | 12.4% |
| 2-Person Household | 195 | 50.3% |
| 3-Person Household | 72 | 18.6% |
| 4+ Person Household | 73 | 18.8% |
| Total Housing Units | 388 | 100.0% |
Occupancy by Ownership by Household Size in Cavetown
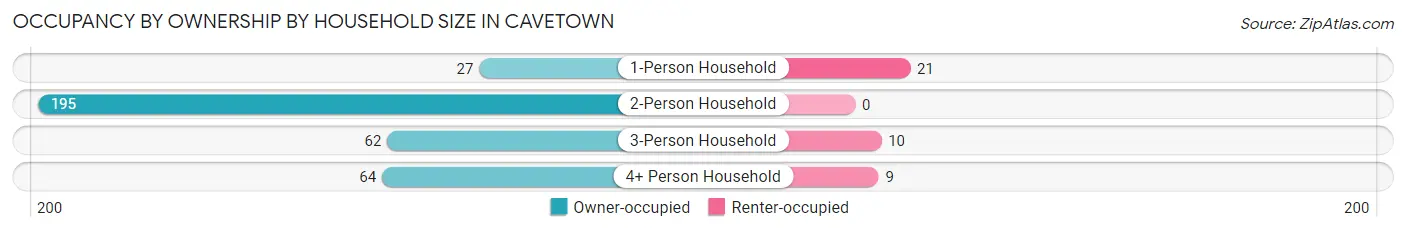
| Household Size | Owner-occupied | Renter-occupied |
| 1-Person Household | 27 (56.2%) | 21 (43.8%) |
| 2-Person Household | 195 (100.0%) | 0 (0.0%) |
| 3-Person Household | 62 (86.1%) | 10 (13.9%) |
| 4+ Person Household | 64 (87.7%) | 9 (12.3%) |
| Total Housing Units | 348 (89.7%) | 40 (10.3%) |
Occupancy by Educational Attainment in Cavetown
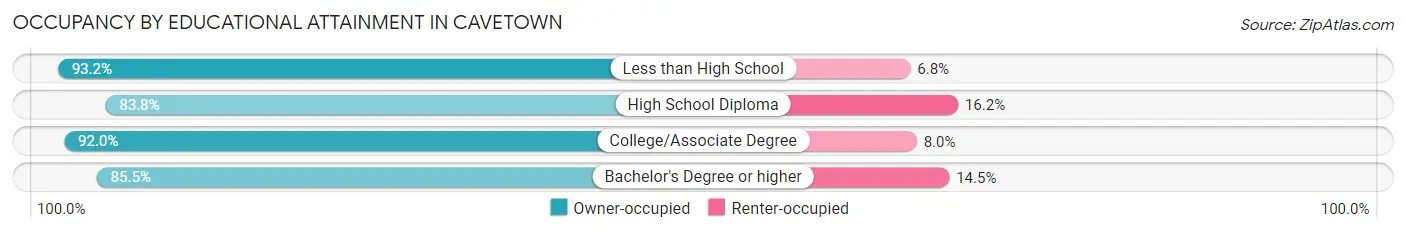
| Household Size | Owner-occupied | Renter-occupied |
| Less than High School | 124 (93.2%) | 9 (6.8%) |
| High School Diploma | 62 (83.8%) | 12 (16.2%) |
| College/Associate Degree | 103 (92.0%) | 9 (8.0%) |
| Bachelor's Degree or higher | 59 (85.5%) | 10 (14.5%) |
Occupancy by Age of Householder in Cavetown
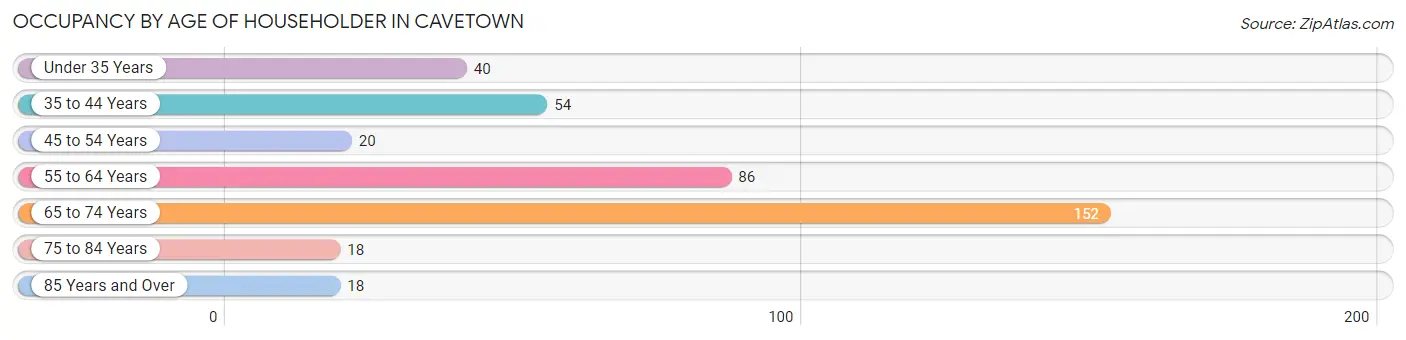
| Age Bracket | # Households | % Households |
| Under 35 Years | 40 | 10.3% |
| 35 to 44 Years | 54 | 13.9% |
| 45 to 54 Years | 20 | 5.1% |
| 55 to 64 Years | 86 | 22.2% |
| 65 to 74 Years | 152 | 39.2% |
| 75 to 84 Years | 18 | 4.6% |
| 85 Years and Over | 18 | 4.6% |
| Total | 388 | 100.0% |
Housing Finances in Cavetown
Median Income by Occupancy in Cavetown
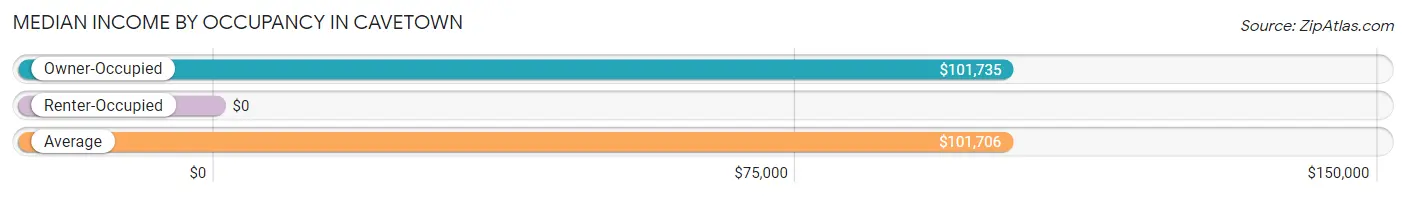
| Occupancy Type | # Households | Median Income |
| Owner-Occupied | 348 (89.7%) | $101,735 |
| Renter-Occupied | 40 (10.3%) | $0 |
| Average | 388 (100.0%) | $101,706 |
Occupancy by Householder Income Bracket in Cavetown
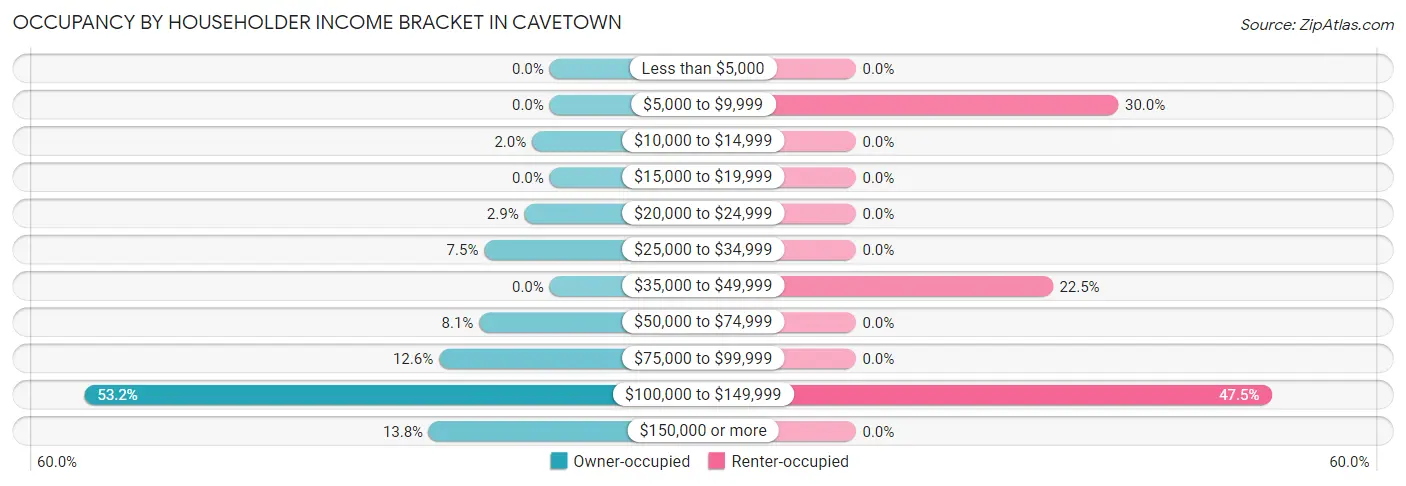
| Income Bracket | Owner-occupied | Renter-occupied |
| Less than $5,000 | 0 (0.0%) | 0 (0.0%) |
| $5,000 to $9,999 | 0 (0.0%) | 12 (30.0%) |
| $10,000 to $14,999 | 7 (2.0%) | 0 (0.0%) |
| $15,000 to $19,999 | 0 (0.0%) | 0 (0.0%) |
| $20,000 to $24,999 | 10 (2.9%) | 0 (0.0%) |
| $25,000 to $34,999 | 26 (7.5%) | 0 (0.0%) |
| $35,000 to $49,999 | 0 (0.0%) | 9 (22.5%) |
| $50,000 to $74,999 | 28 (8.1%) | 0 (0.0%) |
| $75,000 to $99,999 | 44 (12.6%) | 0 (0.0%) |
| $100,000 to $149,999 | 185 (53.2%) | 19 (47.5%) |
| $150,000 or more | 48 (13.8%) | 0 (0.0%) |
| Total | 348 (100.0%) | 40 (100.0%) |
Monthly Housing Cost Tiers in Cavetown
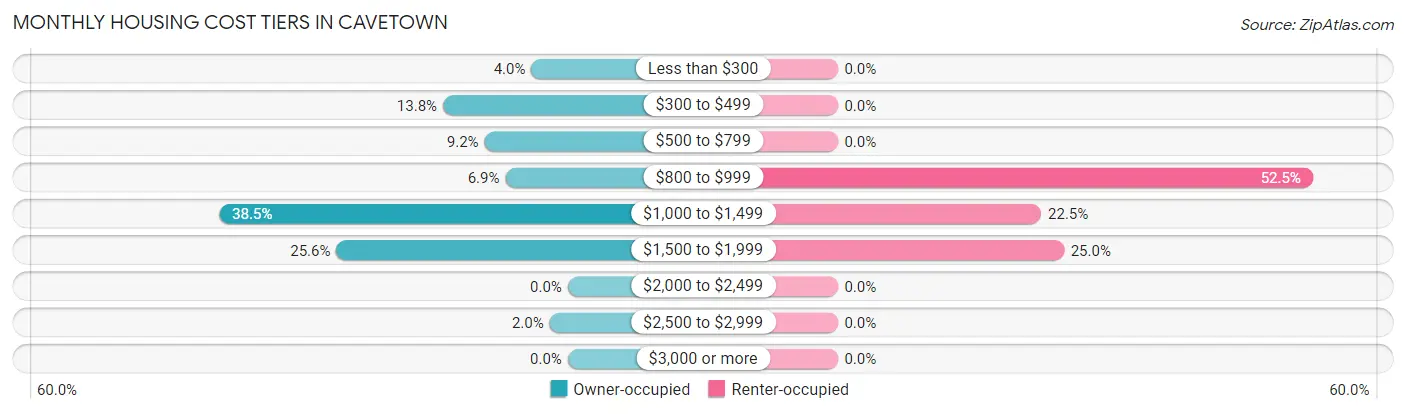
| Monthly Cost | Owner-occupied | Renter-occupied |
| Less than $300 | 14 (4.0%) | 0 (0.0%) |
| $300 to $499 | 48 (13.8%) | 0 (0.0%) |
| $500 to $799 | 32 (9.2%) | 0 (0.0%) |
| $800 to $999 | 24 (6.9%) | 21 (52.5%) |
| $1,000 to $1,499 | 134 (38.5%) | 9 (22.5%) |
| $1,500 to $1,999 | 89 (25.6%) | 10 (25.0%) |
| $2,000 to $2,499 | 0 (0.0%) | 0 (0.0%) |
| $2,500 to $2,999 | 7 (2.0%) | 0 (0.0%) |
| $3,000 or more | 0 (0.0%) | 0 (0.0%) |
| Total | 348 (100.0%) | 40 (100.0%) |
Physical Housing Characteristics in Cavetown
Housing Structures in Cavetown
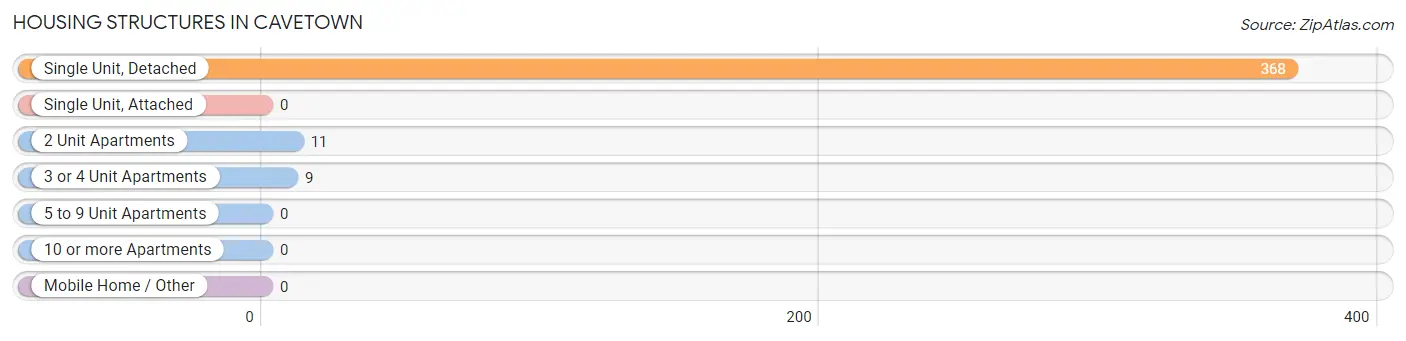
| Structure Type | # Housing Units | % Housing Units |
| Single Unit, Detached | 368 | 94.9% |
| Single Unit, Attached | 0 | 0.0% |
| 2 Unit Apartments | 11 | 2.8% |
| 3 or 4 Unit Apartments | 9 | 2.3% |
| 5 to 9 Unit Apartments | 0 | 0.0% |
| 10 or more Apartments | 0 | 0.0% |
| Mobile Home / Other | 0 | 0.0% |
| Total | 388 | 100.0% |
Housing Structures by Occupancy in Cavetown
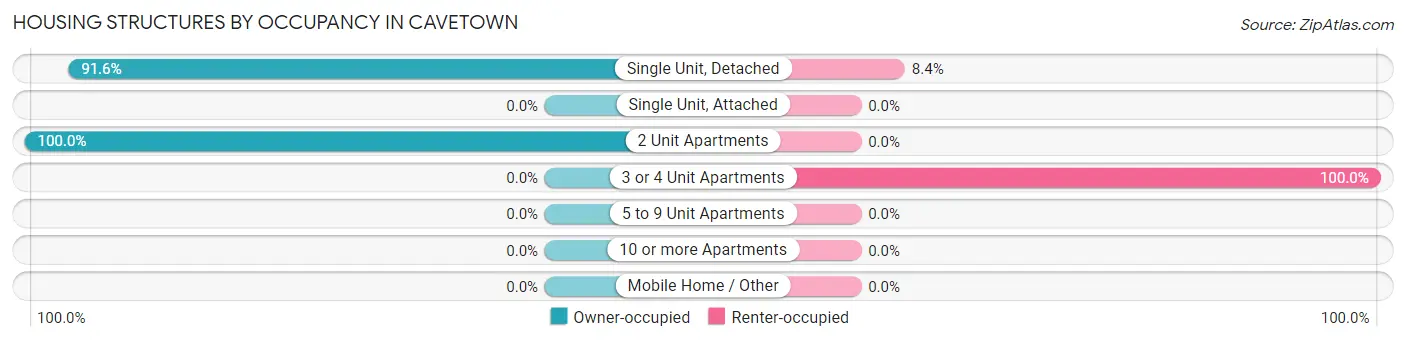
| Structure Type | Owner-occupied | Renter-occupied |
| Single Unit, Detached | 337 (91.6%) | 31 (8.4%) |
| Single Unit, Attached | 0 (0.0%) | 0 (0.0%) |
| 2 Unit Apartments | 11 (100.0%) | 0 (0.0%) |
| 3 or 4 Unit Apartments | 0 (0.0%) | 9 (100.0%) |
| 5 to 9 Unit Apartments | 0 (0.0%) | 0 (0.0%) |
| 10 or more Apartments | 0 (0.0%) | 0 (0.0%) |
| Mobile Home / Other | 0 (0.0%) | 0 (0.0%) |
| Total | 348 (89.7%) | 40 (10.3%) |
Housing Structures by Number of Rooms in Cavetown
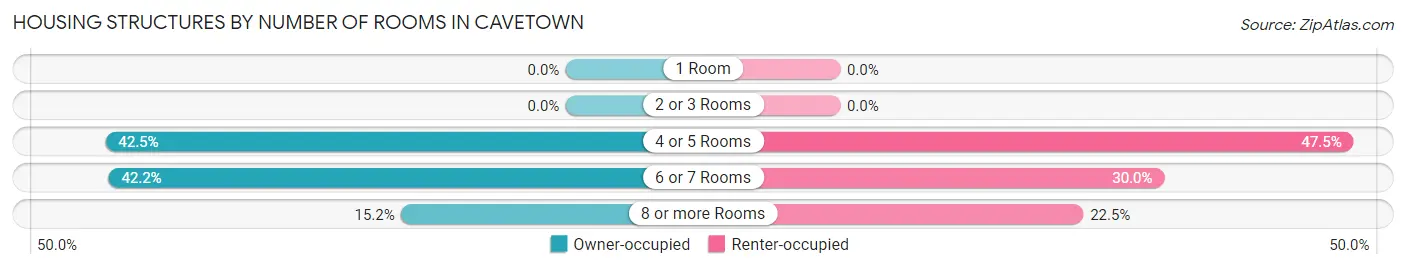
| Number of Rooms | Owner-occupied | Renter-occupied |
| 1 Room | 0 (0.0%) | 0 (0.0%) |
| 2 or 3 Rooms | 0 (0.0%) | 0 (0.0%) |
| 4 or 5 Rooms | 148 (42.5%) | 19 (47.5%) |
| 6 or 7 Rooms | 147 (42.2%) | 12 (30.0%) |
| 8 or more Rooms | 53 (15.2%) | 9 (22.5%) |
| Total | 348 (100.0%) | 40 (100.0%) |
Housing Structure by Heating Type in Cavetown
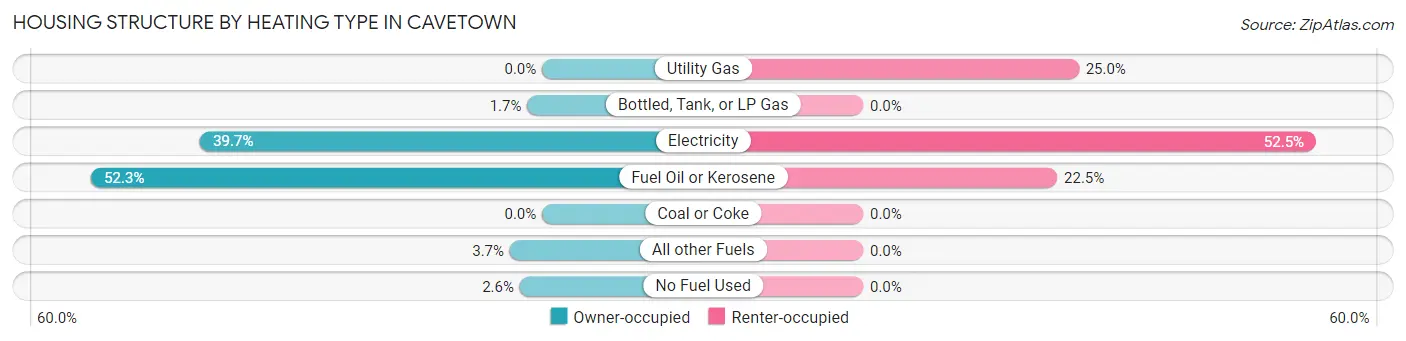
| Heating Type | Owner-occupied | Renter-occupied |
| Utility Gas | 0 (0.0%) | 10 (25.0%) |
| Bottled, Tank, or LP Gas | 6 (1.7%) | 0 (0.0%) |
| Electricity | 138 (39.7%) | 21 (52.5%) |
| Fuel Oil or Kerosene | 182 (52.3%) | 9 (22.5%) |
| Coal or Coke | 0 (0.0%) | 0 (0.0%) |
| All other Fuels | 13 (3.7%) | 0 (0.0%) |
| No Fuel Used | 9 (2.6%) | 0 (0.0%) |
| Total | 348 (100.0%) | 40 (100.0%) |
Household Vehicle Usage in Cavetown
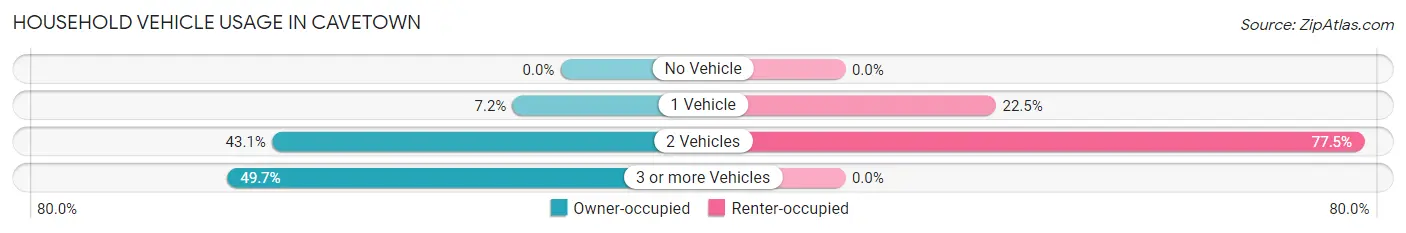
| Vehicles per Household | Owner-occupied | Renter-occupied |
| No Vehicle | 0 (0.0%) | 0 (0.0%) |
| 1 Vehicle | 25 (7.2%) | 9 (22.5%) |
| 2 Vehicles | 150 (43.1%) | 31 (77.5%) |
| 3 or more Vehicles | 173 (49.7%) | 0 (0.0%) |
| Total | 348 (100.0%) | 40 (100.0%) |
Real Estate & Mortgages in Cavetown
Real Estate and Mortgage Overview in Cavetown
| Characteristic | Without Mortgage | With Mortgage |
| Housing Units | 90 | 258 |
| Median Property Value | $272,200 | $310,100 |
| Median Household Income | $79,643 | $37 |
| Monthly Housing Costs | $464 | $0 |
| Real Estate Taxes | $2,364 | $0 |
Property Value by Mortgage Status in Cavetown
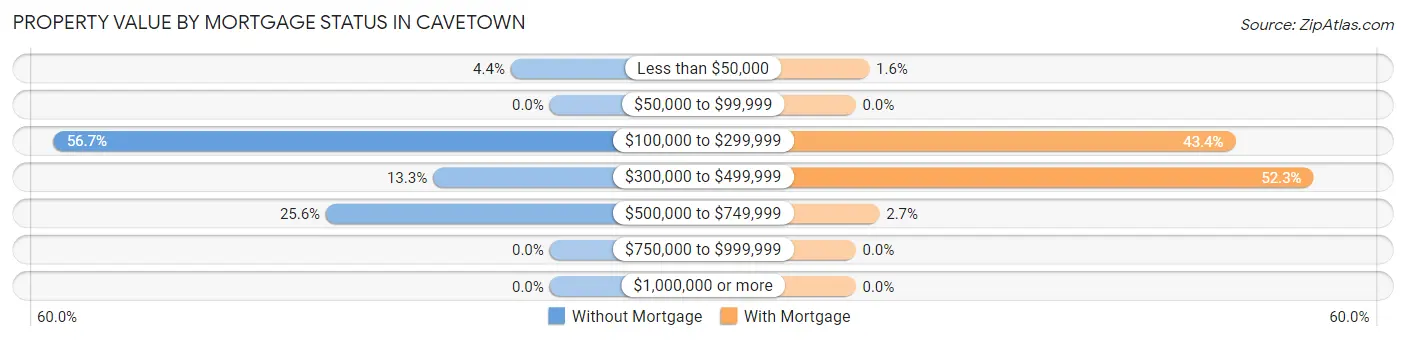
| Property Value | Without Mortgage | With Mortgage |
| Less than $50,000 | 4 (4.4%) | 4 (1.5%) |
| $50,000 to $99,999 | 0 (0.0%) | 0 (0.0%) |
| $100,000 to $299,999 | 51 (56.7%) | 112 (43.4%) |
| $300,000 to $499,999 | 12 (13.3%) | 135 (52.3%) |
| $500,000 to $749,999 | 23 (25.6%) | 7 (2.7%) |
| $750,000 to $999,999 | 0 (0.0%) | 0 (0.0%) |
| $1,000,000 or more | 0 (0.0%) | 0 (0.0%) |
| Total | 90 (100.0%) | 258 (100.0%) |
Household Income by Mortgage Status in Cavetown
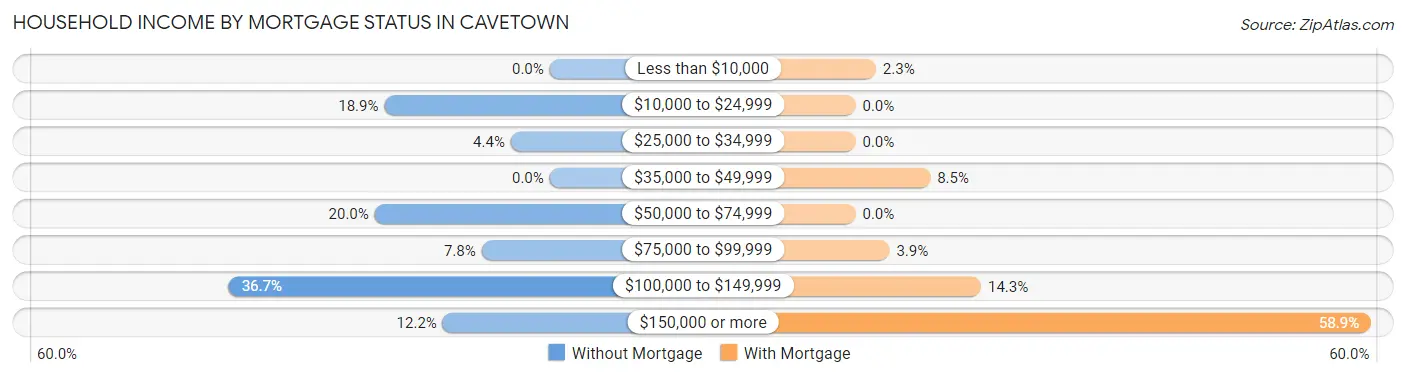
| Household Income | Without Mortgage | With Mortgage |
| Less than $10,000 | 0 (0.0%) | 6 (2.3%) |
| $10,000 to $24,999 | 17 (18.9%) | 0 (0.0%) |
| $25,000 to $34,999 | 4 (4.4%) | 0 (0.0%) |
| $35,000 to $49,999 | 0 (0.0%) | 22 (8.5%) |
| $50,000 to $74,999 | 18 (20.0%) | 0 (0.0%) |
| $75,000 to $99,999 | 7 (7.8%) | 10 (3.9%) |
| $100,000 to $149,999 | 33 (36.7%) | 37 (14.3%) |
| $150,000 or more | 11 (12.2%) | 152 (58.9%) |
| Total | 90 (100.0%) | 258 (100.0%) |
Property Value to Household Income Ratio in Cavetown
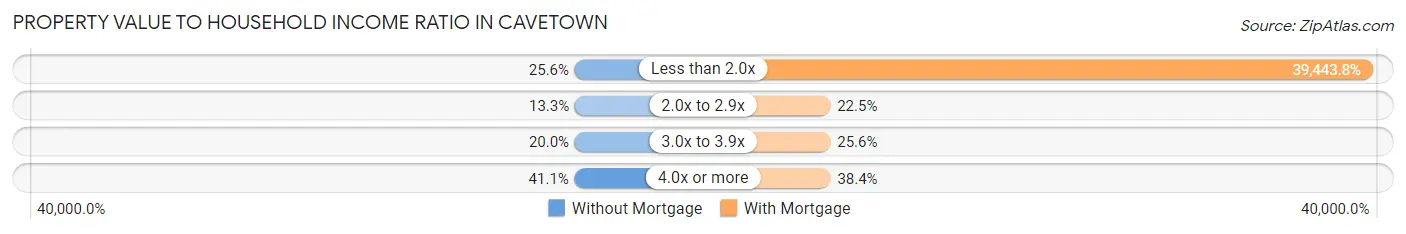
| Value-to-Income Ratio | Without Mortgage | With Mortgage |
| Less than 2.0x | 23 (25.6%) | 101,765 (39,443.8%) |
| 2.0x to 2.9x | 12 (13.3%) | 58 (22.5%) |
| 3.0x to 3.9x | 18 (20.0%) | 66 (25.6%) |
| 4.0x or more | 37 (41.1%) | 99 (38.4%) |
| Total | 90 (100.0%) | 258 (100.0%) |
Real Estate Taxes by Mortgage Status in Cavetown
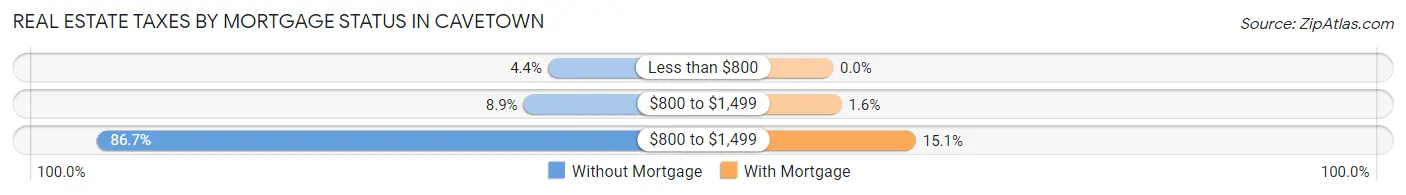
| Property Taxes | Without Mortgage | With Mortgage |
| Less than $800 | 4 (4.4%) | 0 (0.0%) |
| $800 to $1,499 | 8 (8.9%) | 4 (1.5%) |
| $800 to $1,499 | 78 (86.7%) | 39 (15.1%) |
| Total | 90 (100.0%) | 258 (100.0%) |
Health & Disability in Cavetown
Health Insurance Coverage by Age in Cavetown
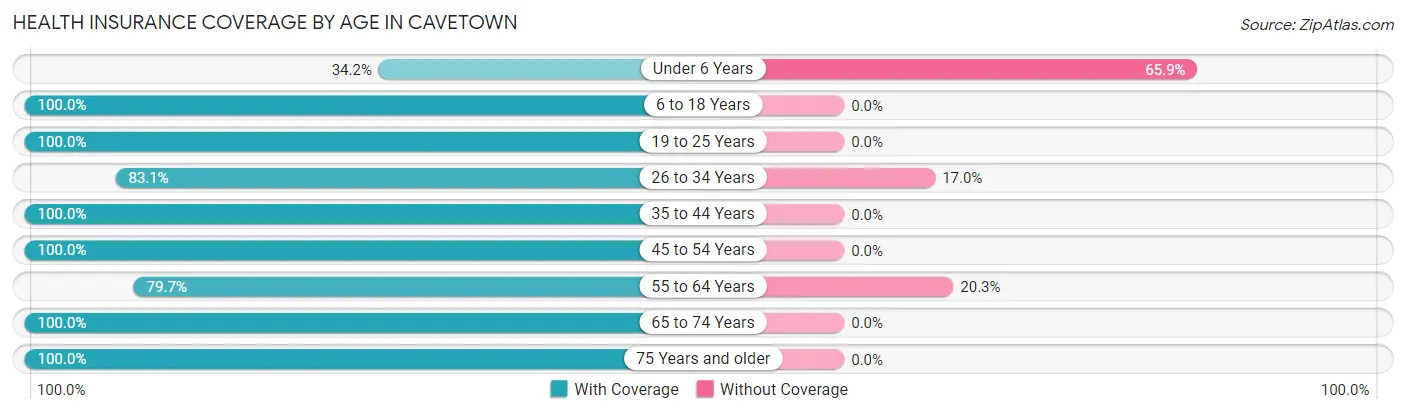
| Age Bracket | With Coverage | Without Coverage |
| Under 6 Years | 14 (34.2%) | 27 (65.8%) |
| 6 to 18 Years | 101 (100.0%) | 0 (0.0%) |
| 19 to 25 Years | 74 (100.0%) | 0 (0.0%) |
| 26 to 34 Years | 98 (83.1%) | 20 (17.0%) |
| 35 to 44 Years | 73 (100.0%) | 0 (0.0%) |
| 45 to 54 Years | 61 (100.0%) | 0 (0.0%) |
| 55 to 64 Years | 141 (79.7%) | 36 (20.3%) |
| 65 to 74 Years | 175 (100.0%) | 0 (0.0%) |
| 75 Years and older | 154 (100.0%) | 0 (0.0%) |
| Total | 891 (91.5%) | 83 (8.5%) |
Health Insurance Coverage by Citizenship Status in Cavetown
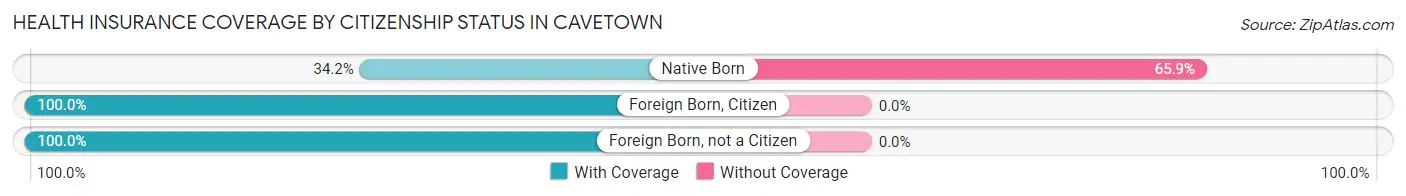
| Citizenship Status | With Coverage | Without Coverage |
| Native Born | 14 (34.2%) | 27 (65.8%) |
| Foreign Born, Citizen | 101 (100.0%) | 0 (0.0%) |
| Foreign Born, not a Citizen | 74 (100.0%) | 0 (0.0%) |
Health Insurance Coverage by Household Income in Cavetown
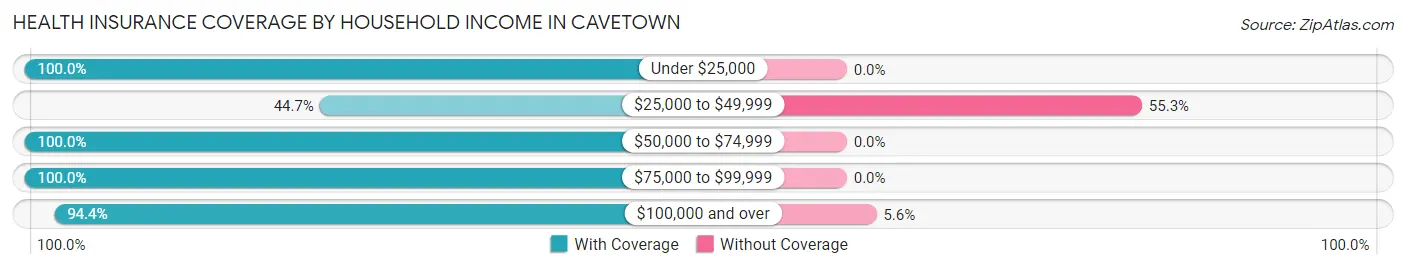
| Household Income | With Coverage | Without Coverage |
| Under $25,000 | 37 (100.0%) | 0 (0.0%) |
| $25,000 to $49,999 | 38 (44.7%) | 47 (55.3%) |
| $50,000 to $74,999 | 65 (100.0%) | 0 (0.0%) |
| $75,000 to $99,999 | 140 (100.0%) | 0 (0.0%) |
| $100,000 and over | 611 (94.4%) | 36 (5.6%) |
Public vs Private Health Insurance Coverage by Age in Cavetown
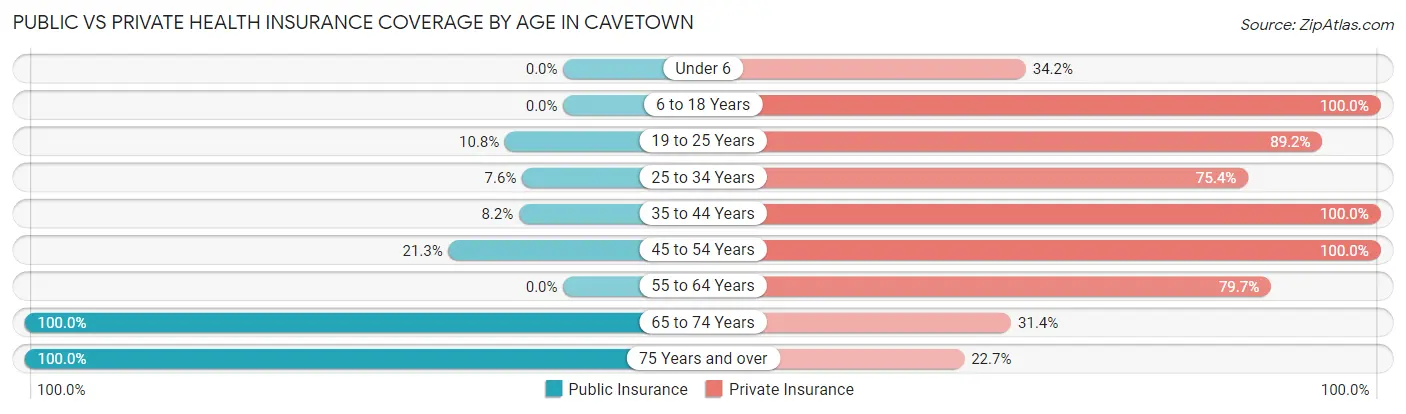
| Age Bracket | Public Insurance | Private Insurance |
| Under 6 | 0 (0.0%) | 14 (34.2%) |
| 6 to 18 Years | 0 (0.0%) | 101 (100.0%) |
| 19 to 25 Years | 8 (10.8%) | 66 (89.2%) |
| 25 to 34 Years | 9 (7.6%) | 89 (75.4%) |
| 35 to 44 Years | 6 (8.2%) | 73 (100.0%) |
| 45 to 54 Years | 13 (21.3%) | 61 (100.0%) |
| 55 to 64 Years | 0 (0.0%) | 141 (79.7%) |
| 65 to 74 Years | 175 (100.0%) | 55 (31.4%) |
| 75 Years and over | 154 (100.0%) | 35 (22.7%) |
| Total | 365 (37.5%) | 635 (65.2%) |
Disability Status by Sex by Age in Cavetown
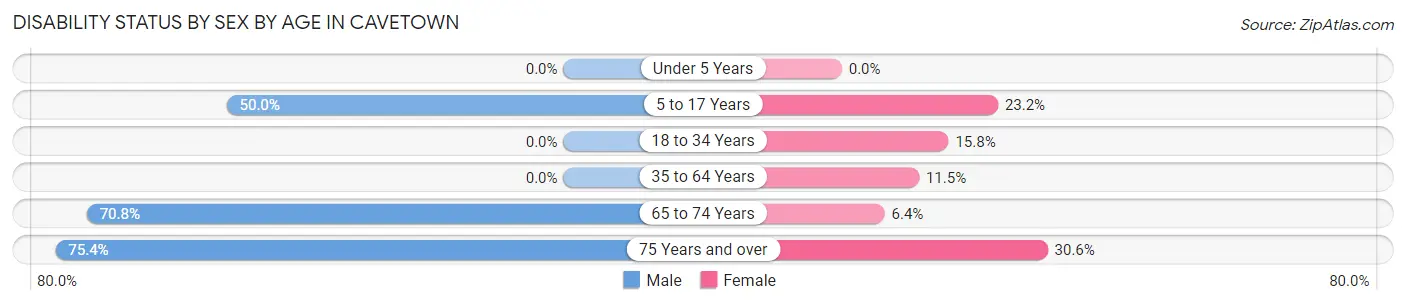
| Age Bracket | Male | Female |
| Under 5 Years | 0 (0.0%) | 0 (0.0%) |
| 5 to 17 Years | 16 (50.0%) | 16 (23.2%) |
| 18 to 34 Years | 0 (0.0%) | 16 (15.8%) |
| 35 to 64 Years | 0 (0.0%) | 18 (11.5%) |
| 65 to 74 Years | 46 (70.8%) | 7 (6.4%) |
| 75 Years and over | 89 (75.4%) | 11 (30.6%) |
Disability Class by Sex by Age in Cavetown
Disability Class: Hearing Difficulty
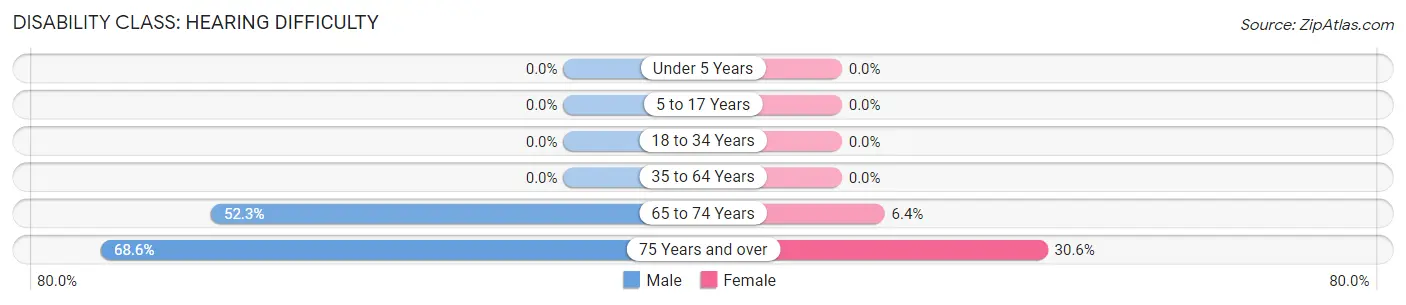
| Age Bracket | Male | Female |
| Under 5 Years | 0 (0.0%) | 0 (0.0%) |
| 5 to 17 Years | 0 (0.0%) | 0 (0.0%) |
| 18 to 34 Years | 0 (0.0%) | 0 (0.0%) |
| 35 to 64 Years | 0 (0.0%) | 0 (0.0%) |
| 65 to 74 Years | 34 (52.3%) | 7 (6.4%) |
| 75 Years and over | 81 (68.6%) | 11 (30.6%) |
Disability Class: Vision Difficulty
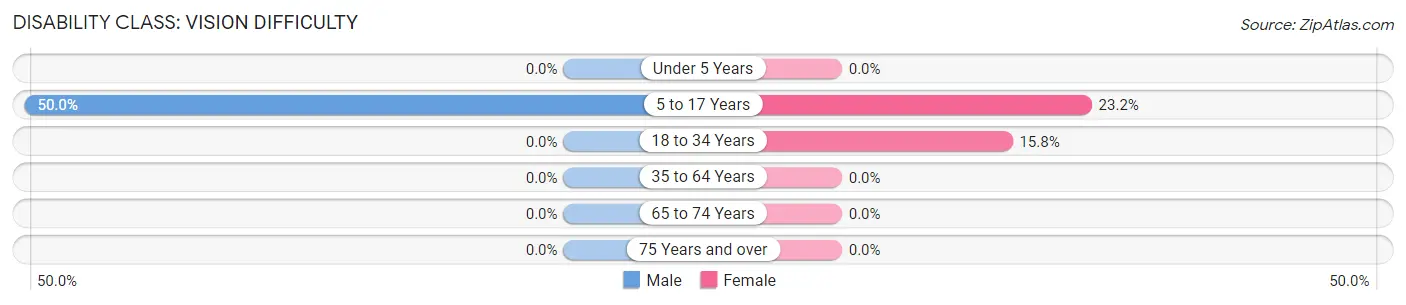
| Age Bracket | Male | Female |
| Under 5 Years | 0 (0.0%) | 0 (0.0%) |
| 5 to 17 Years | 16 (50.0%) | 16 (23.2%) |
| 18 to 34 Years | 0 (0.0%) | 16 (15.8%) |
| 35 to 64 Years | 0 (0.0%) | 0 (0.0%) |
| 65 to 74 Years | 0 (0.0%) | 0 (0.0%) |
| 75 Years and over | 0 (0.0%) | 0 (0.0%) |
Disability Class: Cognitive Difficulty
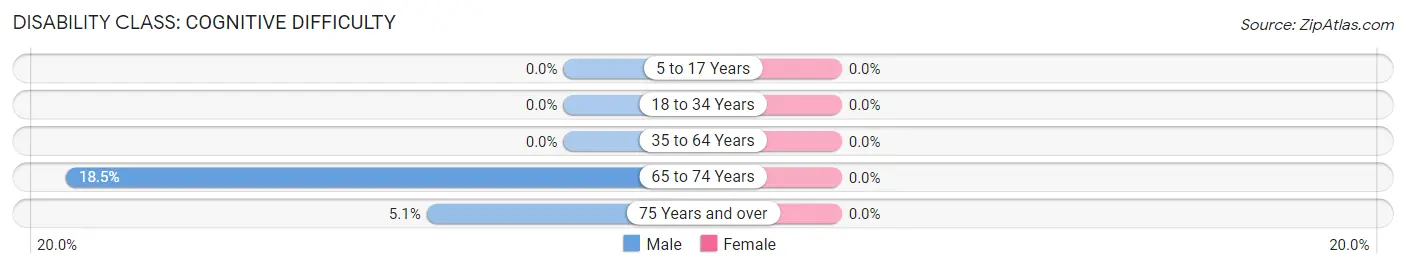
| Age Bracket | Male | Female |
| 5 to 17 Years | 0 (0.0%) | 0 (0.0%) |
| 18 to 34 Years | 0 (0.0%) | 0 (0.0%) |
| 35 to 64 Years | 0 (0.0%) | 0 (0.0%) |
| 65 to 74 Years | 12 (18.5%) | 0 (0.0%) |
| 75 Years and over | 6 (5.1%) | 0 (0.0%) |
Disability Class: Ambulatory Difficulty
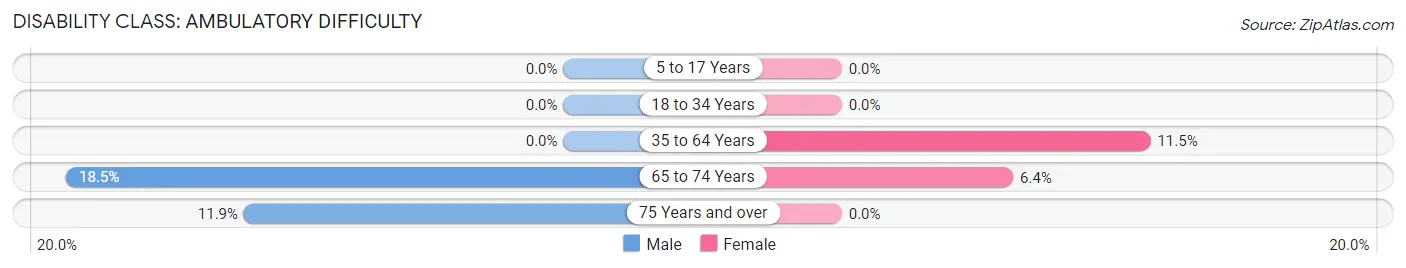
| Age Bracket | Male | Female |
| 5 to 17 Years | 0 (0.0%) | 0 (0.0%) |
| 18 to 34 Years | 0 (0.0%) | 0 (0.0%) |
| 35 to 64 Years | 0 (0.0%) | 18 (11.5%) |
| 65 to 74 Years | 12 (18.5%) | 7 (6.4%) |
| 75 Years and over | 14 (11.9%) | 0 (0.0%) |
Disability Class: Self-Care Difficulty
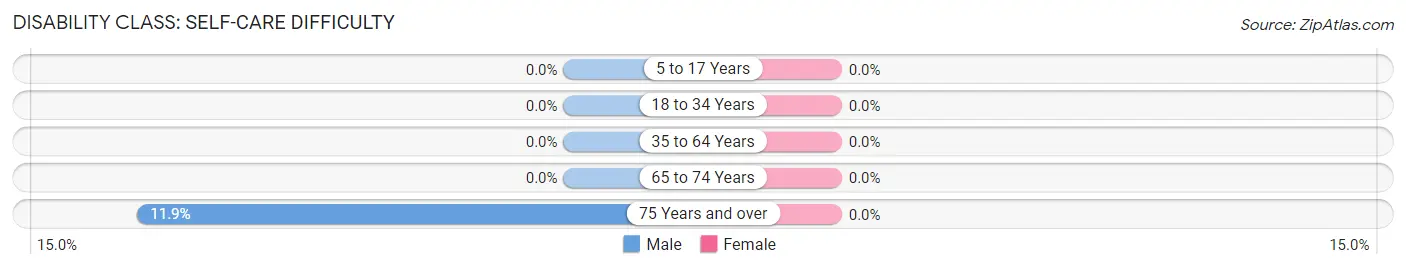
| Age Bracket | Male | Female |
| 5 to 17 Years | 0 (0.0%) | 0 (0.0%) |
| 18 to 34 Years | 0 (0.0%) | 0 (0.0%) |
| 35 to 64 Years | 0 (0.0%) | 0 (0.0%) |
| 65 to 74 Years | 0 (0.0%) | 0 (0.0%) |
| 75 Years and over | 14 (11.9%) | 0 (0.0%) |
Technology Access in Cavetown
Computing Device Access in Cavetown
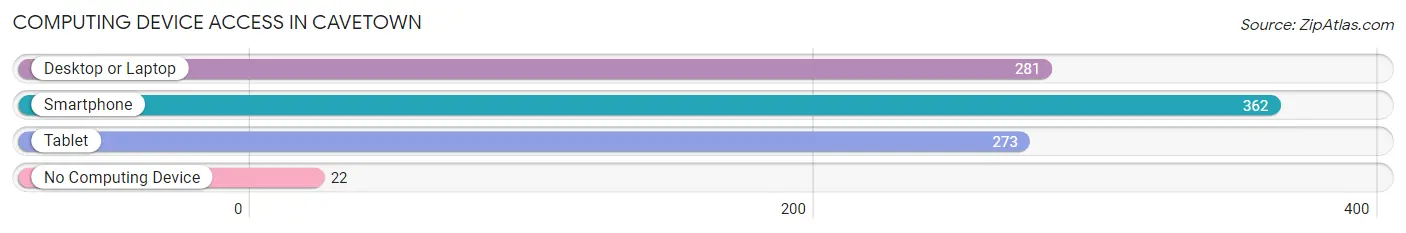
| Device Type | # Households | % Households |
| Desktop or Laptop | 281 | 72.4% |
| Smartphone | 362 | 93.3% |
| Tablet | 273 | 70.4% |
| No Computing Device | 22 | 5.7% |
| Total | 388 | 100.0% |
Internet Access in Cavetown
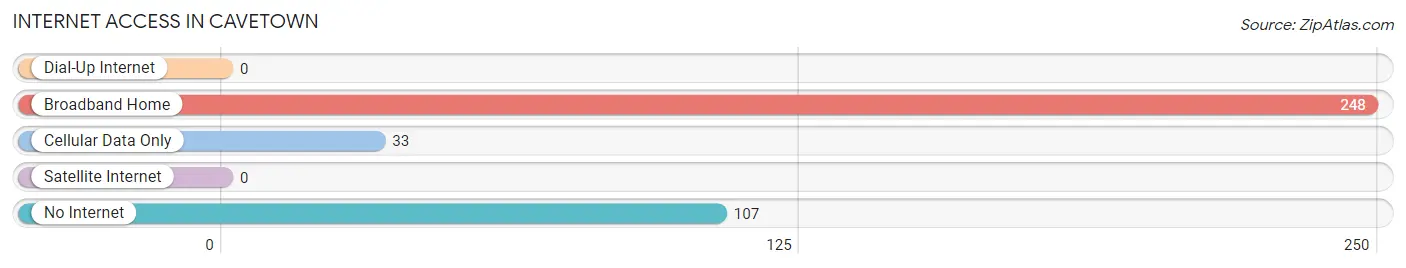
| Internet Type | # Households | % Households |
| Dial-Up Internet | 0 | 0.0% |
| Broadband Home | 248 | 63.9% |
| Cellular Data Only | 33 | 8.5% |
| Satellite Internet | 0 | 0.0% |
| No Internet | 107 | 27.6% |
| Total | 388 | 100.0% |
Cavetown Summary
Cavetown is a small unincorporated community located in Washington County, Maryland. It is situated in the northern part of the county, approximately 8 miles south of Hagerstown. The population of Cavetown was estimated to be 1,072 in the year 2000.
History
Cavetown was first settled in the late 1700s by German immigrants. The town was named after a nearby cave, which was used by the settlers for shelter and protection. The town was officially established in 1817 and was incorporated in 1820.
In the early 1900s, Cavetown was a thriving agricultural community. The town was home to several farms, a general store, a post office, a blacksmith shop, and a school. The town also had a train station, which was used to transport goods and passengers to and from Hagerstown.
In the 1950s, the town began to decline as many of the farms were sold off and the population began to move away. The train station was closed in the 1960s and the post office was closed in the 1970s.
Geography
Cavetown is located in northern Washington County, Maryland. It is situated in the Appalachian Mountains, approximately 8 miles south of Hagerstown. The town is surrounded by rolling hills and farmland. The town is located near the Potomac River, which provides a scenic backdrop.
The climate in Cavetown is temperate, with hot summers and cold winters. The average temperature in the summer is around 75 degrees Fahrenheit, while the average temperature in the winter is around 35 degrees Fahrenheit.
Economy
Cavetown’s economy is largely based on agriculture. The town is home to several farms, which produce a variety of crops, including corn, soybeans, wheat, and hay. The town also has a few small businesses, including a general store, a gas station, and a restaurant.
Demographics
As of the 2000 census, the population of Cavetown was 1,072. The racial makeup of the town was 97.3% White, 0.9% African American, 0.3% Native American, 0.3% Asian, and 0.9% from other races. The median household income was $37,500, and the median family income was $41,250.
Conclusion
Cavetown is a small unincorporated community located in Washington County, Maryland. It is situated in the northern part of the county, approximately 8 miles south of Hagerstown. The town was first settled in the late 1700s by German immigrants and was officially established in 1817. The town’s economy is largely based on agriculture, and the population was estimated to be 1,072 in the year 2000.
Common Questions
What is the Total Population of Cavetown?
Total Population of Cavetown is 974.
What is the Total Male Population of Cavetown?
Total Male Population of Cavetown is 483.
What is the Total Female Population of Cavetown?
Total Female Population of Cavetown is 491.
What is the Ratio of Males per 100 Females in Cavetown?
There are 98.37 Males per 100 Females in Cavetown.
What is the Ratio of Females per 100 Males in Cavetown?
There are 101.66 Females per 100 Males in Cavetown.
What is the Median Population Age in Cavetown?
Median Population Age in Cavetown is 57.4 Years.
What is the Average Family Size in Cavetown
Average Family Size in Cavetown is 2.7 People.
What is the Average Household Size in Cavetown
Average Household Size in Cavetown is 2.5 People.
What is Per Capita Income in Cavetown?
Per Capita income in Cavetown is $43,586.
What is the Median Family Income in Cavetown?
Median Family Income in Cavetown is $102,029.
What is the Median Household income in Cavetown?
Median Household Income in Cavetown is $101,706.
What is Income or Wage Gap in Cavetown?
Income or Wage Gap in Cavetown is 1.4%.
Women in Cavetown earn 98.6 cents for every dollar earned by a man.
What is Inequality or Gini Index in Cavetown?
Inequality or Gini Index in Cavetown is 0.29.
How Large is the Labor Force in Cavetown?
There are 422 People in the Labor Forcein in Cavetown.
What is the Percentage of People in the Labor Force in Cavetown?
49.8% of People are in the Labor Force in Cavetown.
What is the Unemployment Rate in Cavetown?
Unemployment Rate in Cavetown is 2.1%.