Cities with the Highest Percentage of Population Employed in Cleaning & Maintenance in Kentucky
RELATED REPORTS & OPTIONS
Cleaning & Maintenance
Kentucky
Compare Cities
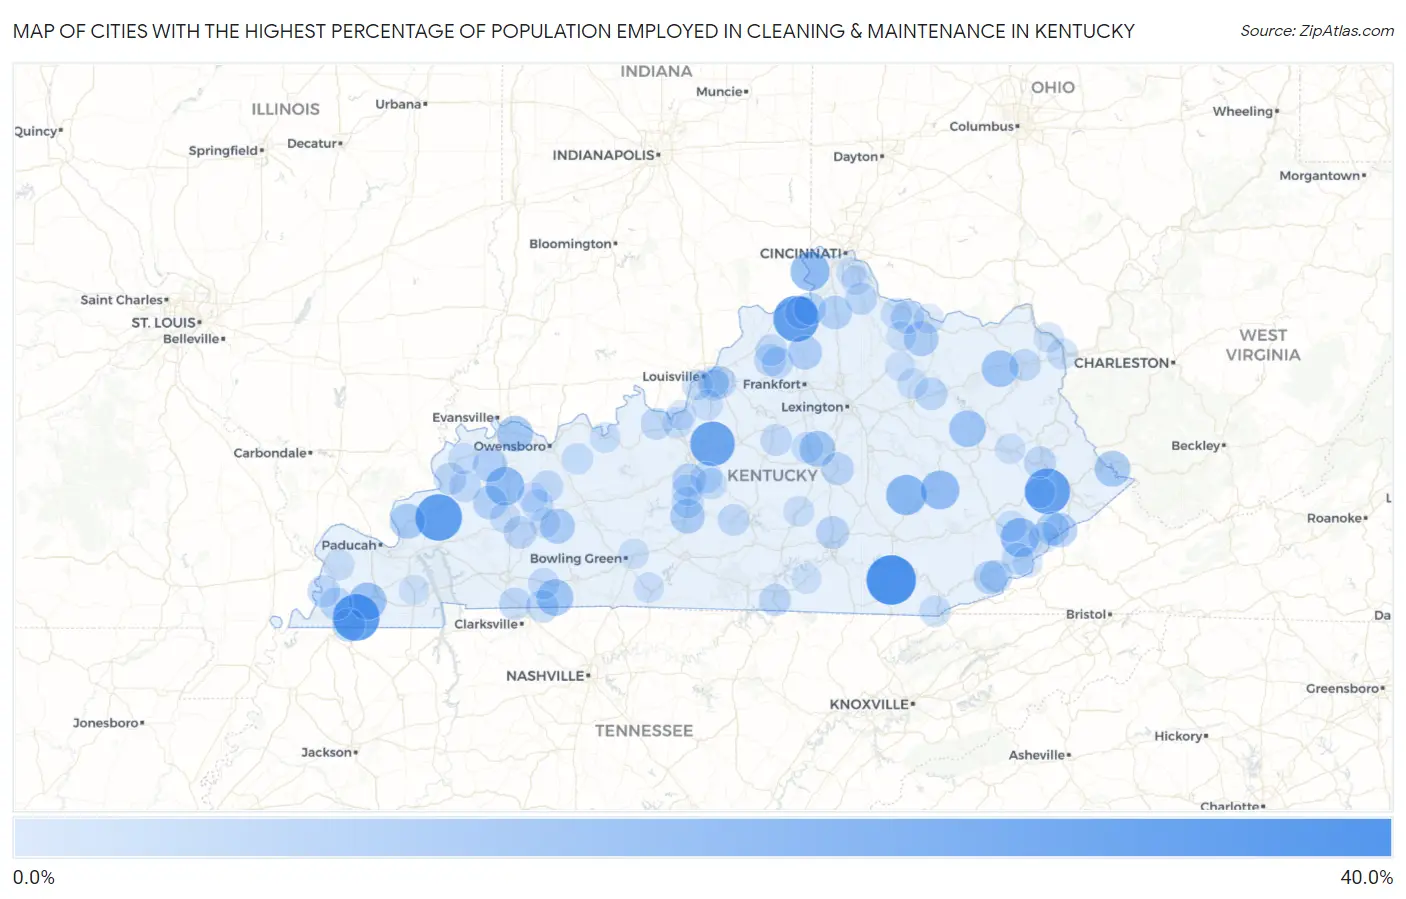
Map of Cities with the Highest Percentage of Population Employed in Cleaning & Maintenance in Kentucky
0.0%
40.0%
Cities with the Highest Percentage of Population Employed in Cleaning & Maintenance in Kentucky
| City | % Employed | vs State | vs National | |
| 1. | Rockholds | 34.0% | 3.3%(+30.6)#1 | 3.5%(+30.5)#201 |
| 2. | Water Valley | 29.6% | 3.3%(+26.3)#2 | 3.5%(+26.1)#271 |
| 3. | Crayne | 29.5% | 3.3%(+26.2)#3 | 3.5%(+26.0)#274 |
| 4. | Sanders | 28.5% | 3.3%(+25.2)#4 | 3.5%(+25.0)#305 |
| 5. | Mcdowell | 27.7% | 3.3%(+24.4)#5 | 3.5%(+24.2)#316 |
| 6. | Boston | 26.7% | 3.3%(+23.4)#6 | 3.5%(+23.2)#342 |
| 7. | Mckee | 20.3% | 3.3%(+17.0)#7 | 3.5%(+16.8)#615 |
| 8. | Belleview | 18.8% | 3.3%(+15.4)#8 | 3.5%(+15.3)#717 |
| 9. | Blackey | 18.2% | 3.3%(+14.9)#9 | 3.5%(+14.7)#766 |
| 10. | Booneville | 18.1% | 3.3%(+14.8)#10 | 3.5%(+14.6)#780 |
| 11. | Slaughters | 17.9% | 3.3%(+14.6)#11 | 3.5%(+14.5)#792 |
| 12. | Pryorsburg | 16.3% | 3.3%(+13.0)#12 | 3.5%(+12.8)#956 |
| 13. | Olive Hill | 15.2% | 3.3%(+11.9)#13 | 3.5%(+11.7)#1,076 |
| 14. | Ezel | 15.2% | 3.3%(+11.9)#14 | 3.5%(+11.7)#1,079 |
| 15. | Allensville | 15.1% | 3.3%(+11.8)#15 | 3.5%(+11.6)#1,099 |
| 16. | Burgin | 14.0% | 3.3%(+10.7)#16 | 3.5%(+10.5)#1,298 |
| 17. | Mccarr | 13.9% | 3.3%(+10.6)#17 | 3.5%(+10.4)#1,318 |
| 18. | Spottsville | 13.9% | 3.3%(+10.6)#18 | 3.5%(+10.4)#1,320 |
| 19. | Burna | 13.2% | 3.3%(+9.85)#19 | 3.5%(+9.68)#1,496 |
| 20. | Drakesboro | 12.7% | 3.3%(+9.35)#20 | 3.5%(+9.18)#1,647 |
| 21. | Mays Lick | 12.5% | 3.3%(+9.19)#21 | 3.5%(+9.02)#1,695 |
| 22. | Munfordville | 12.4% | 3.3%(+9.13)#22 | 3.5%(+8.96)#1,715 |
| 23. | Jenkins | 12.0% | 3.3%(+8.72)#23 | 3.5%(+8.55)#1,843 |
| 24. | Monterey | 11.6% | 3.3%(+8.32)#24 | 3.5%(+8.15)#1,970 |
| 25. | Poole | 11.6% | 3.3%(+8.27)#25 | 3.5%(+8.10)#1,982 |
| 26. | Nebo | 11.4% | 3.3%(+8.12)#26 | 3.5%(+7.95)#2,040 |
| 27. | Dry Ridge | 11.1% | 3.3%(+7.82)#27 | 3.5%(+7.65)#2,144 |
| 28. | Fleming Neon | 11.1% | 3.3%(+7.76)#28 | 3.5%(+7.59)#2,183 |
| 29. | Ages | 10.6% | 3.3%(+7.31)#29 | 3.5%(+7.14)#2,351 |
| 30. | Fulton | 10.6% | 3.3%(+7.30)#30 | 3.5%(+7.13)#2,354 |
| 31. | Science Hill | 10.4% | 3.3%(+7.10)#31 | 3.5%(+6.93)#2,450 |
| 32. | Sonora | 10.3% | 3.3%(+6.94)#32 | 3.5%(+6.77)#2,501 |
| 33. | Lancaster | 9.9% | 3.3%(+6.55)#33 | 3.5%(+6.38)#2,714 |
| 34. | Germantown | 9.8% | 3.3%(+6.52)#34 | 3.5%(+6.35)#2,724 |
| 35. | Sorgho | 9.7% | 3.3%(+6.39)#35 | 3.5%(+6.22)#2,788 |
| 36. | Sparta | 9.6% | 3.3%(+6.34)#36 | 3.5%(+6.17)#2,810 |
| 37. | White Plains | 9.6% | 3.3%(+6.33)#37 | 3.5%(+6.16)#2,816 |
| 38. | Owingsville | 9.5% | 3.3%(+6.18)#38 | 3.5%(+6.01)#2,897 |
| 39. | Guthrie | 9.5% | 3.3%(+6.16)#39 | 3.5%(+5.99)#2,907 |
| 40. | Clinton | 9.4% | 3.3%(+6.13)#40 | 3.5%(+5.96)#2,921 |
| 41. | Houston Acres | 9.4% | 3.3%(+6.10)#41 | 3.5%(+5.93)#2,944 |
| 42. | Columbus | 9.3% | 3.3%(+6.02)#42 | 3.5%(+5.85)#2,982 |
| 43. | Evarts | 9.3% | 3.3%(+5.98)#43 | 3.5%(+5.81)#3,002 |
| 44. | Glencoe | 9.2% | 3.3%(+5.93)#44 | 3.5%(+5.76)#3,025 |
| 45. | Sturgis | 9.1% | 3.3%(+5.75)#45 | 3.5%(+5.58)#3,142 |
| 46. | Albany | 9.0% | 3.3%(+5.71)#46 | 3.5%(+5.54)#3,164 |
| 47. | Prestonsburg | 9.0% | 3.3%(+5.71)#47 | 3.5%(+5.54)#3,167 |
| 48. | Eminence | 9.0% | 3.3%(+5.69)#48 | 3.5%(+5.52)#3,174 |
| 49. | Oak Grove | 8.9% | 3.3%(+5.58)#49 | 3.5%(+5.41)#3,244 |
| 50. | Butler | 8.8% | 3.3%(+5.45)#50 | 3.5%(+5.28)#3,352 |
| 51. | Wheatcroft | 8.6% | 3.3%(+5.31)#51 | 3.5%(+5.14)#3,464 |
| 52. | Grayson | 8.6% | 3.3%(+5.27)#52 | 3.5%(+5.10)#3,483 |
| 53. | Cumberland | 8.5% | 3.3%(+5.22)#53 | 3.5%(+5.05)#3,523 |
| 54. | Pleasureville | 8.4% | 3.3%(+5.09)#54 | 3.5%(+4.92)#3,612 |
| 55. | Bonnieville | 8.3% | 3.3%(+5.02)#55 | 3.5%(+4.85)#3,666 |
| 56. | Ekron | 8.3% | 3.3%(+5.02)#56 | 3.5%(+4.85)#3,672 |
| 57. | Livermore | 8.3% | 3.3%(+4.99)#57 | 3.5%(+4.82)#3,707 |
| 58. | Willisburg | 8.3% | 3.3%(+4.98)#58 | 3.5%(+4.81)#3,715 |
| 59. | Greensburg | 8.3% | 3.3%(+4.96)#59 | 3.5%(+4.79)#3,727 |
| 60. | Harrodsburg | 8.2% | 3.3%(+4.88)#60 | 3.5%(+4.71)#3,802 |
| 61. | New Castle | 8.2% | 3.3%(+4.85)#61 | 3.5%(+4.67)#3,837 |
| 62. | Bremen | 8.1% | 3.3%(+4.84)#62 | 3.5%(+4.67)#3,845 |
| 63. | Middlesborough | 8.1% | 3.3%(+4.81)#63 | 3.5%(+4.64)#3,862 |
| 64. | Elkton | 8.0% | 3.3%(+4.74)#64 | 3.5%(+4.56)#3,925 |
| 65. | Upton | 8.0% | 3.3%(+4.71)#65 | 3.5%(+4.54)#3,941 |
| 66. | West Buechel | 8.0% | 3.3%(+4.71)#66 | 3.5%(+4.54)#3,947 |
| 67. | Hodgenville | 7.9% | 3.3%(+4.59)#67 | 3.5%(+4.42)#4,054 |
| 68. | Pleasant Ridge | 7.8% | 3.3%(+4.44)#68 | 3.5%(+4.27)#4,179 |
| 69. | Buffalo | 7.7% | 3.3%(+4.38)#69 | 3.5%(+4.21)#4,224 |
| 70. | Whitesville | 7.7% | 3.3%(+4.35)#70 | 3.5%(+4.18)#4,278 |
| 71. | Catlettsburg | 7.6% | 3.3%(+4.31)#71 | 3.5%(+4.14)#4,300 |
| 72. | Vicco | 7.6% | 3.3%(+4.30)#72 | 3.5%(+4.13)#4,316 |
| 73. | Breckinridge Center | 7.6% | 3.3%(+4.29)#73 | 3.5%(+4.12)#4,322 |
| 74. | Brooksville | 7.6% | 3.3%(+4.26)#74 | 3.5%(+4.09)#4,347 |
| 75. | Wayland | 7.4% | 3.3%(+4.10)#75 | 3.5%(+3.92)#4,504 |
| 76. | Sharpsburg | 7.3% | 3.3%(+3.97)#76 | 3.5%(+3.80)#4,645 |
| 77. | Kingsley | 7.1% | 3.3%(+3.83)#77 | 3.5%(+3.66)#4,777 |
| 78. | Blandville | 7.1% | 3.3%(+3.83)#78 | 3.5%(+3.66)#4,790 |
| 79. | Liberty | 7.1% | 3.3%(+3.80)#79 | 3.5%(+3.63)#4,809 |
| 80. | Brooks | 7.1% | 3.3%(+3.77)#80 | 3.5%(+3.60)#4,833 |
| 81. | Mayking | 7.1% | 3.3%(+3.75)#81 | 3.5%(+3.58)#4,853 |
| 82. | Muldraugh | 7.0% | 3.3%(+3.66)#82 | 3.5%(+3.49)#4,971 |
| 83. | Cloverport | 6.9% | 3.3%(+3.58)#83 | 3.5%(+3.40)#5,074 |
| 84. | Earlington | 6.9% | 3.3%(+3.56)#84 | 3.5%(+3.39)#5,102 |
| 85. | Shively | 6.8% | 3.3%(+3.50)#85 | 3.5%(+3.33)#5,183 |
| 86. | Sacramento | 6.8% | 3.3%(+3.45)#86 | 3.5%(+3.28)#5,235 |
| 87. | Scottsville | 6.7% | 3.3%(+3.42)#87 | 3.5%(+3.25)#5,273 |
| 88. | Powderly | 6.6% | 3.3%(+3.30)#88 | 3.5%(+3.13)#5,434 |
| 89. | Salyersville | 6.5% | 3.3%(+3.20)#89 | 3.5%(+3.03)#5,574 |
| 90. | Flatwoods | 6.5% | 3.3%(+3.17)#90 | 3.5%(+3.00)#5,619 |
| 91. | West Point | 6.5% | 3.3%(+3.15)#91 | 3.5%(+2.98)#5,651 |
| 92. | Lynch | 6.5% | 3.3%(+3.14)#92 | 3.5%(+2.97)#5,661 |
| 93. | Plum Springs | 6.4% | 3.3%(+3.11)#93 | 3.5%(+2.93)#5,708 |
| 94. | Ryland Heights | 6.3% | 3.3%(+3.00)#94 | 3.5%(+2.83)#5,851 |
| 95. | Monticello | 6.3% | 3.3%(+2.94)#95 | 3.5%(+2.77)#5,950 |
| 96. | Claryville | 6.2% | 3.3%(+2.92)#96 | 3.5%(+2.75)#6,017 |
| 97. | Carlisle | 6.2% | 3.3%(+2.87)#97 | 3.5%(+2.70)#6,085 |
| 98. | Hardin | 6.2% | 3.3%(+2.87)#98 | 3.5%(+2.70)#6,093 |
| 99. | Mount Olivet | 6.1% | 3.3%(+2.81)#99 | 3.5%(+2.64)#6,192 |
| 100. | Maysville | 6.1% | 3.3%(+2.80)#100 | 3.5%(+2.63)#6,198 |
Common Questions
What are the Top 10 Cities with the Highest Percentage of Population Employed in Cleaning & Maintenance in Kentucky?
Top 10 Cities with the Highest Percentage of Population Employed in Cleaning & Maintenance in Kentucky are:
#1
34.0%
#2
29.6%
#3
29.5%
#4
28.5%
#5
27.7%
#6
26.7%
#7
20.3%
#8
18.8%
#9
18.2%
#10
18.1%
What city has the Highest Percentage of Population Employed in Cleaning & Maintenance in Kentucky?
Rockholds has the Highest Percentage of Population Employed in Cleaning & Maintenance in Kentucky with 34.0%.
What is the Percentage of Population Employed in Cleaning & Maintenance in the State of Kentucky?
Percentage of Population Employed in Cleaning & Maintenance in Kentucky is 3.3%.
What is the Percentage of Population Employed in Cleaning & Maintenance in the United States?
Percentage of Population Employed in Cleaning & Maintenance in the United States is 3.5%.