Guyanese College, Under 1 year
COMPARE
Guyanese
Select to Compare
College, Under 1 year
Guyanese College, Under 1 year
59.0%
COLLEGE, UNDER 1 YEAR
0.0/ 100
METRIC RATING
297th/ 347
METRIC RANK
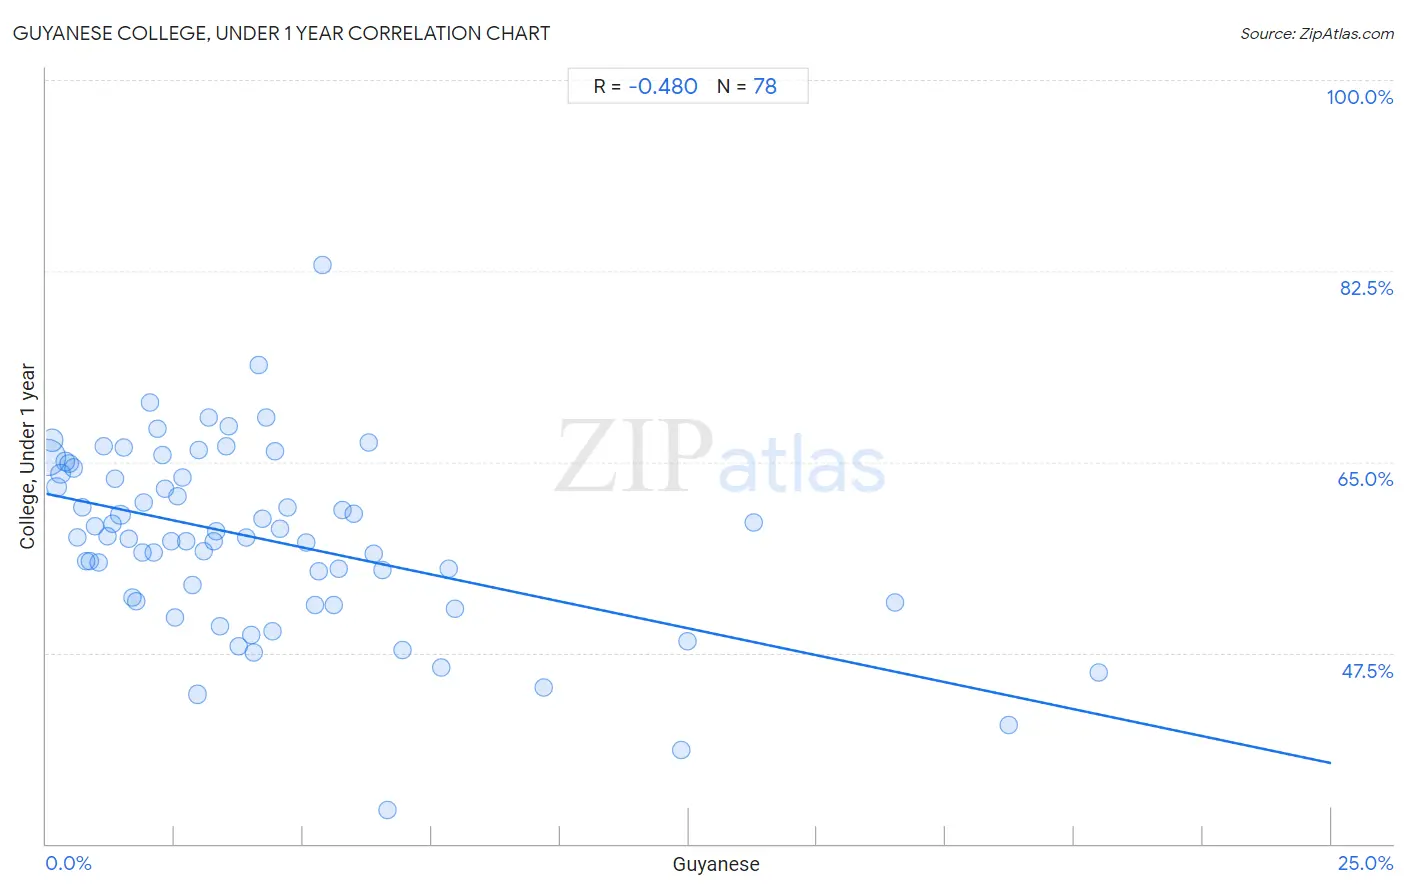
Guyanese College, Under 1 year Correlation Chart
The statistical analysis conducted on geographies consisting of 176,940,589 people shows a moderate negative correlation between the proportion of Guyanese and percentage of population with at least college, under 1 year education in the United States with a correlation coefficient (R) of -0.480 and weighted average of 59.0%. On average, for every 1% (one percent) increase in Guyanese within a typical geography, there is a decrease of 0.99% in percentage of population with at least college, under 1 year education.
It is essential to understand that the correlation between the percentage of Guyanese and percentage of population with at least college, under 1 year education does not imply a direct cause-and-effect relationship. It remains uncertain whether the presence of Guyanese influences an upward or downward trend in the level of percentage of population with at least college, under 1 year education within an area, or if Guyanese simply ended up residing in those areas with higher or lower levels of percentage of population with at least college, under 1 year education due to other factors.
Demographics Similar to Guyanese by College, Under 1 year
In terms of college, under 1 year, the demographic groups most similar to Guyanese are Central American Indian (59.0%, a difference of 0.040%), Immigrants from Grenada (59.1%, a difference of 0.080%), Immigrants from Belize (59.1%, a difference of 0.19%), Seminole (59.1%, a difference of 0.21%), and Nicaraguan (59.2%, a difference of 0.39%).
| Demographics | Rating | Rank | College, Under 1 year |
| Ecuadorians | 0.0 /100 | #290 | Tragic 59.3% |
| Creek | 0.0 /100 | #291 | Tragic 59.3% |
| Nicaraguans | 0.0 /100 | #292 | Tragic 59.2% |
| Seminole | 0.0 /100 | #293 | Tragic 59.1% |
| Immigrants from Belize | 0.0 /100 | #294 | Tragic 59.1% |
| Immigrants from Grenada | 0.0 /100 | #295 | Tragic 59.1% |
| Central American Indians | 0.0 /100 | #296 | Tragic 59.0% |
| Guyanese | 0.0 /100 | #297 | Tragic 59.0% |
| Immigrants from Ecuador | 0.0 /100 | #298 | Tragic 58.7% |
| Cubans | 0.0 /100 | #299 | Tragic 58.6% |
| Immigrants from Guyana | 0.0 /100 | #300 | Tragic 58.5% |
| Mexican American Indians | 0.0 /100 | #301 | Tragic 58.1% |
| Apache | 0.0 /100 | #302 | Tragic 58.0% |
| Immigrants from Dominica | 0.0 /100 | #303 | Tragic 57.9% |
| Kiowa | 0.0 /100 | #304 | Tragic 57.8% |
Guyanese College, Under 1 year Correlation Summary
| Measurement | Guyanese Data | College, Under 1 year Data |
| Minimum | 0.028% | 33.1% |
| Maximum | 20.5% | 83.1% |
| Range | 20.5% | 50.0% |
| Mean | 4.2% | 57.9% |
| Median | 3.2% | 58.1% |
| Interquartile 25% (IQ1) | 1.6% | 52.3% |
| Interquartile 75% (IQ3) | 5.4% | 64.0% |
| Interquartile Range (IQR) | 3.8% | 11.7% |
| Standard Deviation (Sample) | 4.1% | 8.4% |
| Standard Deviation (Population) | 4.0% | 8.3% |
Correlation Details
| Guyanese Percentile | Sample Size | College, Under 1 year |
[ 0.0% - 0.5% ] 0.028% | 105,620,363 | 65.4% |
[ 0.0% - 0.5% ] 0.12% | 24,641,630 | 67.0% |
[ 0.0% - 0.5% ] 0.20% | 10,493,657 | 62.7% |
[ 0.0% - 0.5% ] 0.28% | 7,265,296 | 64.0% |
[ 0.0% - 0.5% ] 0.37% | 3,906,724 | 65.0% |
[ 0.0% - 0.5% ] 0.45% | 2,747,279 | 64.8% |
[ 0.5% - 1.0% ] 0.53% | 1,932,765 | 64.4% |
[ 0.5% - 1.0% ] 0.61% | 1,383,154 | 58.1% |
[ 0.5% - 1.0% ] 0.71% | 1,741,449 | 60.9% |
[ 0.5% - 1.0% ] 0.78% | 823,110 | 55.9% |
[ 0.5% - 1.0% ] 0.86% | 1,625,921 | 55.9% |
[ 0.5% - 1.0% ] 0.94% | 260,822 | 59.1% |
[ 1.0% - 1.5% ] 1.02% | 731,131 | 55.7% |
[ 1.0% - 1.5% ] 1.11% | 331,595 | 66.5% |
[ 1.0% - 1.5% ] 1.18% | 202,516 | 58.2% |
[ 1.0% - 1.5% ] 1.28% | 165,217 | 59.3% |
[ 1.0% - 1.5% ] 1.34% | 215,349 | 63.4% |
[ 1.0% - 1.5% ] 1.44% | 9,101,728 | 60.1% |
[ 1.5% - 2.0% ] 1.51% | 97,919 | 66.3% |
[ 1.5% - 2.0% ] 1.60% | 84,644 | 58.0% |
[ 1.5% - 2.0% ] 1.68% | 132,279 | 52.6% |
[ 1.5% - 2.0% ] 1.76% | 129,820 | 52.3% |
[ 1.5% - 2.0% ] 1.86% | 91,105 | 56.7% |
[ 1.5% - 2.0% ] 1.91% | 143,709 | 61.3% |
[ 2.0% - 2.5% ] 2.01% | 33,555 | 70.4% |
[ 2.0% - 2.5% ] 2.09% | 152,542 | 56.7% |
[ 2.0% - 2.5% ] 2.16% | 35,059 | 68.0% |
[ 2.0% - 2.5% ] 2.26% | 107,305 | 65.6% |
[ 2.0% - 2.5% ] 2.32% | 39,894 | 62.6% |
[ 2.0% - 2.5% ] 2.43% | 56,385 | 57.8% |
[ 2.5% - 3.0% ] 2.51% | 22,745 | 50.8% |
[ 2.5% - 3.0% ] 2.56% | 112,496 | 61.9% |
[ 2.5% - 3.0% ] 2.64% | 10,531 | 63.5% |
[ 2.5% - 3.0% ] 2.72% | 87,187 | 57.7% |
[ 2.5% - 3.0% ] 2.83% | 101,103 | 53.8% |
[ 2.5% - 3.0% ] 2.93% | 180,896 | 43.7% |
[ 2.5% - 3.0% ] 2.97% | 44,140 | 66.1% |
[ 3.0% - 3.5% ] 3.07% | 103,918 | 56.8% |
[ 3.0% - 3.5% ] 3.15% | 71,908 | 69.0% |
[ 3.0% - 3.5% ] 3.26% | 68,043 | 57.7% |
[ 3.0% - 3.5% ] 3.31% | 41,511 | 58.7% |
[ 3.0% - 3.5% ] 3.39% | 60,268 | 49.9% |
[ 3.5% - 4.0% ] 3.51% | 4,783 | 66.5% |
[ 3.5% - 4.0% ] 3.55% | 5,131 | 68.3% |
[ 3.5% - 4.0% ] 3.75% | 120,337 | 48.1% |
[ 3.5% - 4.0% ] 3.89% | 156,163 | 58.1% |
[ 3.5% - 4.0% ] 3.98% | 72,273 | 49.1% |
[ 4.0% - 4.5% ] 4.04% | 7,284 | 47.5% |
[ 4.0% - 4.5% ] 4.14% | 11,110 | 73.9% |
[ 4.0% - 4.5% ] 4.22% | 14,367 | 59.8% |
[ 4.0% - 4.5% ] 4.27% | 6,529 | 69.0% |
[ 4.0% - 4.5% ] 4.40% | 39,557 | 49.5% |
[ 4.0% - 4.5% ] 4.46% | 112,720 | 65.9% |
[ 4.5% - 5.0% ] 4.56% | 64,268 | 58.9% |
[ 4.5% - 5.0% ] 4.68% | 131,608 | 60.8% |
[ 5.0% - 5.5% ] 5.05% | 137,948 | 57.6% |
[ 5.0% - 5.5% ] 5.24% | 68,879 | 51.9% |
[ 5.0% - 5.5% ] 5.31% | 21,901 | 55.0% |
[ 5.0% - 5.5% ] 5.37% | 4,562 | 83.1% |
[ 5.5% - 6.0% ] 5.60% | 49,622 | 51.9% |
[ 5.5% - 6.0% ] 5.70% | 31,953 | 55.2% |
[ 5.5% - 6.0% ] 5.75% | 16,374 | 60.6% |
[ 5.5% - 6.0% ] 5.99% | 25,585 | 60.3% |
[ 6.0% - 6.5% ] 6.26% | 2,219 | 66.8% |
[ 6.0% - 6.5% ] 6.37% | 35,154 | 56.6% |
[ 6.5% - 7.0% ] 6.54% | 70,611 | 55.0% |
[ 6.5% - 7.0% ] 6.63% | 108,180 | 33.1% |
[ 6.5% - 7.0% ] 6.93% | 27,794 | 47.7% |
[ 7.5% - 8.0% ] 7.68% | 8,128 | 46.1% |
[ 7.5% - 8.0% ] 7.83% | 138,467 | 55.2% |
[ 7.5% - 8.0% ] 7.96% | 31,613 | 51.5% |
[ 9.5% - 10.0% ] 9.68% | 38,865 | 44.3% |
[ 12.0% - 12.5% ] 12.35% | 7,863 | 38.6% |
[ 12.0% - 12.5% ] 12.47% | 21,349 | 48.6% |
[ 13.5% - 14.0% ] 13.78% | 29,921 | 59.4% |
[ 16.5% - 17.0% ] 16.52% | 19,554 | 52.1% |
[ 18.5% - 19.0% ] 18.74% | 48,096 | 40.9% |
[ 20.0% - 20.5% ] 20.48% | 51,153 | 45.7% |