Eastwood, MI
Eastwood Map
Eastwood Overview
6,497
TOTAL POPULATION
3,108
MALE POPULATION
3,389
FEMALE POPULATION
91.71
MALES / 100 FEMALES
109.04
FEMALES / 100 MALES
33.5
MEDIAN AGE
2.8
AVG FAMILY SIZE
2.3
AVG HOUSEHOLD SIZE
$26,606
PER CAPITA INCOME
$61,658
AVG FAMILY INCOME
$54,231
AVG HOUSEHOLD INCOME
3.8%
WAGE / INCOME GAP [ % ]
96.2¢/ $1
WAGE / INCOME GAP [ $ ]
$7,613
FAMILY INCOME DEFICIT
0.37
INEQUALITY / GINI INDEX
3,752
LABOR FORCE [ PEOPLE ]
74.0%
PERCENT IN LABOR FORCE
8.0%
UNEMPLOYMENT RATE
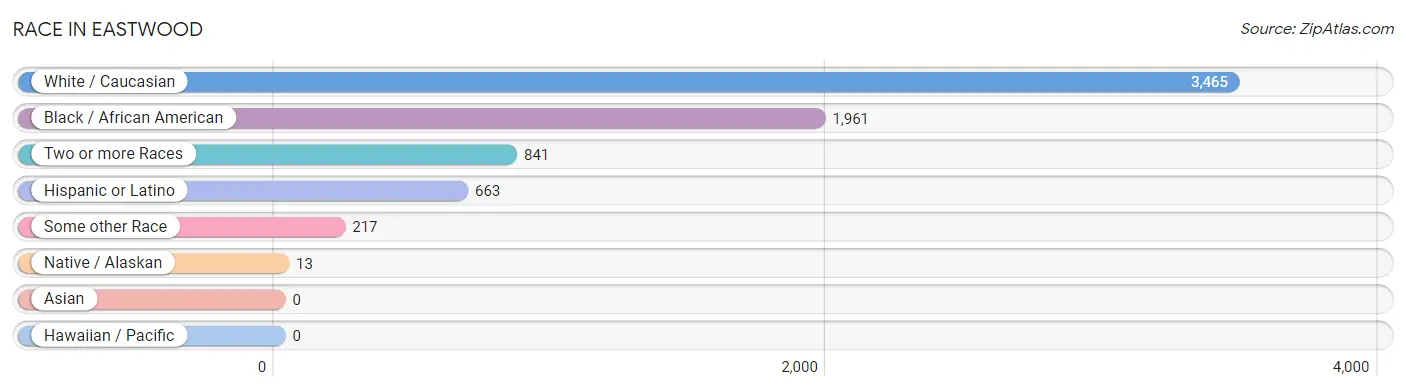
Race in Eastwood
The most populous races in Eastwood are White / Caucasian (3,465 | 53.3%), Black / African American (1,961 | 30.2%), and Two or more Races (841 | 12.9%).
| Race | # Population | % Population |
| Asian | 0 | 0.0% |
| Black / African American | 1,961 | 30.2% |
| Hawaiian / Pacific | 0 | 0.0% |
| Hispanic or Latino | 663 | 10.2% |
| Native / Alaskan | 13 | 0.2% |
| White / Caucasian | 3,465 | 53.3% |
| Two or more Races | 841 | 12.9% |
| Some other Race | 217 | 3.3% |
| Total | 6,497 | 100.0% |
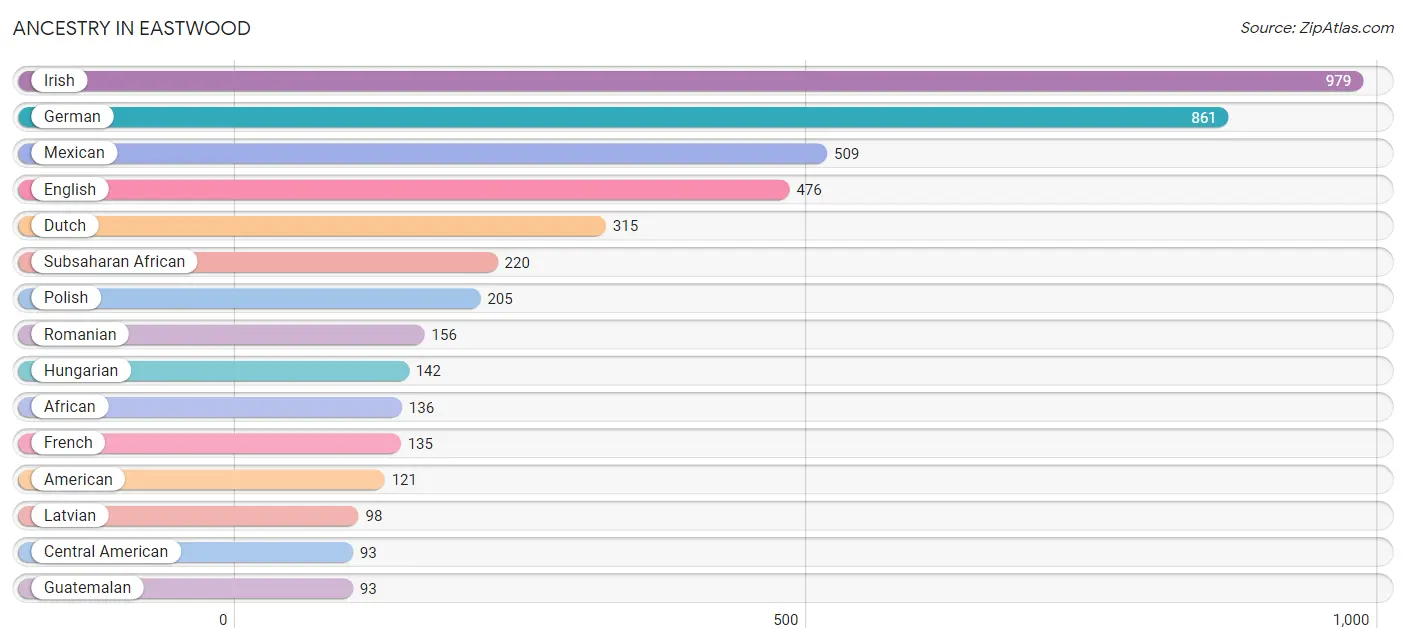
Ancestry in Eastwood
The most populous ancestries reported in Eastwood are Irish (979 | 15.1%), German (861 | 13.3%), Mexican (509 | 7.8%), English (476 | 7.3%), and Dutch (315 | 4.9%), together accounting for 48.3% of all Eastwood residents.
| Ancestry | # Population | % Population |
| African | 136 | 2.1% |
| American | 121 | 1.9% |
| Argentinean | 54 | 0.8% |
| Blackfeet | 64 | 1.0% |
| British | 71 | 1.1% |
| Central American | 93 | 1.4% |
| Cherokee | 3 | 0.1% |
| Chippewa | 10 | 0.2% |
| Czech | 14 | 0.2% |
| Danish | 11 | 0.2% |
| Dutch | 315 | 4.9% |
| English | 476 | 7.3% |
| European | 86 | 1.3% |
| Finnish | 6 | 0.1% |
| French | 135 | 2.1% |
| French Canadian | 24 | 0.4% |
| German | 861 | 13.3% |
| Guatemalan | 93 | 1.4% |
| Hungarian | 142 | 2.2% |
| Irish | 979 | 15.1% |
| Italian | 4 | 0.1% |
| Latvian | 98 | 1.5% |
| Mexican | 509 | 7.8% |
| Norwegian | 23 | 0.4% |
| Polish | 205 | 3.2% |
| Romanian | 156 | 2.4% |
| Scandinavian | 18 | 0.3% |
| Scotch-Irish | 83 | 1.3% |
| Scottish | 40 | 0.6% |
| Slovak | 27 | 0.4% |
| South American | 54 | 0.8% |
| Spanish | 7 | 0.1% |
| Subsaharan African | 220 | 3.4% |
| Swedish | 26 | 0.4% | View All 34 Rows |
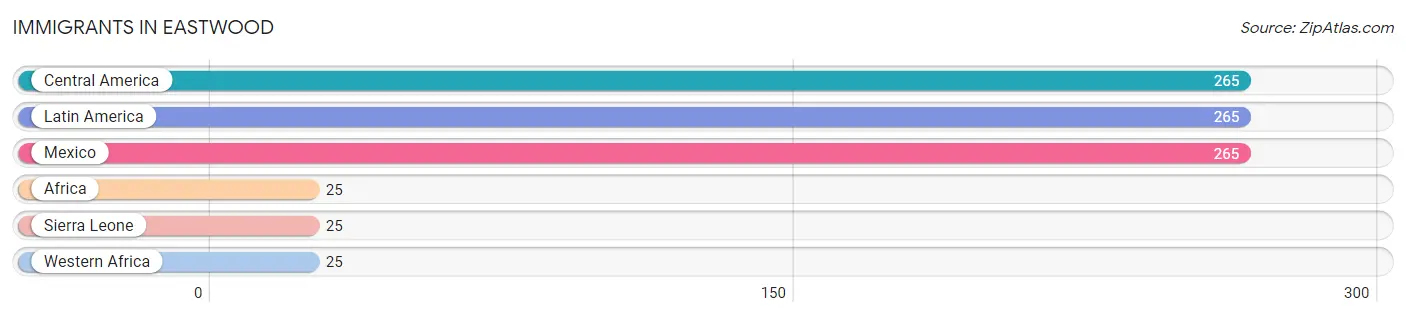
Immigrants in Eastwood
The most numerous immigrant groups reported in Eastwood came from Central America (265 | 4.1%), Latin America (265 | 4.1%), Mexico (265 | 4.1%), Africa (25 | 0.4%), and Sierra Leone (25 | 0.4%), together accounting for 13.0% of all Eastwood residents.
| Immigration Origin | # Population | % Population |
| Africa | 25 | 0.4% |
| Central America | 265 | 4.1% |
| Latin America | 265 | 4.1% |
| Mexico | 265 | 4.1% |
| Sierra Leone | 25 | 0.4% |
| Western Africa | 25 | 0.4% | View All 6 Rows |
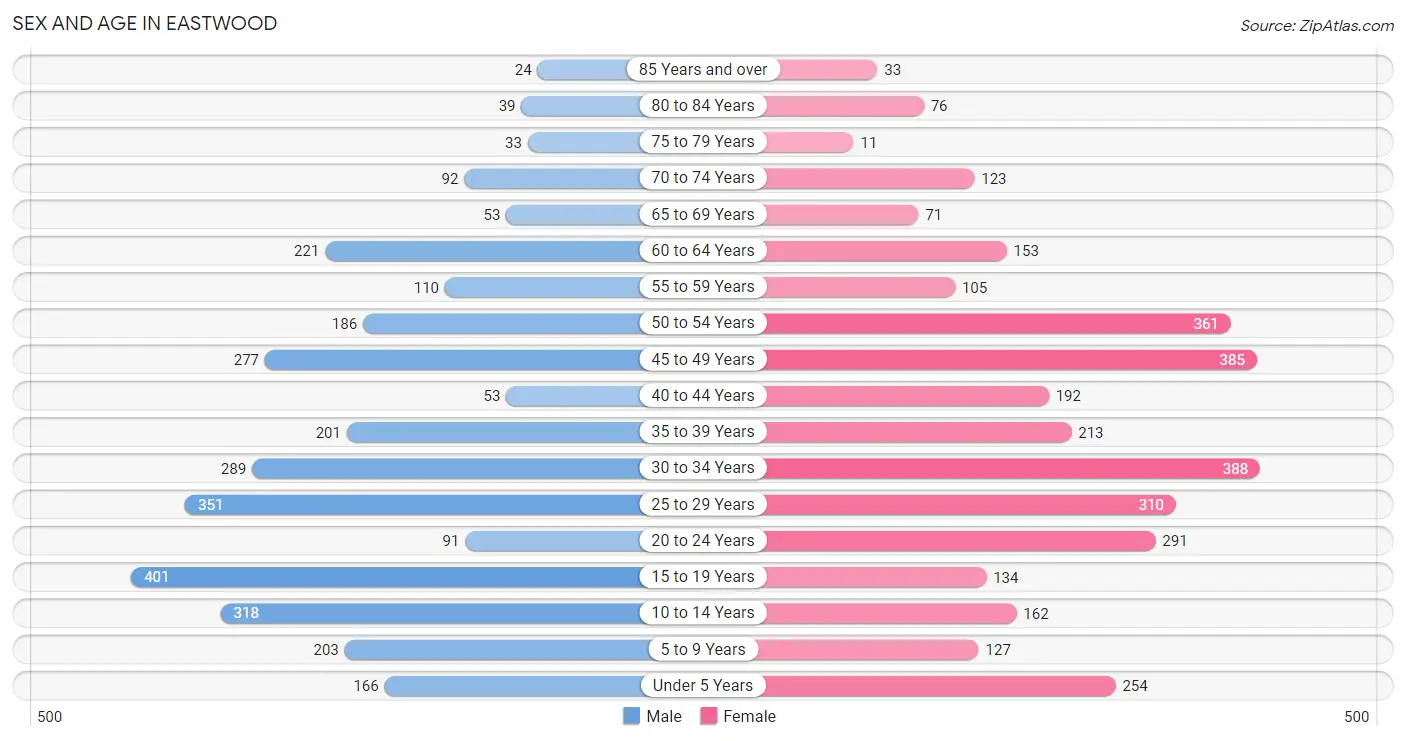
Sex and Age in Eastwood
Sex and Age in Eastwood
The most populous age groups in Eastwood are 15 to 19 Years (401 | 12.9%) for men and 30 to 34 Years (388 | 11.5%) for women.
| Age Bracket | Male | Female |
| Under 5 Years | 166 (5.3%) | 254 (7.5%) |
| 5 to 9 Years | 203 (6.5%) | 127 (3.7%) |
| 10 to 14 Years | 318 (10.2%) | 162 (4.8%) |
| 15 to 19 Years | 401 (12.9%) | 134 (4.0%) |
| 20 to 24 Years | 91 (2.9%) | 291 (8.6%) |
| 25 to 29 Years | 351 (11.3%) | 310 (9.1%) |
| 30 to 34 Years | 289 (9.3%) | 388 (11.5%) |
| 35 to 39 Years | 201 (6.5%) | 213 (6.3%) |
| 40 to 44 Years | 53 (1.7%) | 192 (5.7%) |
| 45 to 49 Years | 277 (8.9%) | 385 (11.4%) |
| 50 to 54 Years | 186 (6.0%) | 361 (10.6%) |
| 55 to 59 Years | 110 (3.5%) | 105 (3.1%) |
| 60 to 64 Years | 221 (7.1%) | 153 (4.5%) |
| 65 to 69 Years | 53 (1.7%) | 71 (2.1%) |
| 70 to 74 Years | 92 (3.0%) | 123 (3.6%) |
| 75 to 79 Years | 33 (1.1%) | 11 (0.3%) |
| 80 to 84 Years | 39 (1.3%) | 76 (2.2%) |
| 85 Years and over | 24 (0.8%) | 33 (1.0%) |
| Total | 3,108 (100.0%) | 3,389 (100.0%) |
Families and Households in Eastwood
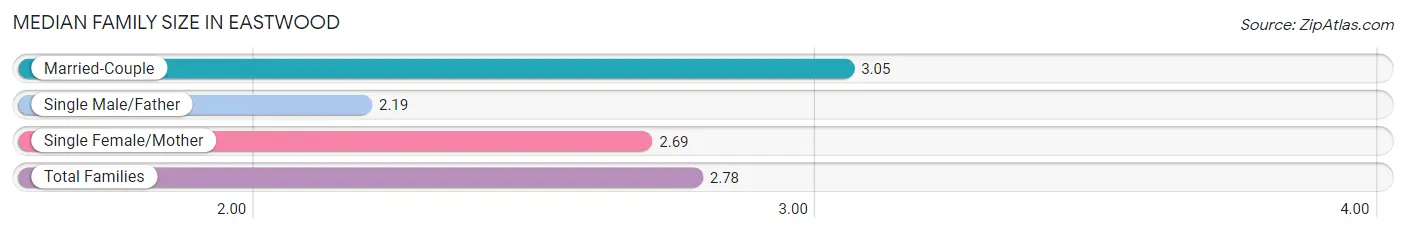
Median Family Size in Eastwood
The median family size in Eastwood is 2.78 persons per family, with married-couple families (808 | 43.8%) accounting for the largest median family size of 3.05 persons per family. On the other hand, single male/father families (244 | 13.2%) represent the smallest median family size with 2.19 persons per family.
| Family Type | # Families | Family Size |
| Married-Couple | 808 (43.8%) | 3.05 |
| Single Male/Father | 244 (13.2%) | 2.19 |
| Single Female/Mother | 791 (42.9%) | 2.69 |
| Total Families | 1,843 (100.0%) | 2.78 |
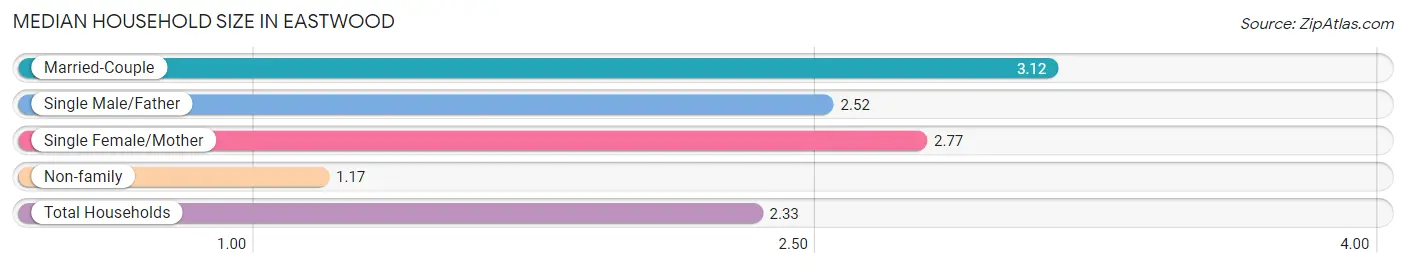
Median Household Size in Eastwood
The median household size in Eastwood is 2.33 persons per household, with married-couple households (808 | 29.5%) accounting for the largest median household size of 3.12 persons per household. non-family households (891 | 32.6%) represent the smallest median household size with 1.17 persons per household.
| Household Type | # Households | Household Size |
| Married-Couple | 808 (29.5%) | 3.12 |
| Single Male/Father | 244 (8.9%) | 2.52 |
| Single Female/Mother | 791 (28.9%) | 2.77 |
| Non-family | 891 (32.6%) | 1.17 |
| Total Households | 2,734 (100.0%) | 2.33 |
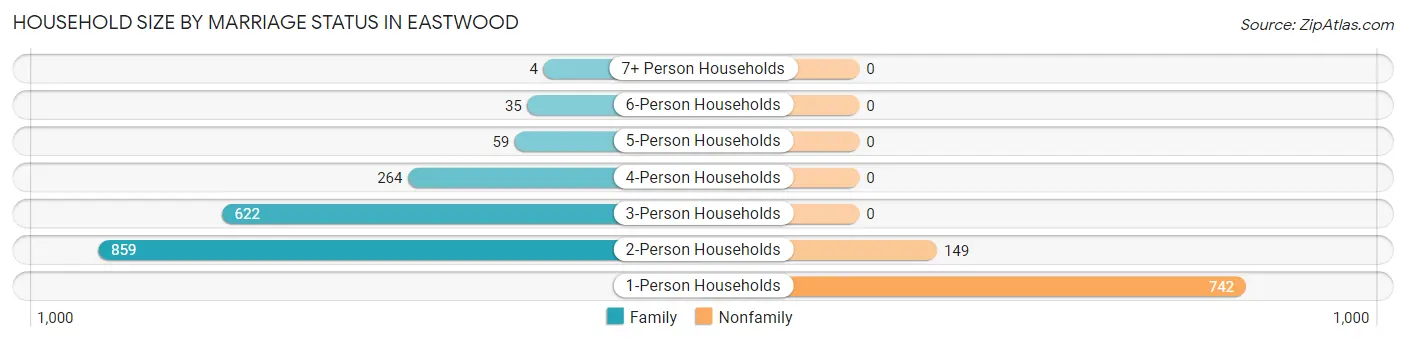
Household Size by Marriage Status in Eastwood
Out of a total of 2,734 households in Eastwood, 1,843 (67.4%) are family households, while 891 (32.6%) are nonfamily households. The most numerous type of family households are 2-person households, comprising 859, and the most common type of nonfamily households are 1-person households, comprising 742.
| Household Size | Family Households | Nonfamily Households |
| 1-Person Households | - | 742 (27.1%) |
| 2-Person Households | 859 (31.4%) | 149 (5.4%) |
| 3-Person Households | 622 (22.8%) | 0 (0.0%) |
| 4-Person Households | 264 (9.7%) | 0 (0.0%) |
| 5-Person Households | 59 (2.2%) | 0 (0.0%) |
| 6-Person Households | 35 (1.3%) | 0 (0.0%) |
| 7+ Person Households | 4 (0.2%) | 0 (0.0%) |
| Total | 1,843 (67.4%) | 891 (32.6%) |
Female Fertility in Eastwood
Fertility by Age in Eastwood
Average fertility rate in Eastwood is 77.0 births per 1,000 women. Women in the age bracket of 20 to 34 years have the highest fertility rate with 153.0 births per 1,000 women. Women in the age bracket of 20 to 34 years acount for 100.0% of all women with births.
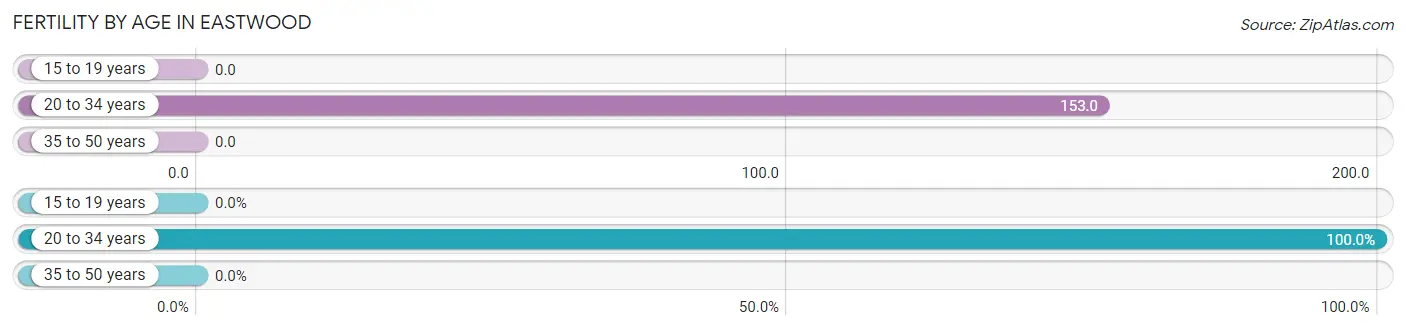
| Age Bracket | Women with Births | Births / 1,000 Women |
| 15 to 19 years | 0 (0.0%) | 0.0 |
| 20 to 34 years | 151 (100.0%) | 153.0 |
| 35 to 50 years | 0 (0.0%) | 0.0 |
| Total | 151 (100.0%) | 77.0 |
Fertility by Age by Marriage Status in Eastwood
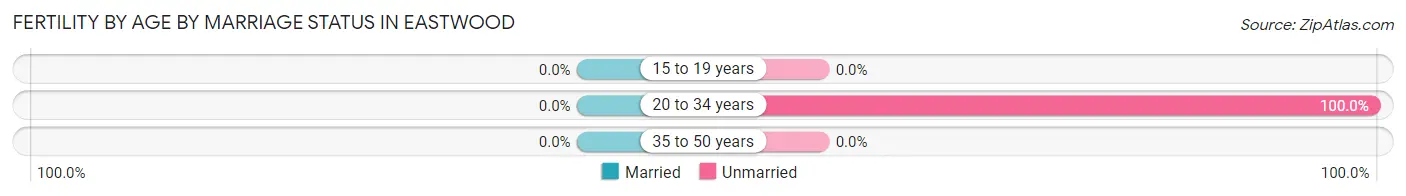
| Age Bracket | Married | Unmarried |
| 15 to 19 years | 0 (0.0%) | 0 (0.0%) |
| 20 to 34 years | 0 (0.0%) | 151 (100.0%) |
| 35 to 50 years | 0 (0.0%) | 0 (0.0%) |
| Total | 0 (0.0%) | 151 (100.0%) |
Fertility by Education in Eastwood
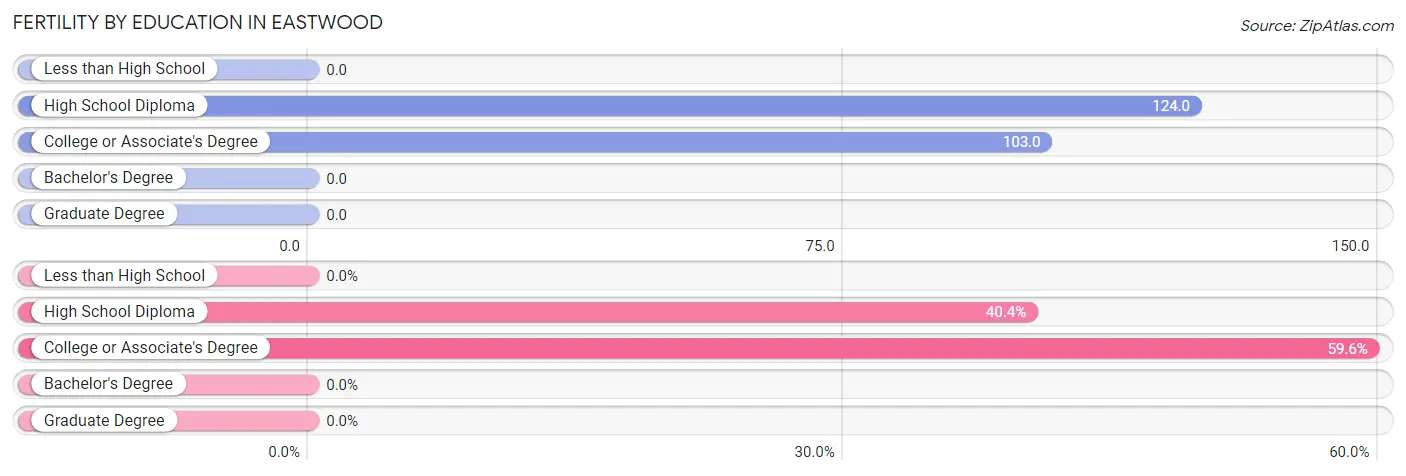
| Educational Attainment | Women with Births | Births / 1,000 Women |
| Less than High School | 0 (0.0%) | 0.0 |
| High School Diploma | 61 (40.4%) | 124.0 |
| College or Associate's Degree | 90 (59.6%) | 103.0 |
| Bachelor's Degree | 0 (0.0%) | 0.0 |
| Graduate Degree | 0 (0.0%) | 0.0 |
| Total | 151 (100.0%) | 77.0 |
Fertility by Education by Marriage Status in Eastwood
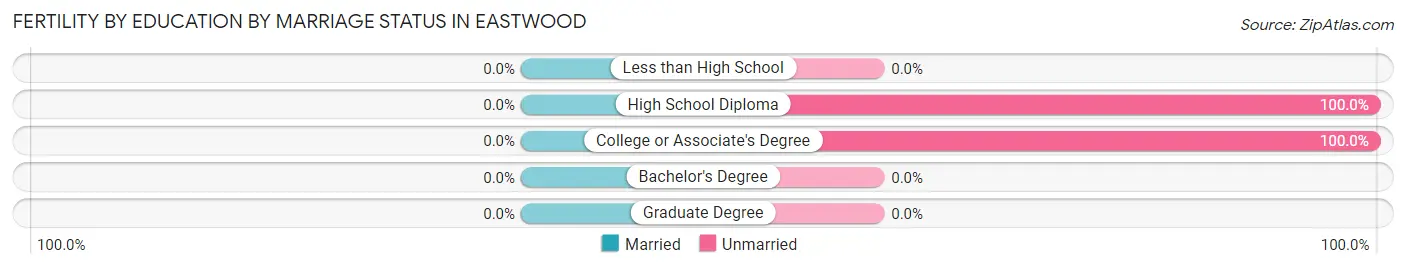
| Educational Attainment | Married | Unmarried |
| Less than High School | 0 (0.0%) | 0 (0.0%) |
| High School Diploma | 0 (0.0%) | 61 (100.0%) |
| College or Associate's Degree | 0 (0.0%) | 90 (100.0%) |
| Bachelor's Degree | 0 (0.0%) | 0 (0.0%) |
| Graduate Degree | 0 (0.0%) | 0 (0.0%) |
| Total | 0 (0.0%) | 151 (100.0%) |
Income in Eastwood
Income Overview in Eastwood
Per Capita Income in Eastwood is $26,606, while median incomes of families and households are $61,658 and $54,231 respectively.
| Characteristic | Number | Measure |
| Per Capita Income | 6,497 | $26,606 |
| Median Family Income | 1,843 | $61,658 |
| Mean Family Income | 1,843 | $70,181 |
| Median Household Income | 2,734 | $54,231 |
| Mean Household Income | 2,734 | $63,688 |
| Income Deficit | 1,843 | $7,613 |
| Wage / Income Gap (%) | 6,497 | 3.78% |
| Wage / Income Gap ($) | 6,497 | 96.22¢ per $1 |
| Gini / Inequality Index | 6,497 | 0.37 |
Earnings by Sex in Eastwood
Average Earnings in Eastwood are $34,532, $35,390 for men and $34,054 for women, a difference of 3.8%.
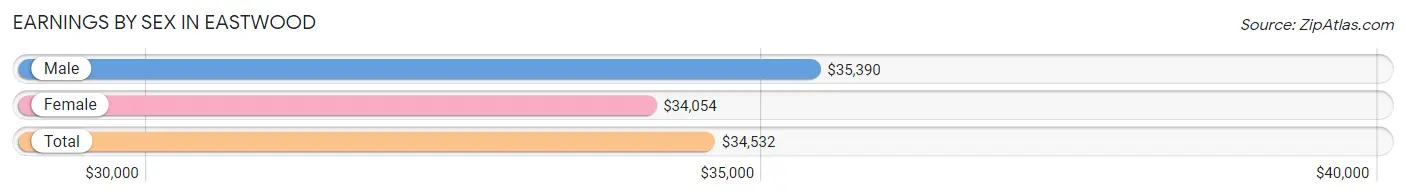
| Sex | Number | Average Earnings |
| Male | 1,843 (46.8%) | $35,390 |
| Female | 2,095 (53.2%) | $34,054 |
| Total | 3,938 (100.0%) | $34,532 |
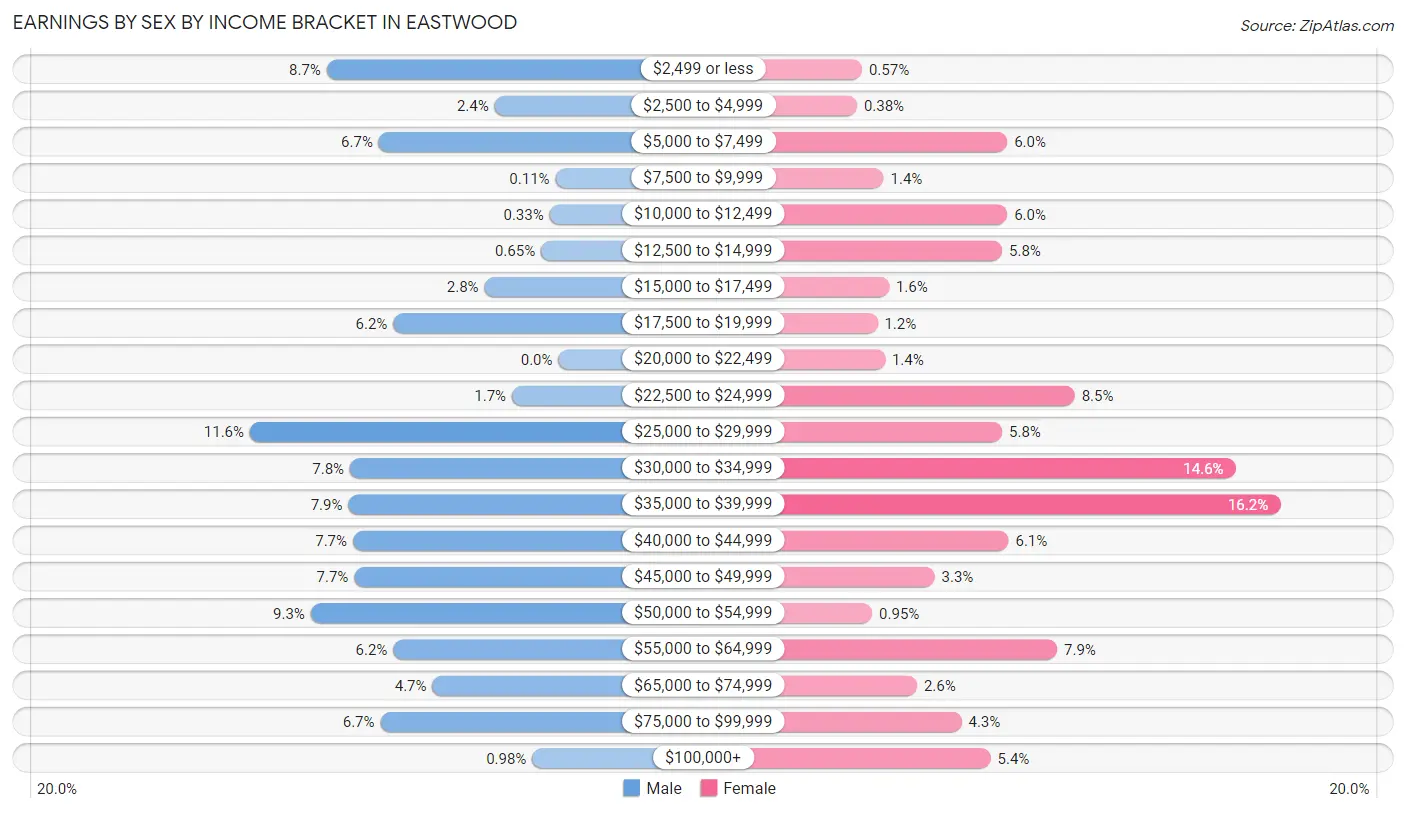
Earnings by Sex by Income Bracket in Eastwood
The most common earnings brackets in Eastwood are $25,000 to $29,999 for men (213 | 11.6%) and $35,000 to $39,999 for women (340 | 16.2%).
| Income | Male | Female |
| $2,499 or less | 160 (8.7%) | 12 (0.6%) |
| $2,500 to $4,999 | 44 (2.4%) | 8 (0.4%) |
| $5,000 to $7,499 | 124 (6.7%) | 126 (6.0%) |
| $7,500 to $9,999 | 2 (0.1%) | 29 (1.4%) |
| $10,000 to $12,499 | 6 (0.3%) | 126 (6.0%) |
| $12,500 to $14,999 | 12 (0.6%) | 122 (5.8%) |
| $15,000 to $17,499 | 51 (2.8%) | 33 (1.6%) |
| $17,500 to $19,999 | 114 (6.2%) | 24 (1.1%) |
| $20,000 to $22,499 | 0 (0.0%) | 30 (1.4%) |
| $22,500 to $24,999 | 32 (1.7%) | 179 (8.5%) |
| $25,000 to $29,999 | 213 (11.6%) | 122 (5.8%) |
| $30,000 to $34,999 | 144 (7.8%) | 305 (14.6%) |
| $35,000 to $39,999 | 145 (7.9%) | 340 (16.2%) |
| $40,000 to $44,999 | 142 (7.7%) | 127 (6.1%) |
| $45,000 to $49,999 | 141 (7.6%) | 69 (3.3%) |
| $50,000 to $54,999 | 171 (9.3%) | 20 (0.9%) |
| $55,000 to $64,999 | 114 (6.2%) | 165 (7.9%) |
| $65,000 to $74,999 | 87 (4.7%) | 55 (2.6%) |
| $75,000 to $99,999 | 123 (6.7%) | 90 (4.3%) |
| $100,000+ | 18 (1.0%) | 113 (5.4%) |
| Total | 1,843 (100.0%) | 2,095 (100.0%) |
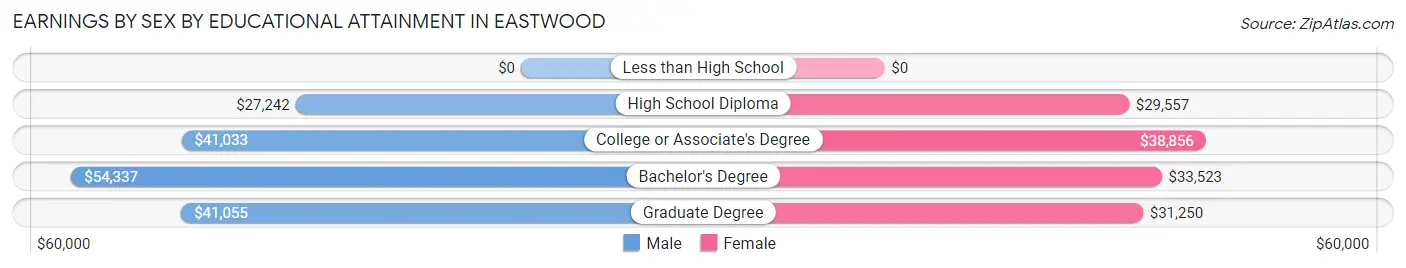
Earnings by Sex by Educational Attainment in Eastwood
Average earnings in Eastwood are $38,000 for men and $36,113 for women, a difference of 5.0%. Men with an educational attainment of bachelor's degree enjoy the highest average annual earnings of $54,337, while those with high school diploma education earn the least with $27,242. Women with an educational attainment of college or associate's degree earn the most with the average annual earnings of $38,856, while those with high school diploma education have the smallest earnings of $29,557.
| Educational Attainment | Male Income | Female Income |
| Less than High School | - | - |
| High School Diploma | $27,242 | $29,557 |
| College or Associate's Degree | $41,033 | $38,856 |
| Bachelor's Degree | $54,337 | $33,523 |
| Graduate Degree | $41,055 | $31,250 |
| Total | $38,000 | $36,113 |
Family Income in Eastwood
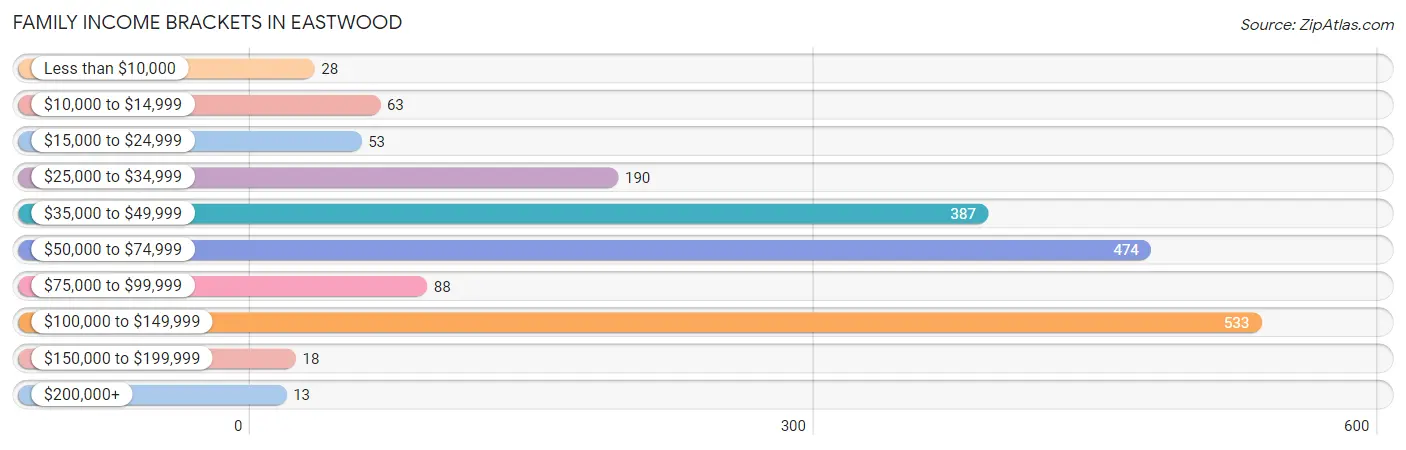
Family Income Brackets in Eastwood
According to the Eastwood family income data, there are 533 families falling into the $100,000 to $149,999 income range, which is the most common income bracket and makes up 28.9% of all families. Conversely, the $200,000+ income bracket is the least frequent group with only 13 families (0.7%) belonging to this category.
| Income Bracket | # Families | % Families |
| Less than $10,000 | 28 | 1.5% |
| $10,000 to $14,999 | 63 | 3.4% |
| $15,000 to $24,999 | 53 | 2.9% |
| $25,000 to $34,999 | 190 | 10.3% |
| $35,000 to $49,999 | 387 | 21.0% |
| $50,000 to $74,999 | 474 | 25.7% |
| $75,000 to $99,999 | 88 | 4.8% |
| $100,000 to $149,999 | 533 | 28.9% |
| $150,000 to $199,999 | 18 | 1.0% |
| $200,000+ | 13 | 0.7% |
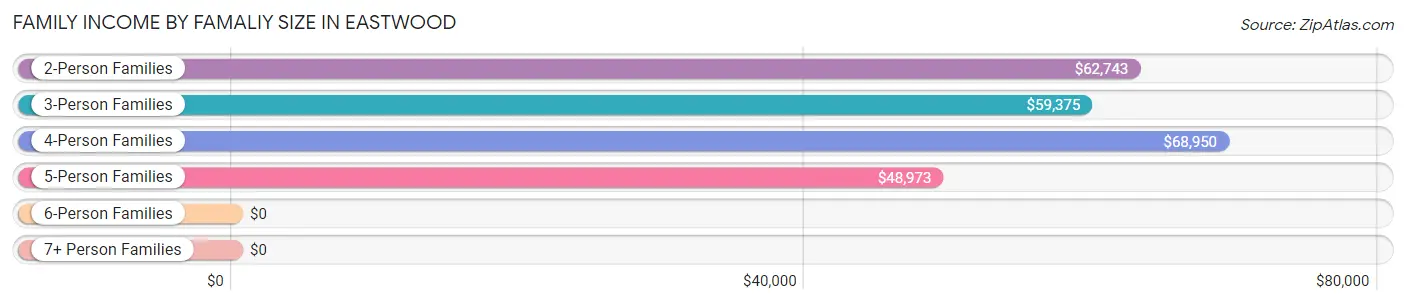
Family Income by Famaliy Size in Eastwood
4-person families (227 | 12.3%) account for the highest median family income in Eastwood with $68,950 per family, while 2-person families (1,014 | 55.0%) have the highest median income of $31,372 per family member.
| Income Bracket | # Families | Median Income |
| 2-Person Families | 1,014 (55.0%) | $62,743 |
| 3-Person Families | 516 (28.0%) | $59,375 |
| 4-Person Families | 227 (12.3%) | $68,950 |
| 5-Person Families | 47 (2.5%) | $48,973 |
| 6-Person Families | 35 (1.9%) | $0 |
| 7+ Person Families | 4 (0.2%) | $0 |
| Total | 1,843 (100.0%) | $61,658 |
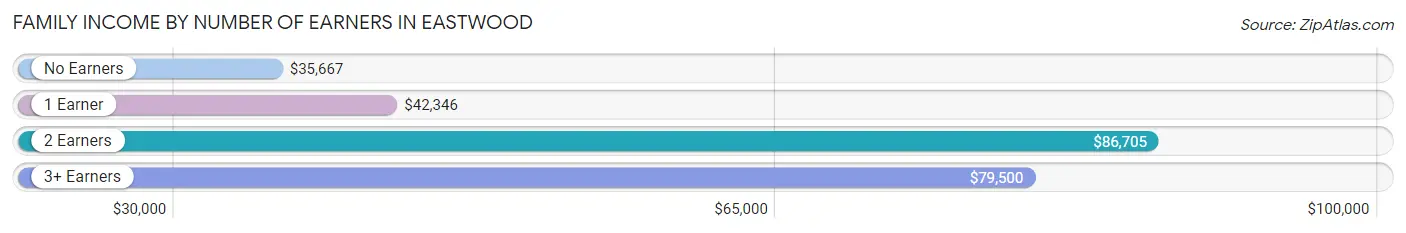
Family Income by Number of Earners in Eastwood
The median family income in Eastwood is $61,658, with families comprising 2 earners (978) having the highest median family income of $86,705, while families with no earners (140) have the lowest median family income of $35,667, accounting for 53.1% and 7.6% of families, respectively.
| Number of Earners | # Families | Median Income |
| No Earners | 140 (7.6%) | $35,667 |
| 1 Earner | 585 (31.7%) | $42,346 |
| 2 Earners | 978 (53.1%) | $86,705 |
| 3+ Earners | 140 (7.6%) | $79,500 |
| Total | 1,843 (100.0%) | $61,658 |
Household Income in Eastwood
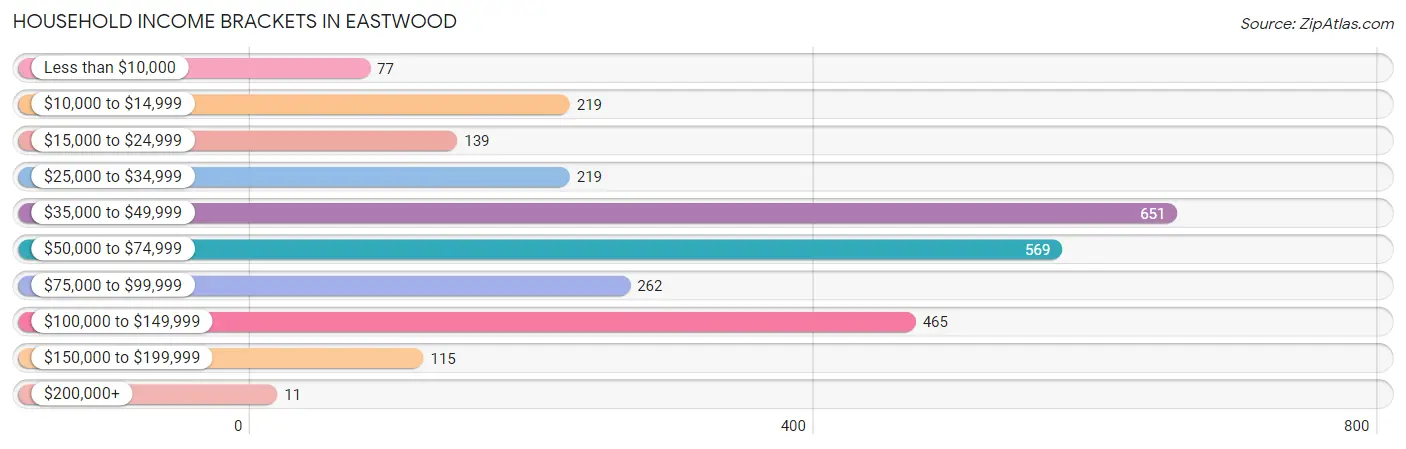
Household Income Brackets in Eastwood
With 651 households falling in the category, the $35,000 to $49,999 income range is the most frequent in Eastwood, accounting for 23.8% of all households. In contrast, only 11 households (0.4%) fall into the $200,000+ income bracket, making it the least populous group.
| Income Bracket | # Households | % Households |
| Less than $10,000 | 77 | 2.8% |
| $10,000 to $14,999 | 219 | 8.0% |
| $15,000 to $24,999 | 139 | 5.1% |
| $25,000 to $34,999 | 219 | 8.0% |
| $35,000 to $49,999 | 651 | 23.8% |
| $50,000 to $74,999 | 569 | 20.8% |
| $75,000 to $99,999 | 262 | 9.6% |
| $100,000 to $149,999 | 465 | 17.0% |
| $150,000 to $199,999 | 115 | 4.2% |
| $200,000+ | 11 | 0.4% |
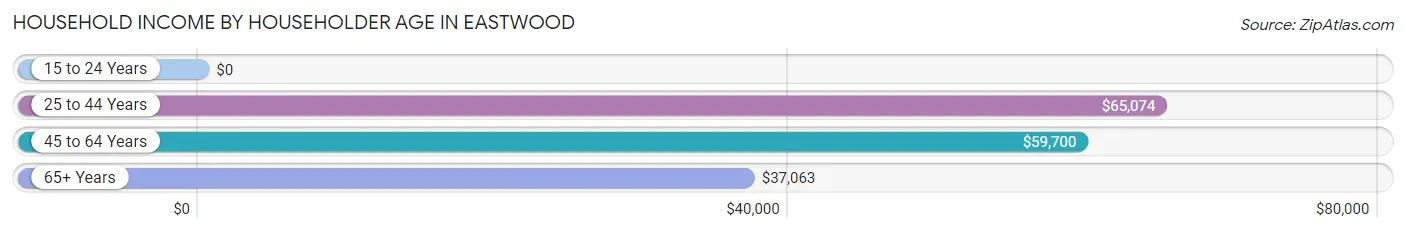
Household Income by Householder Age in Eastwood
The median household income in Eastwood is $54,231, with the highest median household income of $65,074 found in the 25 to 44 years age bracket for the primary householder. A total of 1,023 households (37.4%) fall into this category. Meanwhile, the 15 to 24 years age bracket for the primary householder has the lowest median household income of $0, with 63 households (2.3%) in this group.
| Income Bracket | # Households | Median Income |
| 15 to 24 Years | 63 (2.3%) | $0 |
| 25 to 44 Years | 1,023 (37.4%) | $65,074 |
| 45 to 64 Years | 1,180 (43.2%) | $59,700 |
| 65+ Years | 468 (17.1%) | $37,063 |
| Total | 2,734 (100.0%) | $54,231 |
Poverty in Eastwood
Income Below Poverty by Sex and Age in Eastwood
With 4.0% poverty level for males and 10.5% for females among the residents of Eastwood, 65 to 74 year old males and 65 to 74 year old females are the most vulnerable to poverty, with 38 males (26.2%) and 44 females (22.7%) in their respective age groups living below the poverty level.
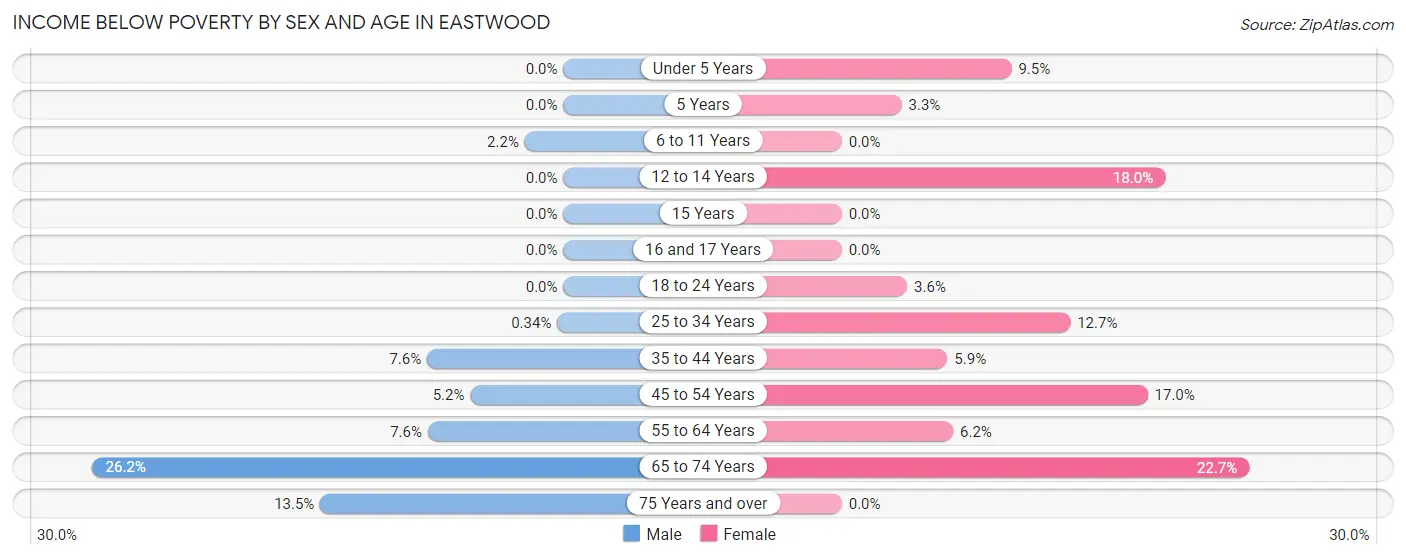
| Age Bracket | Male | Female |
| Under 5 Years | 0 (0.0%) | 24 (9.5%) |
| 5 Years | 0 (0.0%) | 3 (3.3%) |
| 6 to 11 Years | 2 (2.1%) | 0 (0.0%) |
| 12 to 14 Years | 0 (0.0%) | 18 (18.0%) |
| 15 Years | 0 (0.0%) | 0 (0.0%) |
| 16 and 17 Years | 0 (0.0%) | 0 (0.0%) |
| 18 to 24 Years | 0 (0.0%) | 12 (3.6%) |
| 25 to 34 Years | 2 (0.3%) | 87 (12.7%) |
| 35 to 44 Years | 18 (7.6%) | 23 (5.9%) |
| 45 to 54 Years | 24 (5.2%) | 126 (17.0%) |
| 55 to 64 Years | 25 (7.5%) | 16 (6.2%) |
| 65 to 74 Years | 38 (26.2%) | 44 (22.7%) |
| 75 Years and over | 13 (13.5%) | 0 (0.0%) |
| Total | 122 (4.0%) | 353 (10.5%) |
Income Above Poverty by Sex and Age in Eastwood
According to the poverty statistics in Eastwood, males aged under 5 years and females aged 6 to 11 years are the age groups that are most secure financially, with 100.0% of males and 100.0% of females in these age groups living above the poverty line.
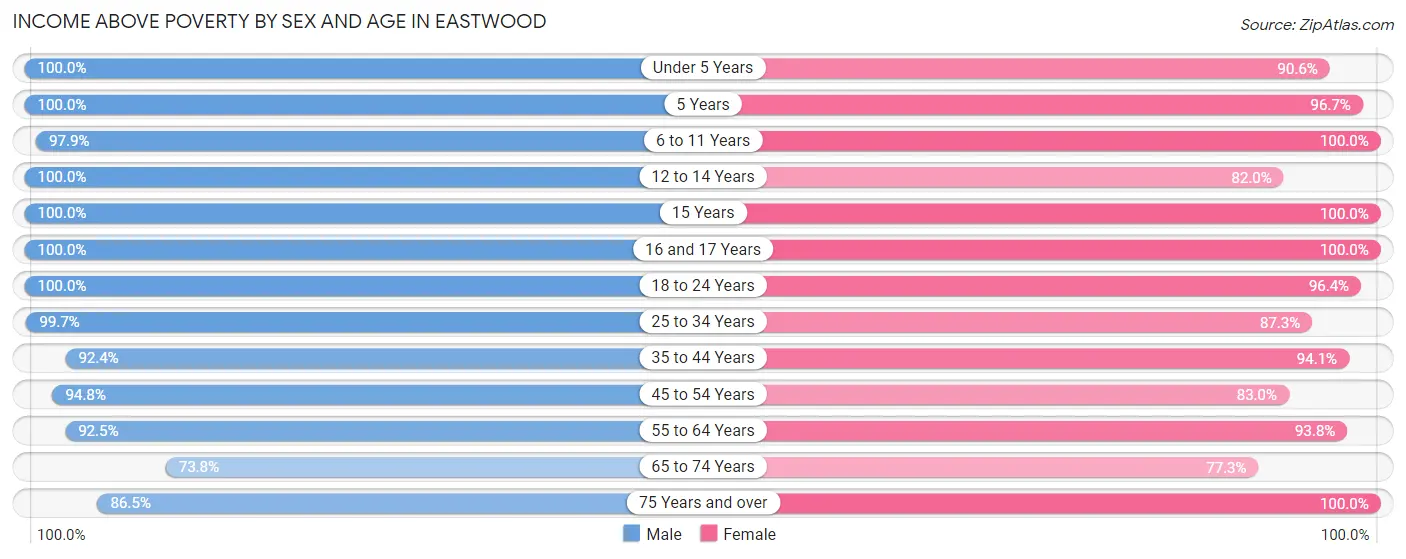
| Age Bracket | Male | Female |
| Under 5 Years | 166 (100.0%) | 230 (90.5%) |
| 5 Years | 153 (100.0%) | 87 (96.7%) |
| 6 to 11 Years | 91 (97.9%) | 99 (100.0%) |
| 12 to 14 Years | 275 (100.0%) | 82 (82.0%) |
| 15 Years | 156 (100.0%) | 41 (100.0%) |
| 16 and 17 Years | 59 (100.0%) | 54 (100.0%) |
| 18 to 24 Years | 259 (100.0%) | 318 (96.4%) |
| 25 to 34 Years | 595 (99.7%) | 597 (87.3%) |
| 35 to 44 Years | 219 (92.4%) | 368 (94.1%) |
| 45 to 54 Years | 439 (94.8%) | 614 (83.0%) |
| 55 to 64 Years | 306 (92.4%) | 242 (93.8%) |
| 65 to 74 Years | 107 (73.8%) | 150 (77.3%) |
| 75 Years and over | 83 (86.5%) | 120 (100.0%) |
| Total | 2,908 (96.0%) | 3,002 (89.5%) |
Income Below Poverty Among Married-Couple Families in Eastwood
The poverty statistics for married-couple families in Eastwood show that 4.7% or 38 of the total 808 families live below the poverty line. Families with no children have the highest poverty rate of 9.3%, comprising of 36 families. On the other hand, families with 3 or 4 children have the lowest poverty rate of 0.0%, which includes 0 families.
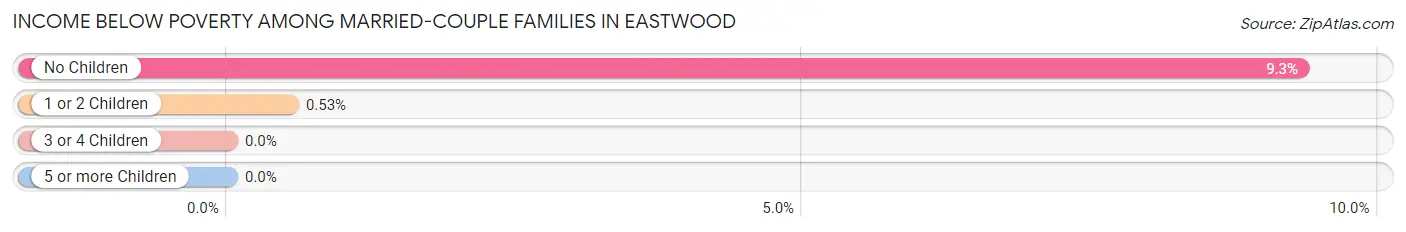
| Children | Above Poverty | Below Poverty |
| No Children | 350 (90.7%) | 36 (9.3%) |
| 1 or 2 Children | 377 (99.5%) | 2 (0.5%) |
| 3 or 4 Children | 43 (100.0%) | 0 (0.0%) |
| 5 or more Children | 0 (0.0%) | 0 (0.0%) |
| Total | 770 (95.3%) | 38 (4.7%) |
Income Below Poverty Among Single-Parent Households in Eastwood
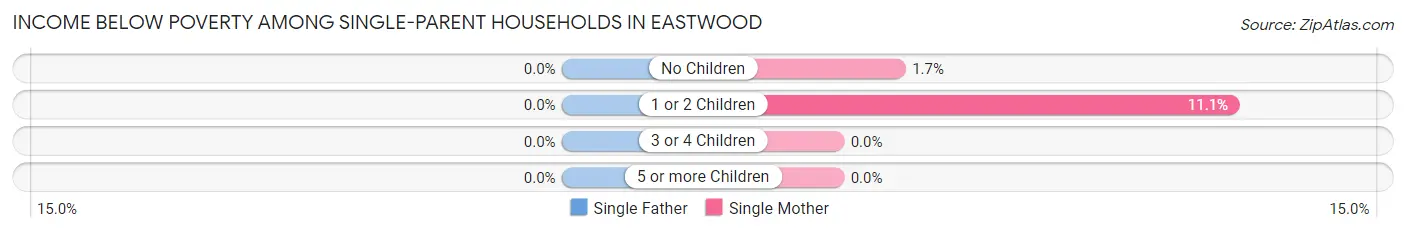
| Children | Single Father | Single Mother |
| No Children | 0 (0.0%) | 4 (1.7%) |
| 1 or 2 Children | 0 (0.0%) | 58 (11.1%) |
| 3 or 4 Children | 0 (0.0%) | 0 (0.0%) |
| 5 or more Children | 0 (0.0%) | 0 (0.0%) |
| Total | 0 (0.0%) | 62 (7.8%) |
Income Below Poverty Among Married-Couple vs Single-Parent Households in Eastwood
The poverty data for Eastwood shows that 38 of the married-couple family households (4.7%) and 62 of the single-parent households (6.0%) are living below the poverty level. Within the married-couple family households, those with no children have the highest poverty rate, with 36 households (9.3%) falling below the poverty line. Among the single-parent households, those with 1 or 2 children have the highest poverty rate, with 58 household (10.3%) living below poverty.
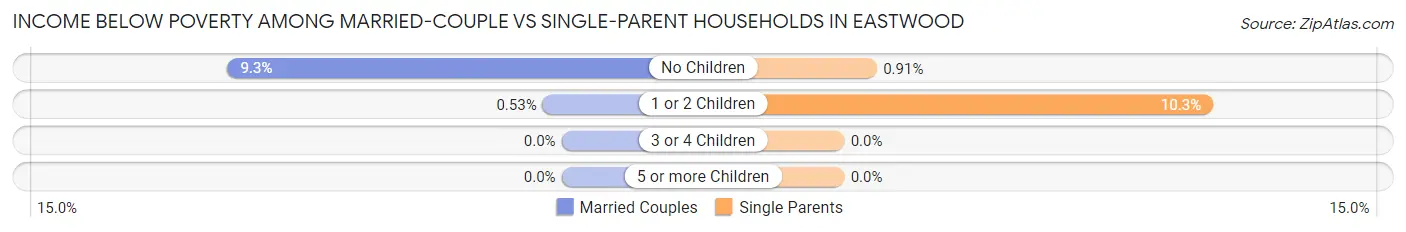
| Children | Married-Couple Families | Single-Parent Households |
| No Children | 36 (9.3%) | 4 (0.9%) |
| 1 or 2 Children | 2 (0.5%) | 58 (10.3%) |
| 3 or 4 Children | 0 (0.0%) | 0 (0.0%) |
| 5 or more Children | 0 (0.0%) | 0 (0.0%) |
| Total | 38 (4.7%) | 62 (6.0%) |
Employment Characteristics in Eastwood
Employment by Class of Employer in Eastwood
Among the 3,197 employed individuals in Eastwood, private company employees (2,155 | 67.4%), not-for-profit organizations (499 | 15.6%), and local government employees (239 | 7.5%) make up the most common classes of employment.
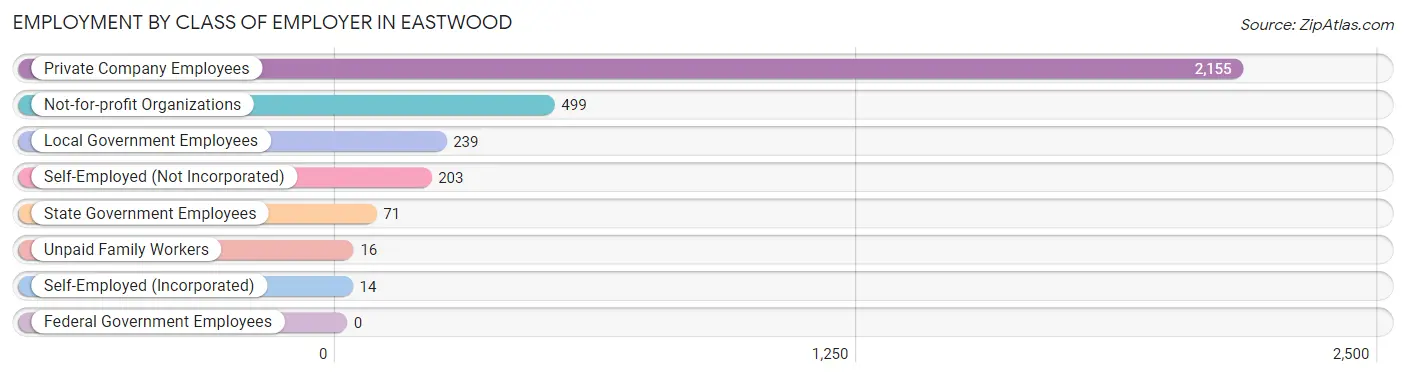
| Employer Class | # Employees | % Employees |
| Private Company Employees | 2,155 | 67.4% |
| Self-Employed (Incorporated) | 14 | 0.4% |
| Self-Employed (Not Incorporated) | 203 | 6.4% |
| Not-for-profit Organizations | 499 | 15.6% |
| Local Government Employees | 239 | 7.5% |
| State Government Employees | 71 | 2.2% |
| Federal Government Employees | 0 | 0.0% |
| Unpaid Family Workers | 16 | 0.5% |
| Total | 3,197 | 100.0% |
Employment Status by Age in Eastwood
According to the labor force statistics for Eastwood, out of the total population over 16 years of age (5,070), 74.0% or 3,752 individuals are in the labor force, with 8.0% or 300 of them unemployed. The age group with the highest labor force participation rate is 20 to 24 years, with 98.7% or 377 individuals in the labor force. Within the labor force, the 16 to 19 years age range has the highest percentage of unemployed individuals, with 37.3% or 63 of them being unemployed.
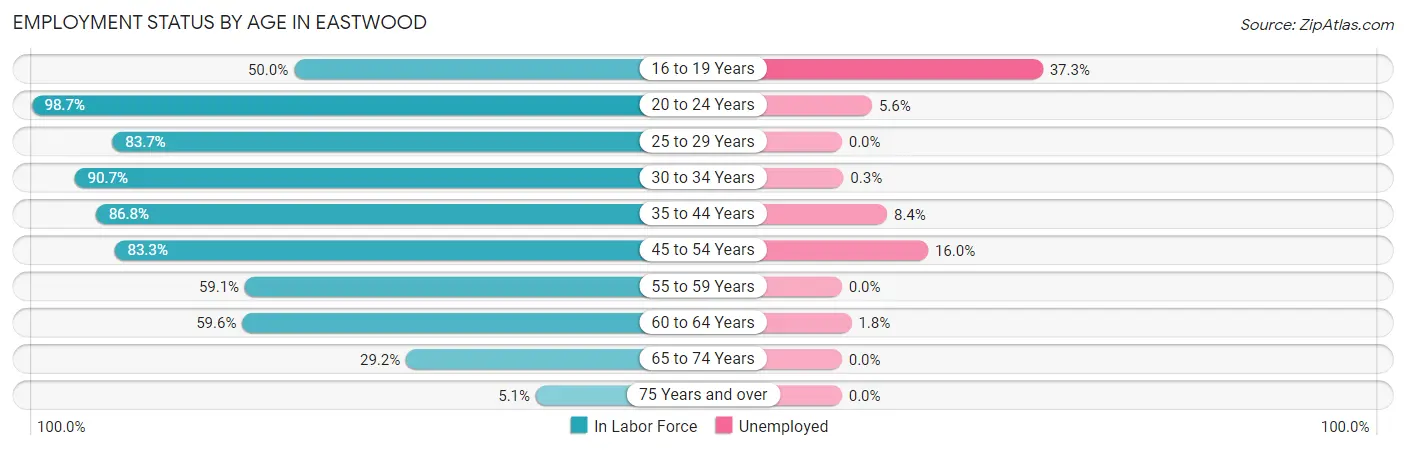
| Age Bracket | In Labor Force | Unemployed |
| 16 to 19 Years | 169 (50.0%) | 63 (37.3%) |
| 20 to 24 Years | 377 (98.7%) | 21 (5.6%) |
| 25 to 29 Years | 553 (83.7%) | 0 (0.0%) |
| 30 to 34 Years | 614 (90.7%) | 2 (0.3%) |
| 35 to 44 Years | 572 (86.8%) | 48 (8.4%) |
| 45 to 54 Years | 1,007 (83.3%) | 161 (16.0%) |
| 55 to 59 Years | 127 (59.1%) | 0 (0.0%) |
| 60 to 64 Years | 223 (59.6%) | 4 (1.8%) |
| 65 to 74 Years | 99 (29.2%) | 0 (0.0%) |
| 75 Years and over | 11 (5.1%) | 0 (0.0%) |
| Total | 3,752 (74.0%) | 300 (8.0%) |
Employment Status by Educational Attainment in Eastwood
According to labor force statistics for Eastwood, 81.6% of individuals (3,097) out of the total population between 25 and 64 years of age (3,795) are in the labor force, with 6.9% or 214 of them being unemployed. The group with the highest labor force participation rate are those with the educational attainment of college / associate degree, with 93.8% or 1,443 individuals in the labor force. Within the labor force, individuals with less than high school education have the highest percentage of unemployment, with 30.4% or 59 of them being unemployed.
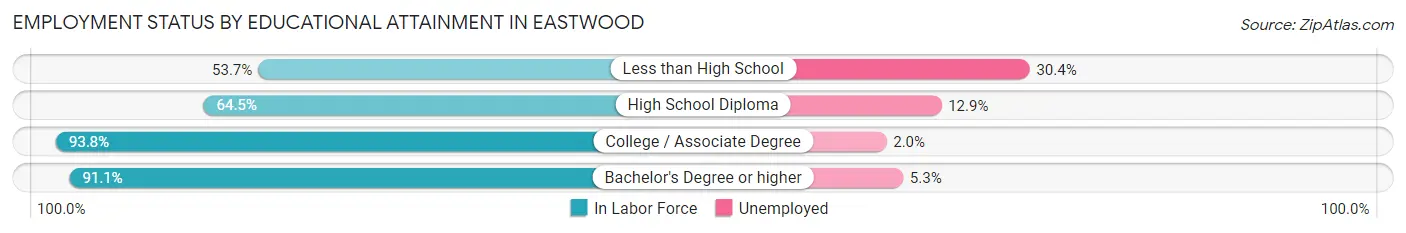
| Educational Attainment | In Labor Force | Unemployed |
| Less than High School | 194 (53.7%) | 110 (30.4%) |
| High School Diploma | 650 (64.5%) | 130 (12.9%) |
| College / Associate Degree | 1,443 (93.8%) | 31 (2.0%) |
| Bachelor's Degree or higher | 810 (91.1%) | 47 (5.3%) |
| Total | 3,097 (81.6%) | 262 (6.9%) |
Employment Occupations by Sex in Eastwood
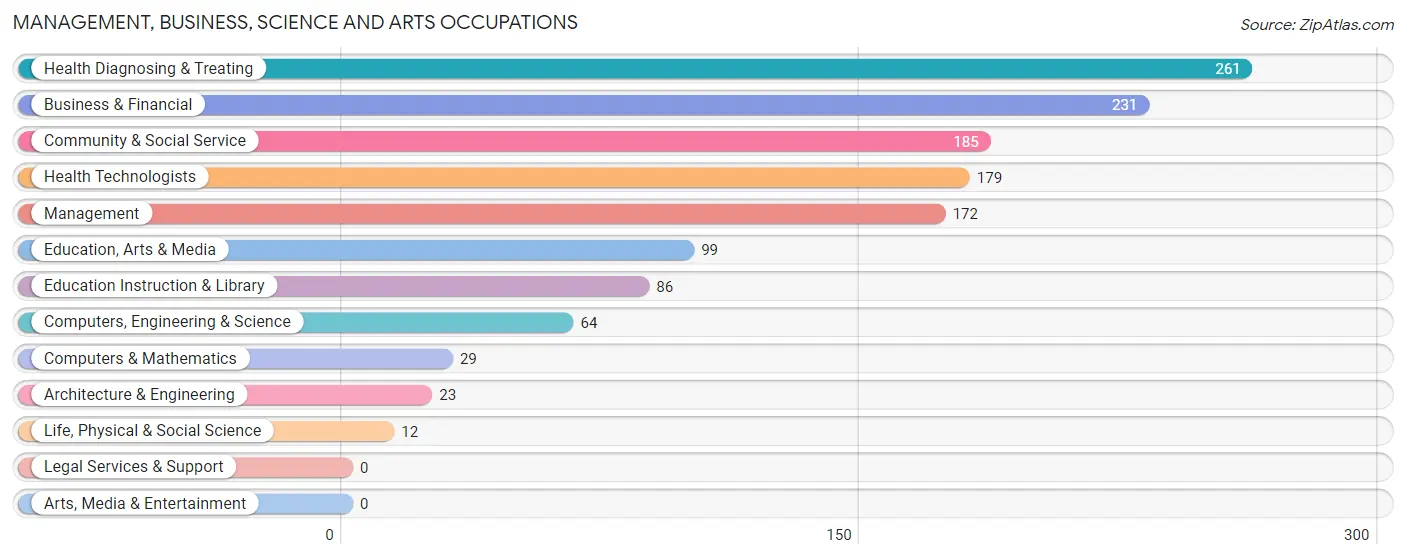
Management, Business, Science and Arts Occupations
The most common Management, Business, Science and Arts occupations in Eastwood are Health Diagnosing & Treating (261 | 7.6%), Business & Financial (231 | 6.7%), Community & Social Service (185 | 5.4%), Health Technologists (179 | 5.2%), and Management (172 | 5.0%).
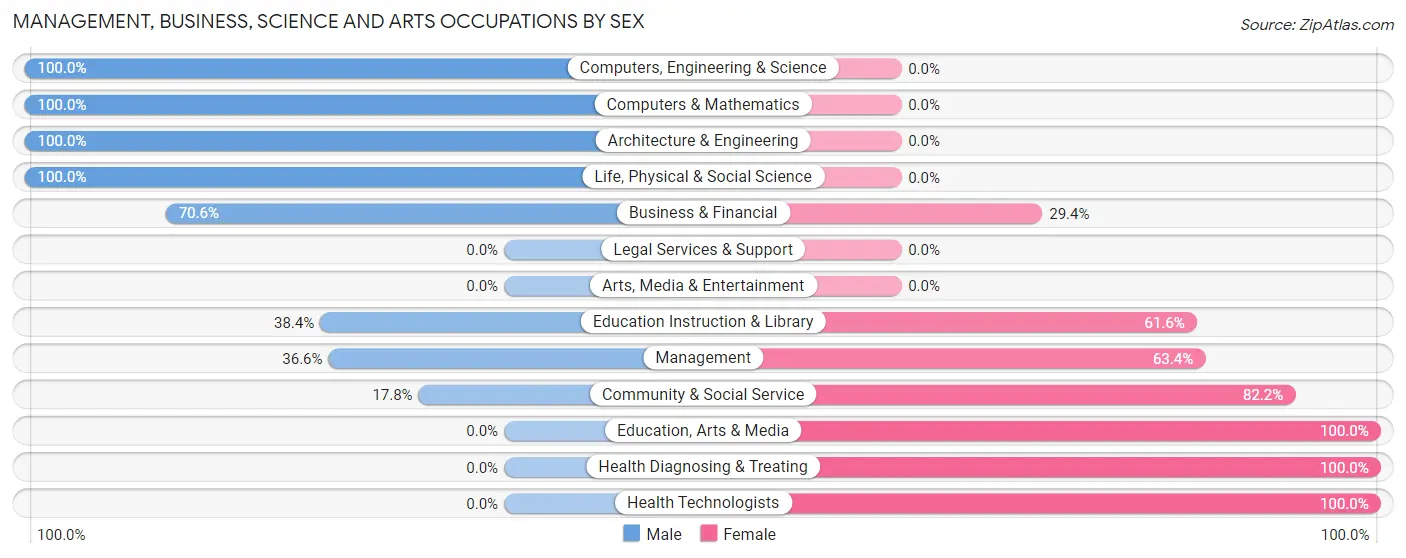
Management, Business, Science and Arts Occupations by Sex
Within the Management, Business, Science and Arts occupations in Eastwood, the most male-oriented occupations are Computers, Engineering & Science (100.0%), Computers & Mathematics (100.0%), and Architecture & Engineering (100.0%), while the most female-oriented occupations are Education, Arts & Media (100.0%), Health Diagnosing & Treating (100.0%), and Health Technologists (100.0%).
| Occupation | Male | Female |
| Management | 63 (36.6%) | 109 (63.4%) |
| Business & Financial | 163 (70.6%) | 68 (29.4%) |
| Computers, Engineering & Science | 64 (100.0%) | 0 (0.0%) |
| Computers & Mathematics | 29 (100.0%) | 0 (0.0%) |
| Architecture & Engineering | 23 (100.0%) | 0 (0.0%) |
| Life, Physical & Social Science | 12 (100.0%) | 0 (0.0%) |
| Community & Social Service | 33 (17.8%) | 152 (82.2%) |
| Education, Arts & Media | 0 (0.0%) | 99 (100.0%) |
| Legal Services & Support | 0 (0.0%) | 0 (0.0%) |
| Education Instruction & Library | 33 (38.4%) | 53 (61.6%) |
| Arts, Media & Entertainment | 0 (0.0%) | 0 (0.0%) |
| Health Diagnosing & Treating | 0 (0.0%) | 261 (100.0%) |
| Health Technologists | 0 (0.0%) | 179 (100.0%) |
| Total (Category) | 323 (35.4%) | 590 (64.6%) |
| Total (Overall) | 1,444 (41.8%) | 2,009 (58.2%) |
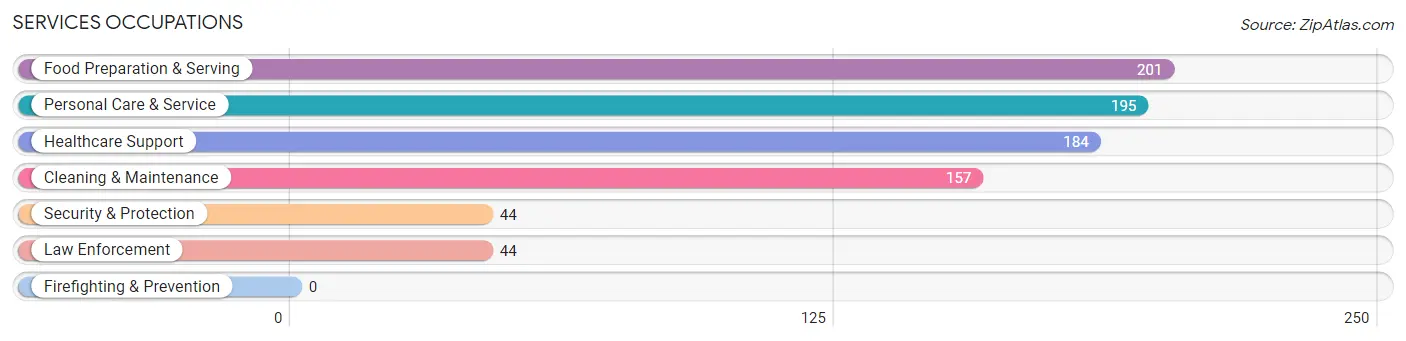
Services Occupations
The most common Services occupations in Eastwood are Food Preparation & Serving (201 | 5.8%), Personal Care & Service (195 | 5.7%), Healthcare Support (184 | 5.3%), Cleaning & Maintenance (157 | 4.5%), and Security & Protection (44 | 1.3%).
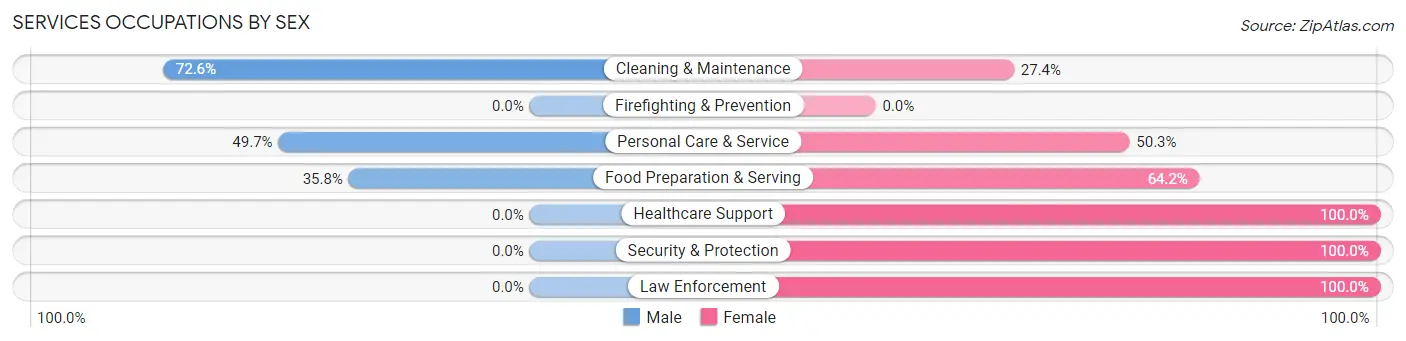
Services Occupations by Sex
Within the Services occupations in Eastwood, the most male-oriented occupations are Cleaning & Maintenance (72.6%), Personal Care & Service (49.7%), and Food Preparation & Serving (35.8%), while the most female-oriented occupations are Healthcare Support (100.0%), Security & Protection (100.0%), and Law Enforcement (100.0%).
| Occupation | Male | Female |
| Healthcare Support | 0 (0.0%) | 184 (100.0%) |
| Security & Protection | 0 (0.0%) | 44 (100.0%) |
| Firefighting & Prevention | 0 (0.0%) | 0 (0.0%) |
| Law Enforcement | 0 (0.0%) | 44 (100.0%) |
| Food Preparation & Serving | 72 (35.8%) | 129 (64.2%) |
| Cleaning & Maintenance | 114 (72.6%) | 43 (27.4%) |
| Personal Care & Service | 97 (49.7%) | 98 (50.3%) |
| Total (Category) | 283 (36.2%) | 498 (63.8%) |
| Total (Overall) | 1,444 (41.8%) | 2,009 (58.2%) |
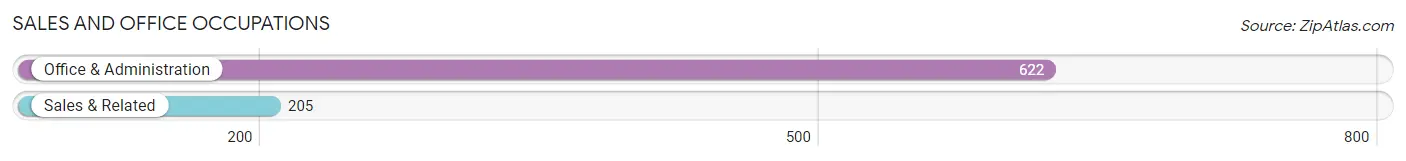
Sales and Office Occupations
The most common Sales and Office occupations in Eastwood are Office & Administration (622 | 18.0%), and Sales & Related (205 | 5.9%).
Sales and Office Occupations by Sex
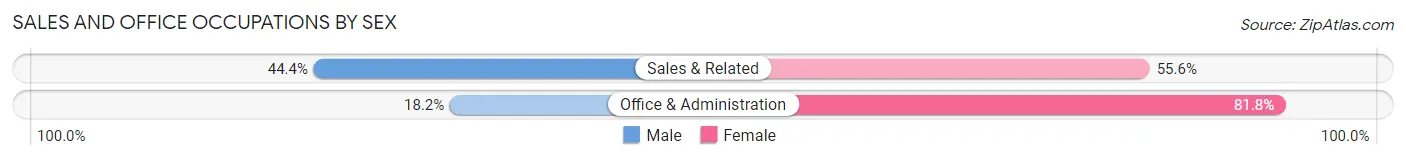
| Occupation | Male | Female |
| Sales & Related | 91 (44.4%) | 114 (55.6%) |
| Office & Administration | 113 (18.2%) | 509 (81.8%) |
| Total (Category) | 204 (24.7%) | 623 (75.3%) |
| Total (Overall) | 1,444 (41.8%) | 2,009 (58.2%) |
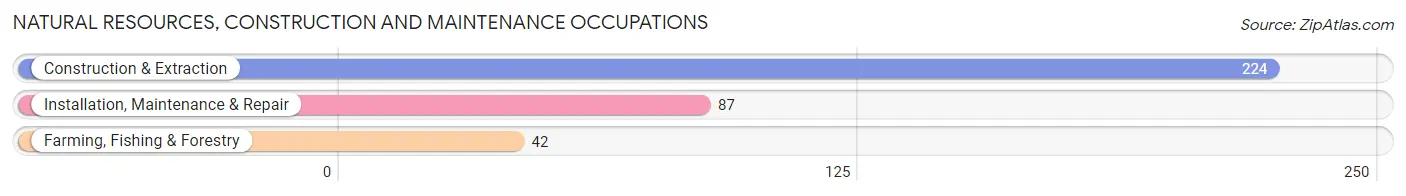
Natural Resources, Construction and Maintenance Occupations
The most common Natural Resources, Construction and Maintenance occupations in Eastwood are Construction & Extraction (224 | 6.5%), Installation, Maintenance & Repair (87 | 2.5%), and Farming, Fishing & Forestry (42 | 1.2%).
Natural Resources, Construction and Maintenance Occupations by Sex
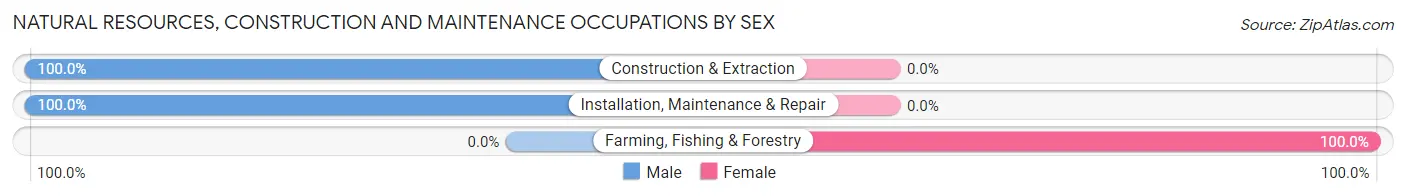
| Occupation | Male | Female |
| Farming, Fishing & Forestry | 0 (0.0%) | 42 (100.0%) |
| Construction & Extraction | 224 (100.0%) | 0 (0.0%) |
| Installation, Maintenance & Repair | 87 (100.0%) | 0 (0.0%) |
| Total (Category) | 311 (88.1%) | 42 (11.9%) |
| Total (Overall) | 1,444 (41.8%) | 2,009 (58.2%) |
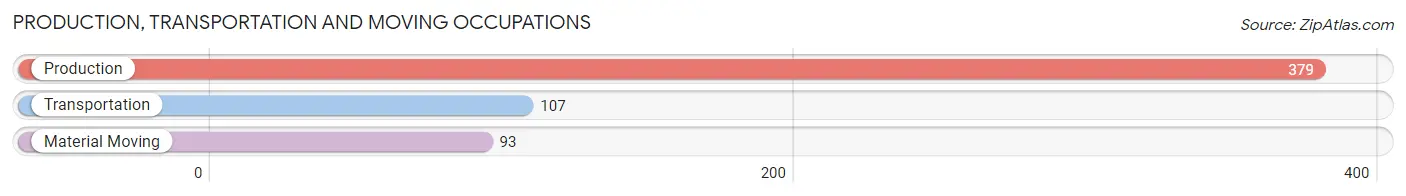
Production, Transportation and Moving Occupations
The most common Production, Transportation and Moving occupations in Eastwood are Production (379 | 11.0%), Transportation (107 | 3.1%), and Material Moving (93 | 2.7%).
Production, Transportation and Moving Occupations by Sex
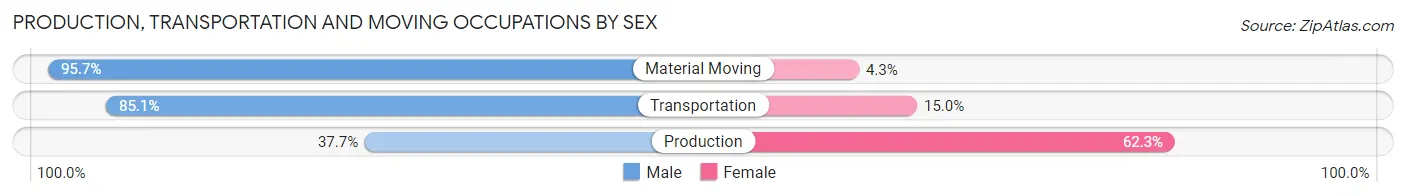
| Occupation | Male | Female |
| Production | 143 (37.7%) | 236 (62.3%) |
| Transportation | 91 (85.1%) | 16 (14.9%) |
| Material Moving | 89 (95.7%) | 4 (4.3%) |
| Total (Category) | 323 (55.8%) | 256 (44.2%) |
| Total (Overall) | 1,444 (41.8%) | 2,009 (58.2%) |
Employment Industries by Sex in Eastwood
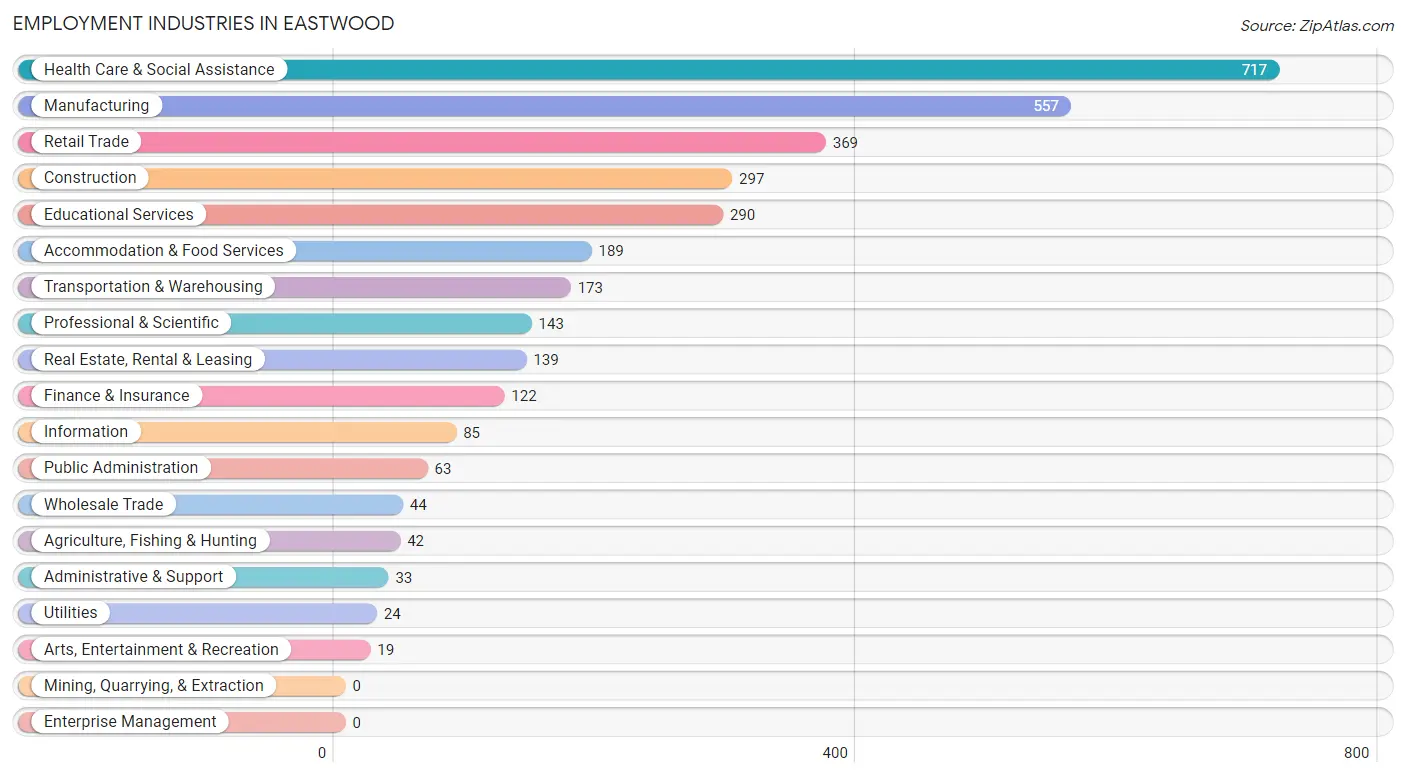
Employment Industries in Eastwood
The major employment industries in Eastwood include Health Care & Social Assistance (717 | 20.8%), Manufacturing (557 | 16.1%), Retail Trade (369 | 10.7%), Construction (297 | 8.6%), and Educational Services (290 | 8.4%).
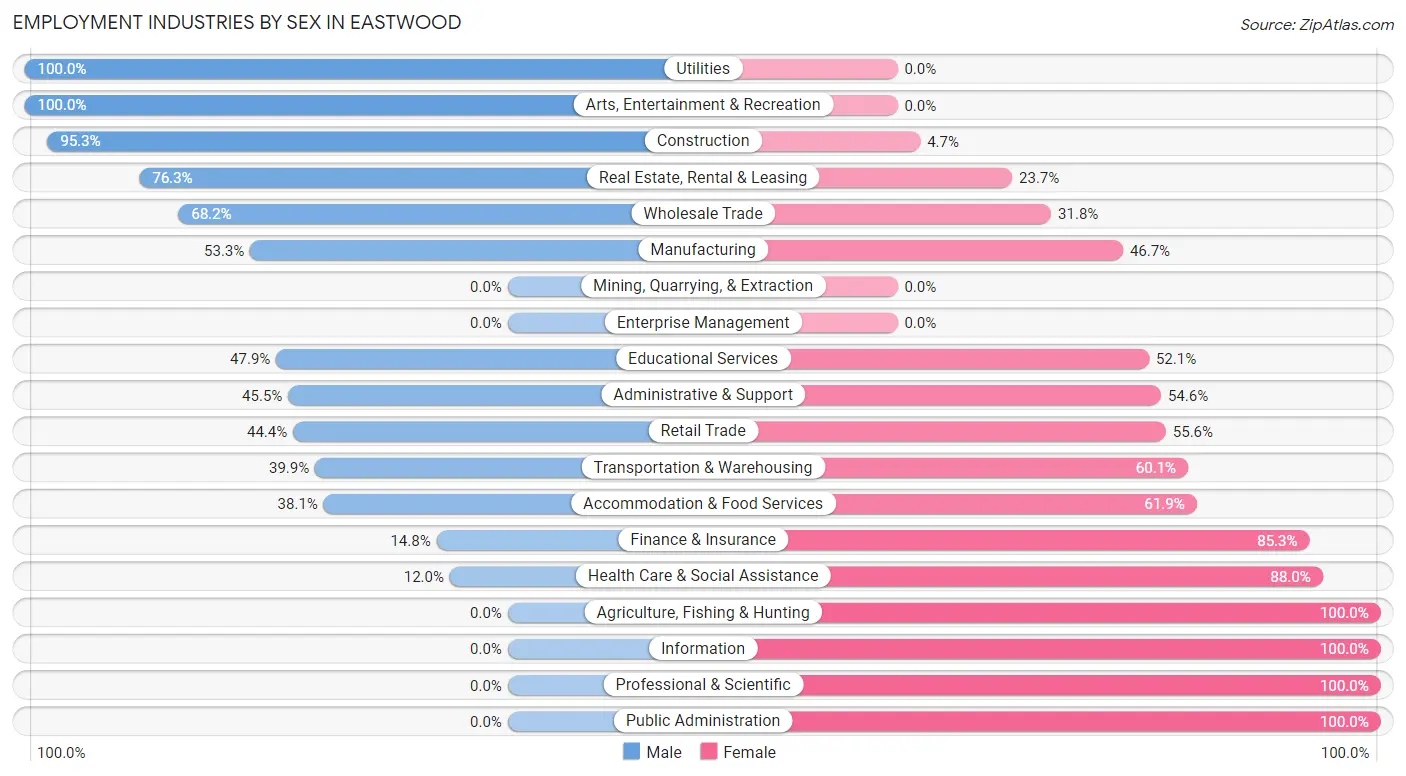
Employment Industries by Sex in Eastwood
The Eastwood industries that see more men than women are Utilities (100.0%), Arts, Entertainment & Recreation (100.0%), and Construction (95.3%), whereas the industries that tend to have a higher number of women are Agriculture, Fishing & Hunting (100.0%), Information (100.0%), and Professional & Scientific (100.0%).
| Industry | Male | Female |
| Agriculture, Fishing & Hunting | 0 (0.0%) | 42 (100.0%) |
| Mining, Quarrying, & Extraction | 0 (0.0%) | 0 (0.0%) |
| Construction | 283 (95.3%) | 14 (4.7%) |
| Manufacturing | 297 (53.3%) | 260 (46.7%) |
| Wholesale Trade | 30 (68.2%) | 14 (31.8%) |
| Retail Trade | 164 (44.4%) | 205 (55.6%) |
| Transportation & Warehousing | 69 (39.9%) | 104 (60.1%) |
| Utilities | 24 (100.0%) | 0 (0.0%) |
| Information | 0 (0.0%) | 85 (100.0%) |
| Finance & Insurance | 18 (14.7%) | 104 (85.3%) |
| Real Estate, Rental & Leasing | 106 (76.3%) | 33 (23.7%) |
| Professional & Scientific | 0 (0.0%) | 143 (100.0%) |
| Enterprise Management | 0 (0.0%) | 0 (0.0%) |
| Administrative & Support | 15 (45.5%) | 18 (54.5%) |
| Educational Services | 139 (47.9%) | 151 (52.1%) |
| Health Care & Social Assistance | 86 (12.0%) | 631 (88.0%) |
| Arts, Entertainment & Recreation | 19 (100.0%) | 0 (0.0%) |
| Accommodation & Food Services | 72 (38.1%) | 117 (61.9%) |
| Public Administration | 0 (0.0%) | 63 (100.0%) |
| Total | 1,444 (41.8%) | 2,009 (58.2%) |
Education in Eastwood
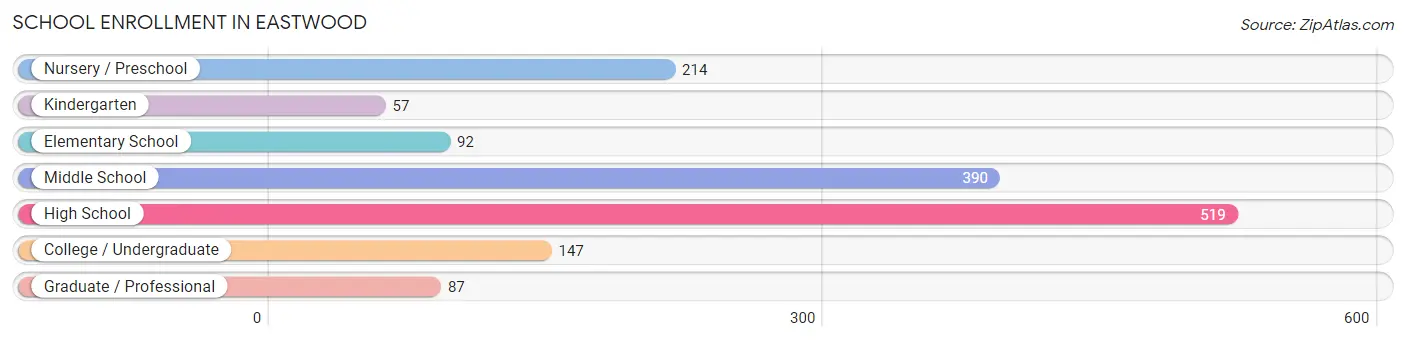
School Enrollment in Eastwood
The most common levels of schooling among the 1,506 students in Eastwood are high school (519 | 34.5%), middle school (390 | 25.9%), and nursery / preschool (214 | 14.2%).
| School Level | # Students | % Students |
| Nursery / Preschool | 214 | 14.2% |
| Kindergarten | 57 | 3.8% |
| Elementary School | 92 | 6.1% |
| Middle School | 390 | 25.9% |
| High School | 519 | 34.5% |
| College / Undergraduate | 147 | 9.8% |
| Graduate / Professional | 87 | 5.8% |
| Total | 1,506 | 100.0% |
School Enrollment by Age by Funding Source in Eastwood
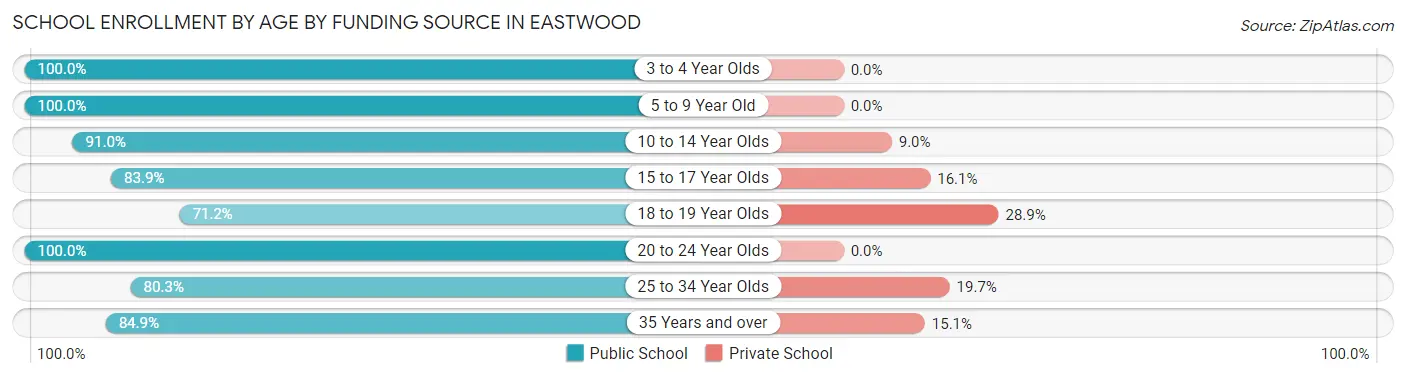
Out of a total of 1,506 students who are enrolled in schools in Eastwood, 166 (11.0%) attend a private institution, while the remaining 1,340 (89.0%) are enrolled in public schools. The age group of 18 to 19 year olds has the highest likelihood of being enrolled in private schools, with 45 (28.8% in the age bracket) enrolled. Conversely, the age group of 3 to 4 year olds has the lowest likelihood of being enrolled in a private school, with 88 (100.0% in the age bracket) attending a public institution.
| Age Bracket | Public School | Private School |
| 3 to 4 Year Olds | 88 (100.0%) | 0 (0.0%) |
| 5 to 9 Year Old | 270 (100.0%) | 0 (0.0%) |
| 10 to 14 Year Olds | 437 (91.0%) | 43 (9.0%) |
| 15 to 17 Year Olds | 260 (83.9%) | 50 (16.1%) |
| 18 to 19 Year Olds | 111 (71.2%) | 45 (28.8%) |
| 20 to 24 Year Olds | 40 (100.0%) | 0 (0.0%) |
| 25 to 34 Year Olds | 61 (80.3%) | 15 (19.7%) |
| 35 Years and over | 73 (84.9%) | 13 (15.1%) |
| Total | 1,340 (89.0%) | 166 (11.0%) |
Educational Attainment by Field of Study in Eastwood
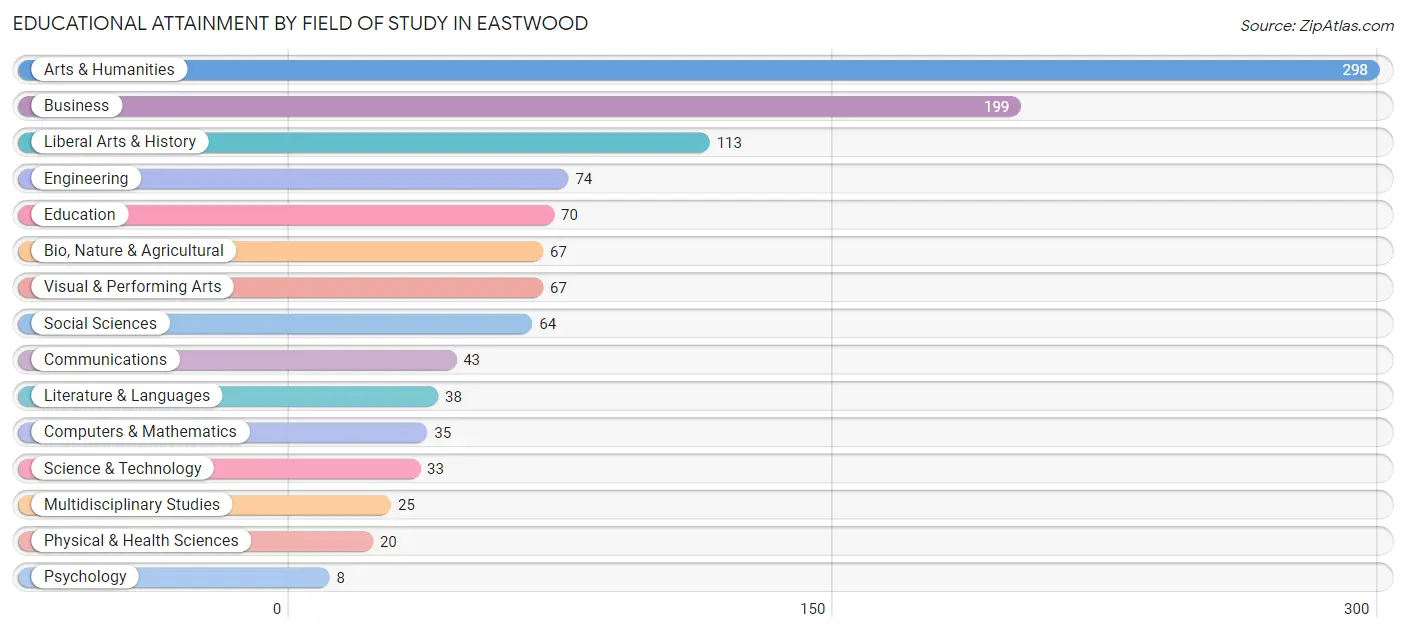
Arts & humanities (298 | 25.8%), business (199 | 17.2%), liberal arts & history (113 | 9.8%), engineering (74 | 6.4%), and education (70 | 6.1%) are the most common fields of study among 1,154 individuals in Eastwood who have obtained a bachelor's degree or higher.
| Field of Study | # Graduates | % Graduates |
| Computers & Mathematics | 35 | 3.0% |
| Bio, Nature & Agricultural | 67 | 5.8% |
| Physical & Health Sciences | 20 | 1.7% |
| Psychology | 8 | 0.7% |
| Social Sciences | 64 | 5.6% |
| Engineering | 74 | 6.4% |
| Multidisciplinary Studies | 25 | 2.2% |
| Science & Technology | 33 | 2.9% |
| Business | 199 | 17.2% |
| Education | 70 | 6.1% |
| Literature & Languages | 38 | 3.3% |
| Liberal Arts & History | 113 | 9.8% |
| Visual & Performing Arts | 67 | 5.8% |
| Communications | 43 | 3.7% |
| Arts & Humanities | 298 | 25.8% |
| Total | 1,154 | 100.0% |
Transportation & Commute in Eastwood
Vehicle Availability by Sex in Eastwood
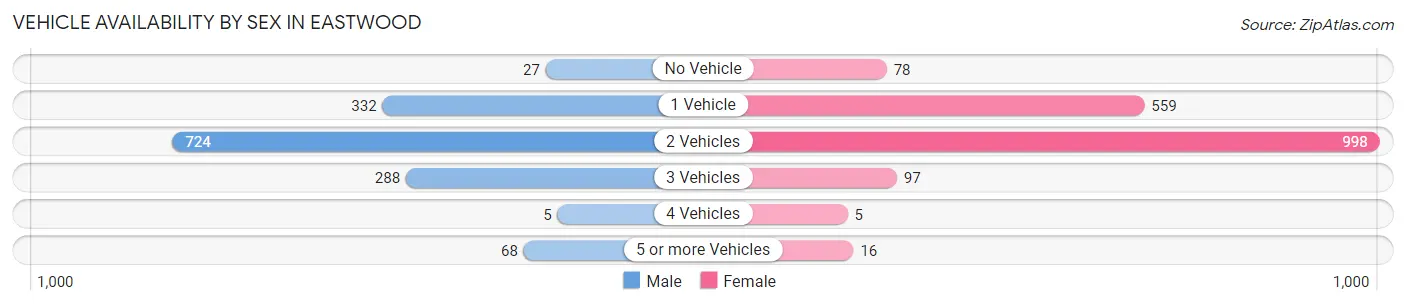
The most prevalent vehicle ownership categories in Eastwood are males with 2 vehicles (724, accounting for 50.1%) and females with 2 vehicles (998, making up 41.3%).
| Vehicles Available | Male | Female |
| No Vehicle | 27 (1.9%) | 78 (4.4%) |
| 1 Vehicle | 332 (23.0%) | 559 (31.9%) |
| 2 Vehicles | 724 (50.1%) | 998 (56.9%) |
| 3 Vehicles | 288 (19.9%) | 97 (5.5%) |
| 4 Vehicles | 5 (0.4%) | 5 (0.3%) |
| 5 or more Vehicles | 68 (4.7%) | 16 (0.9%) |
| Total | 1,444 (100.0%) | 1,753 (100.0%) |
Commute Time in Eastwood
The most frequently occuring commute durations in Eastwood are 15 to 19 minutes (925 commuters, 30.8%), 20 to 24 minutes (456 commuters, 15.2%), and 10 to 14 minutes (414 commuters, 13.8%).
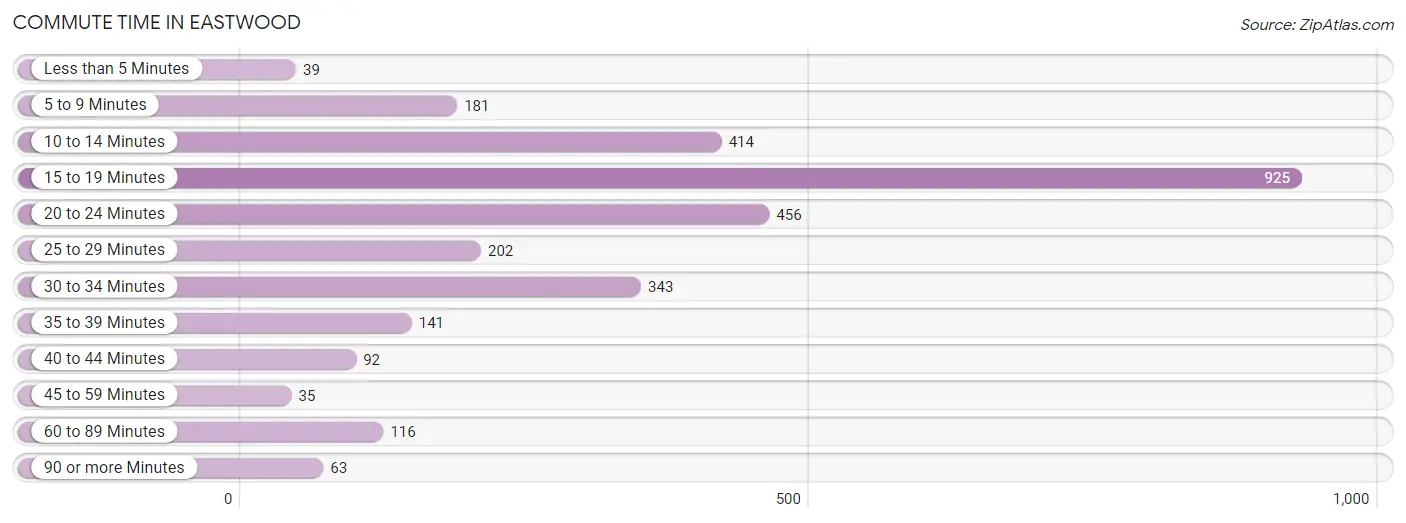
| Commute Time | # Commuters | % Commuters |
| Less than 5 Minutes | 39 | 1.3% |
| 5 to 9 Minutes | 181 | 6.0% |
| 10 to 14 Minutes | 414 | 13.8% |
| 15 to 19 Minutes | 925 | 30.8% |
| 20 to 24 Minutes | 456 | 15.2% |
| 25 to 29 Minutes | 202 | 6.7% |
| 30 to 34 Minutes | 343 | 11.4% |
| 35 to 39 Minutes | 141 | 4.7% |
| 40 to 44 Minutes | 92 | 3.1% |
| 45 to 59 Minutes | 35 | 1.2% |
| 60 to 89 Minutes | 116 | 3.9% |
| 90 or more Minutes | 63 | 2.1% |
Commute Time by Sex in Eastwood
The most common commute times in Eastwood are 15 to 19 minutes (435 commuters, 31.4%) for males and 15 to 19 minutes (490 commuters, 30.2%) for females.
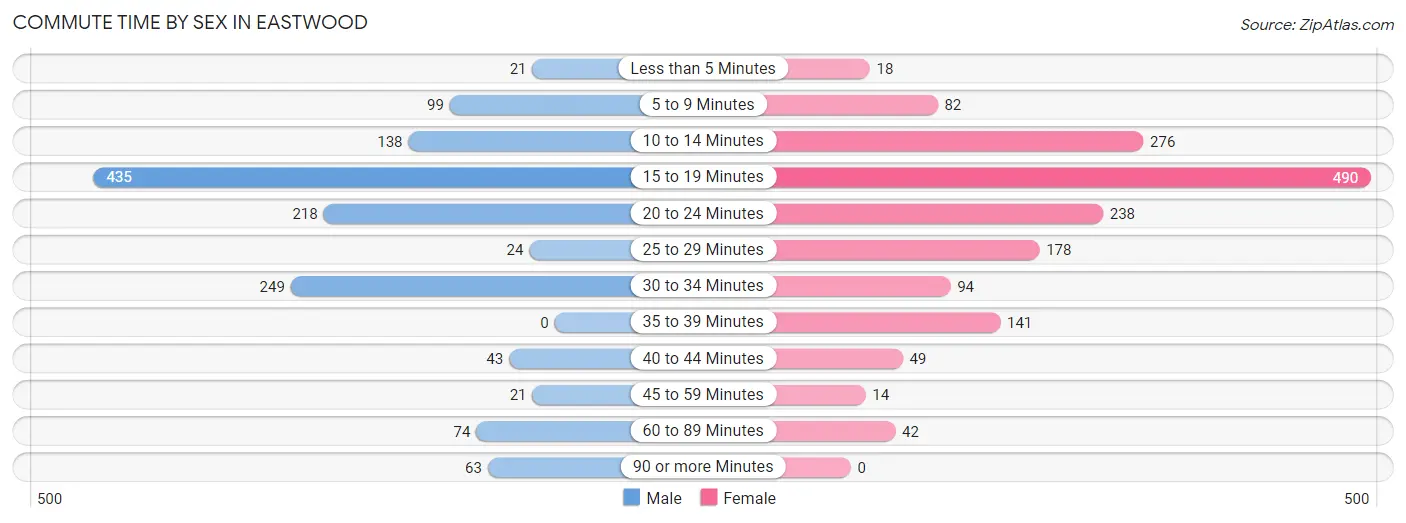
| Commute Time | Male | Female |
| Less than 5 Minutes | 21 (1.5%) | 18 (1.1%) |
| 5 to 9 Minutes | 99 (7.1%) | 82 (5.1%) |
| 10 to 14 Minutes | 138 (10.0%) | 276 (17.0%) |
| 15 to 19 Minutes | 435 (31.4%) | 490 (30.2%) |
| 20 to 24 Minutes | 218 (15.7%) | 238 (14.7%) |
| 25 to 29 Minutes | 24 (1.7%) | 178 (11.0%) |
| 30 to 34 Minutes | 249 (18.0%) | 94 (5.8%) |
| 35 to 39 Minutes | 0 (0.0%) | 141 (8.7%) |
| 40 to 44 Minutes | 43 (3.1%) | 49 (3.0%) |
| 45 to 59 Minutes | 21 (1.5%) | 14 (0.9%) |
| 60 to 89 Minutes | 74 (5.3%) | 42 (2.6%) |
| 90 or more Minutes | 63 (4.5%) | 0 (0.0%) |
Time of Departure to Work by Sex in Eastwood
The most frequent times of departure to work in Eastwood are 6:30 AM to 6:59 AM (289, 20.9%) for males and 7:00 AM to 7:29 AM (274, 16.9%) for females.
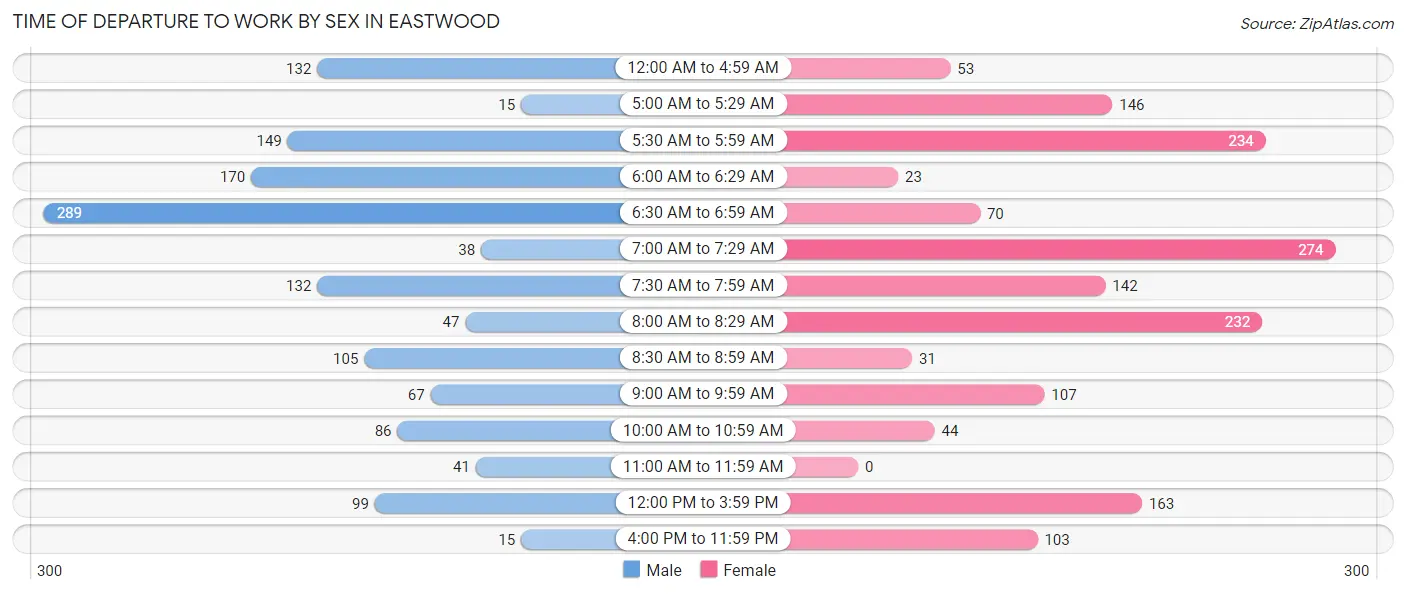
| Time of Departure | Male | Female |
| 12:00 AM to 4:59 AM | 132 (9.5%) | 53 (3.3%) |
| 5:00 AM to 5:29 AM | 15 (1.1%) | 146 (9.0%) |
| 5:30 AM to 5:59 AM | 149 (10.8%) | 234 (14.4%) |
| 6:00 AM to 6:29 AM | 170 (12.3%) | 23 (1.4%) |
| 6:30 AM to 6:59 AM | 289 (20.9%) | 70 (4.3%) |
| 7:00 AM to 7:29 AM | 38 (2.7%) | 274 (16.9%) |
| 7:30 AM to 7:59 AM | 132 (9.5%) | 142 (8.7%) |
| 8:00 AM to 8:29 AM | 47 (3.4%) | 232 (14.3%) |
| 8:30 AM to 8:59 AM | 105 (7.6%) | 31 (1.9%) |
| 9:00 AM to 9:59 AM | 67 (4.8%) | 107 (6.6%) |
| 10:00 AM to 10:59 AM | 86 (6.2%) | 44 (2.7%) |
| 11:00 AM to 11:59 AM | 41 (3.0%) | 0 (0.0%) |
| 12:00 PM to 3:59 PM | 99 (7.1%) | 163 (10.1%) |
| 4:00 PM to 11:59 PM | 15 (1.1%) | 103 (6.4%) |
| Total | 1,385 (100.0%) | 1,622 (100.0%) |
Housing Occupancy in Eastwood
Occupancy by Ownership in Eastwood
Of the total 2,734 dwellings in Eastwood, owner-occupied units account for 1,525 (55.8%), while renter-occupied units make up 1,209 (44.2%).
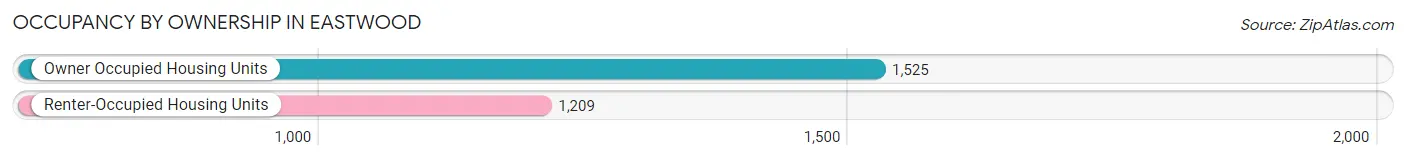
| Occupancy | # Housing Units | % Housing Units |
| Owner Occupied Housing Units | 1,525 | 55.8% |
| Renter-Occupied Housing Units | 1,209 | 44.2% |
| Total Occupied Housing Units | 2,734 | 100.0% |
Occupancy by Household Size in Eastwood
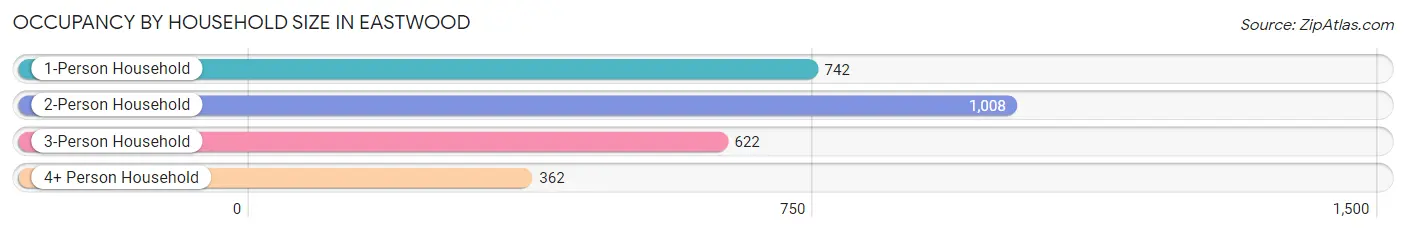
| Household Size | # Housing Units | % Housing Units |
| 1-Person Household | 742 | 27.1% |
| 2-Person Household | 1,008 | 36.9% |
| 3-Person Household | 622 | 22.8% |
| 4+ Person Household | 362 | 13.2% |
| Total Housing Units | 2,734 | 100.0% |
Occupancy by Ownership by Household Size in Eastwood
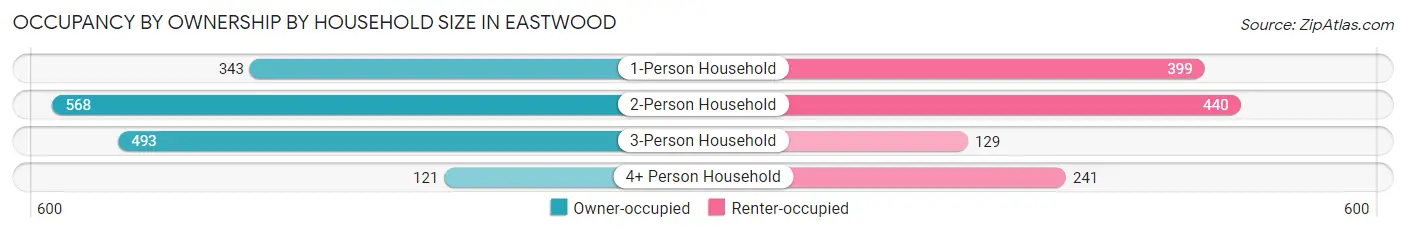
| Household Size | Owner-occupied | Renter-occupied |
| 1-Person Household | 343 (46.2%) | 399 (53.8%) |
| 2-Person Household | 568 (56.4%) | 440 (43.6%) |
| 3-Person Household | 493 (79.3%) | 129 (20.7%) |
| 4+ Person Household | 121 (33.4%) | 241 (66.6%) |
| Total Housing Units | 1,525 (55.8%) | 1,209 (44.2%) |
Occupancy by Educational Attainment in Eastwood
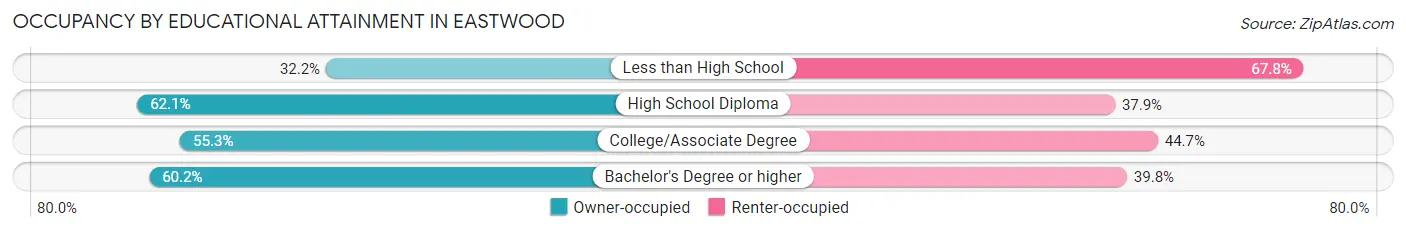
| Household Size | Owner-occupied | Renter-occupied |
| Less than High School | 85 (32.2%) | 179 (67.8%) |
| High School Diploma | 438 (62.1%) | 267 (37.9%) |
| College/Associate Degree | 690 (55.3%) | 557 (44.7%) |
| Bachelor's Degree or higher | 312 (60.2%) | 206 (39.8%) |
Occupancy by Age of Householder in Eastwood
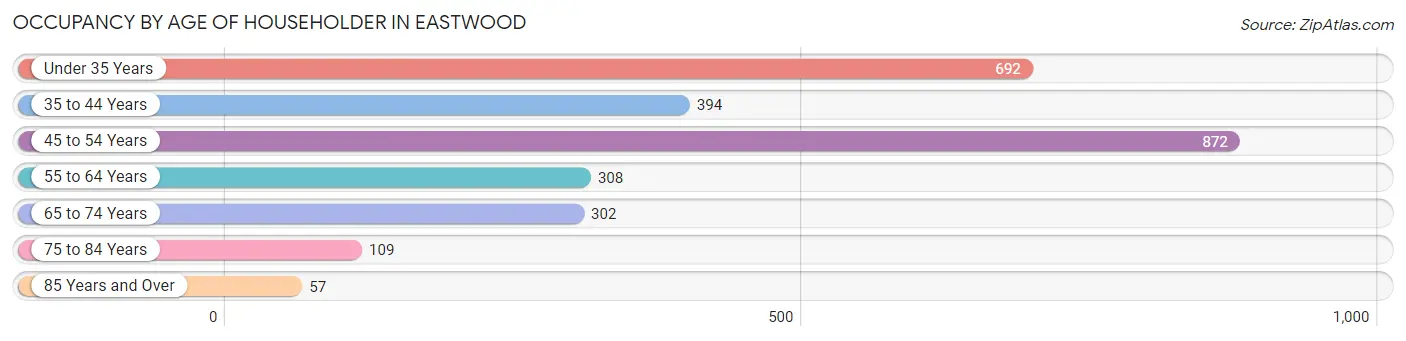
| Age Bracket | # Households | % Households |
| Under 35 Years | 692 | 25.3% |
| 35 to 44 Years | 394 | 14.4% |
| 45 to 54 Years | 872 | 31.9% |
| 55 to 64 Years | 308 | 11.3% |
| 65 to 74 Years | 302 | 11.1% |
| 75 to 84 Years | 109 | 4.0% |
| 85 Years and Over | 57 | 2.1% |
| Total | 2,734 | 100.0% |
Housing Finances in Eastwood
Median Income by Occupancy in Eastwood
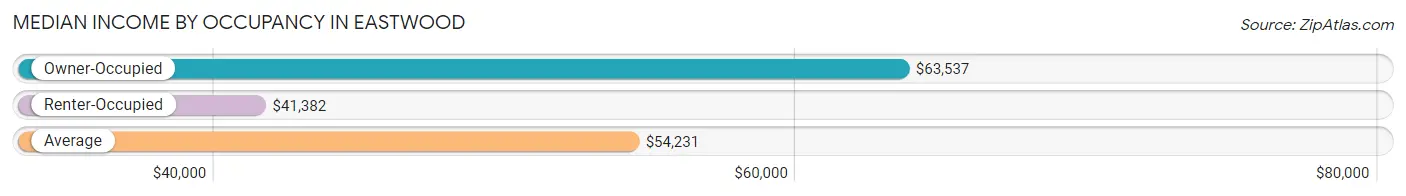
| Occupancy Type | # Households | Median Income |
| Owner-Occupied | 1,525 (55.8%) | $63,537 |
| Renter-Occupied | 1,209 (44.2%) | $41,382 |
| Average | 2,734 (100.0%) | $54,231 |
Occupancy by Householder Income Bracket in Eastwood
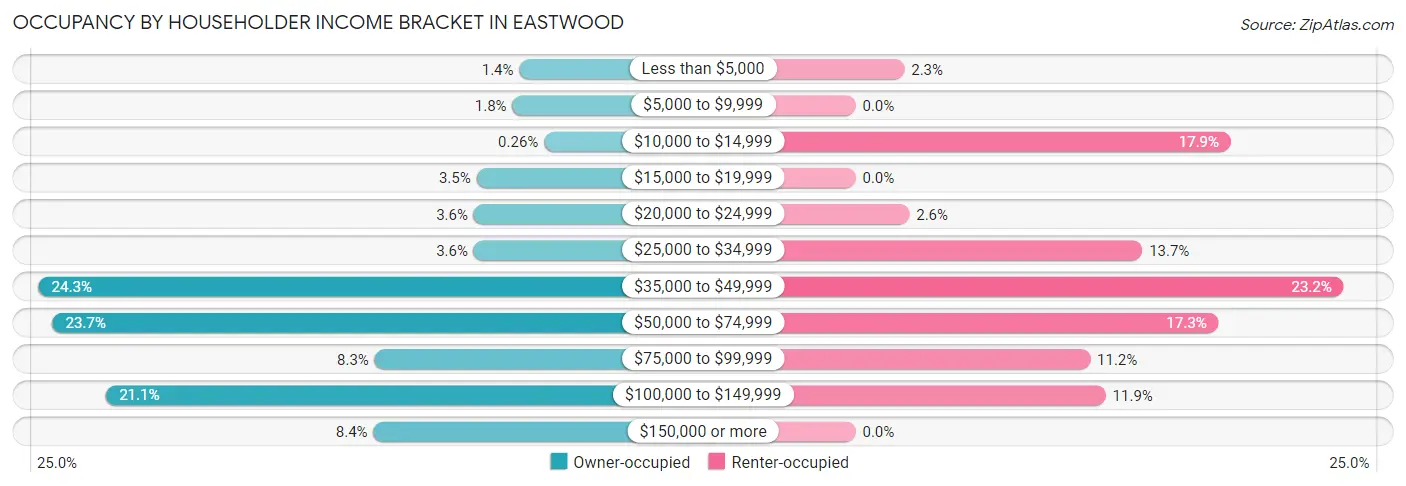
| Income Bracket | Owner-occupied | Renter-occupied |
| Less than $5,000 | 22 (1.4%) | 28 (2.3%) |
| $5,000 to $9,999 | 27 (1.8%) | 0 (0.0%) |
| $10,000 to $14,999 | 4 (0.3%) | 216 (17.9%) |
| $15,000 to $19,999 | 53 (3.5%) | 0 (0.0%) |
| $20,000 to $24,999 | 55 (3.6%) | 31 (2.6%) |
| $25,000 to $34,999 | 55 (3.6%) | 165 (13.7%) |
| $35,000 to $49,999 | 371 (24.3%) | 281 (23.2%) |
| $50,000 to $74,999 | 361 (23.7%) | 209 (17.3%) |
| $75,000 to $99,999 | 127 (8.3%) | 135 (11.2%) |
| $100,000 to $149,999 | 322 (21.1%) | 144 (11.9%) |
| $150,000 or more | 128 (8.4%) | 0 (0.0%) |
| Total | 1,525 (100.0%) | 1,209 (100.0%) |
Monthly Housing Cost Tiers in Eastwood
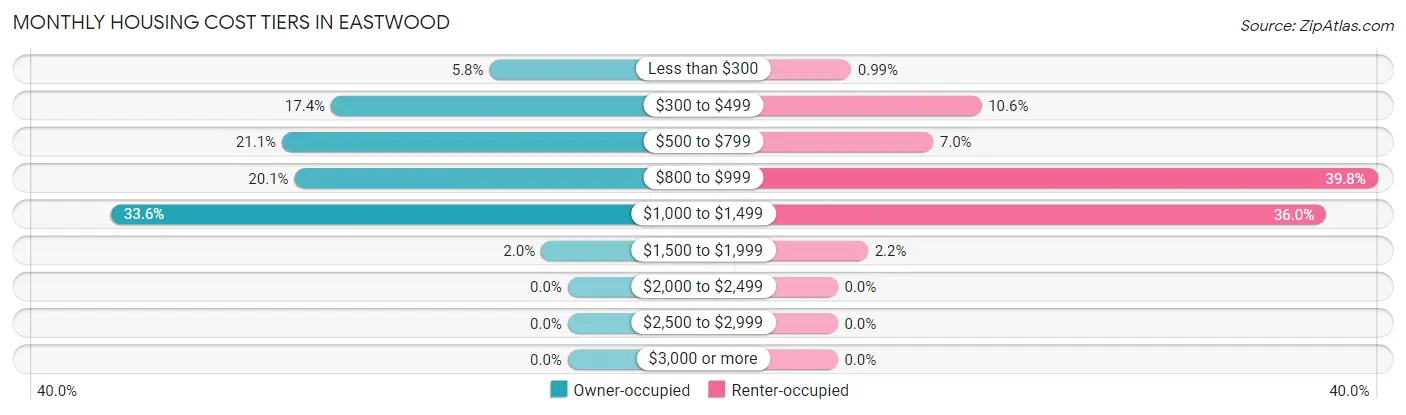
| Monthly Cost | Owner-occupied | Renter-occupied |
| Less than $300 | 88 (5.8%) | 12 (1.0%) |
| $300 to $499 | 266 (17.4%) | 128 (10.6%) |
| $500 to $799 | 321 (21.0%) | 85 (7.0%) |
| $800 to $999 | 307 (20.1%) | 481 (39.8%) |
| $1,000 to $1,499 | 513 (33.6%) | 435 (36.0%) |
| $1,500 to $1,999 | 30 (2.0%) | 27 (2.2%) |
| $2,000 to $2,499 | 0 (0.0%) | 0 (0.0%) |
| $2,500 to $2,999 | 0 (0.0%) | 0 (0.0%) |
| $3,000 or more | 0 (0.0%) | 0 (0.0%) |
| Total | 1,525 (100.0%) | 1,209 (100.0%) |
Physical Housing Characteristics in Eastwood
Housing Structures in Eastwood
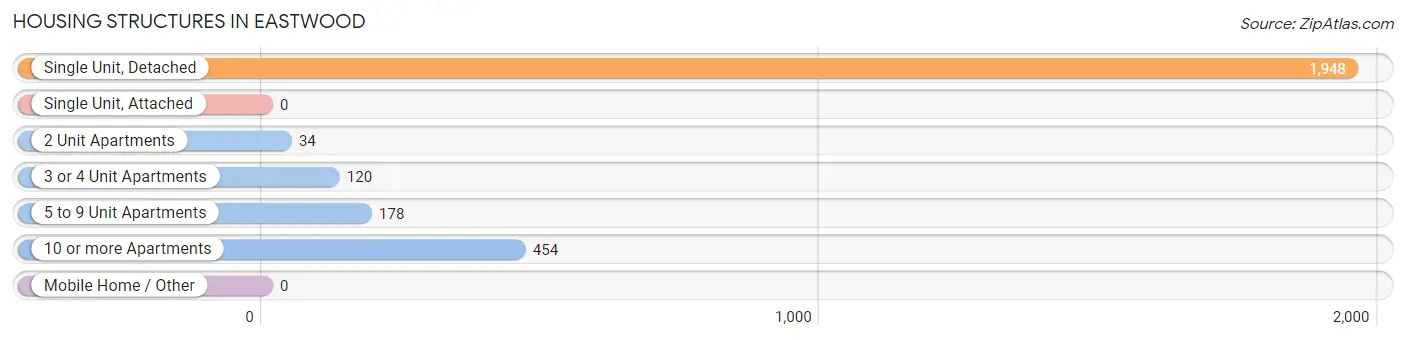
| Structure Type | # Housing Units | % Housing Units |
| Single Unit, Detached | 1,948 | 71.3% |
| Single Unit, Attached | 0 | 0.0% |
| 2 Unit Apartments | 34 | 1.2% |
| 3 or 4 Unit Apartments | 120 | 4.4% |
| 5 to 9 Unit Apartments | 178 | 6.5% |
| 10 or more Apartments | 454 | 16.6% |
| Mobile Home / Other | 0 | 0.0% |
| Total | 2,734 | 100.0% |
Housing Structures by Occupancy in Eastwood
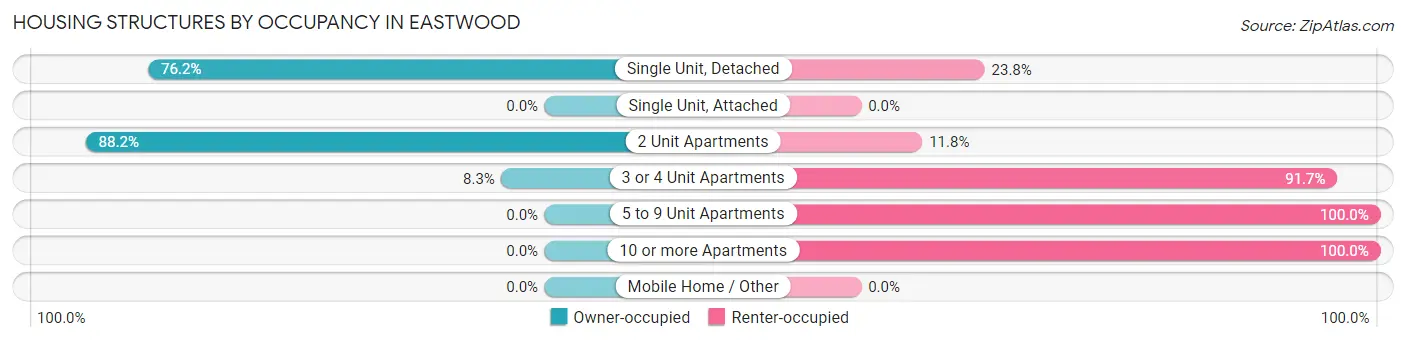
| Structure Type | Owner-occupied | Renter-occupied |
| Single Unit, Detached | 1,485 (76.2%) | 463 (23.8%) |
| Single Unit, Attached | 0 (0.0%) | 0 (0.0%) |
| 2 Unit Apartments | 30 (88.2%) | 4 (11.8%) |
| 3 or 4 Unit Apartments | 10 (8.3%) | 110 (91.7%) |
| 5 to 9 Unit Apartments | 0 (0.0%) | 178 (100.0%) |
| 10 or more Apartments | 0 (0.0%) | 454 (100.0%) |
| Mobile Home / Other | 0 (0.0%) | 0 (0.0%) |
| Total | 1,525 (55.8%) | 1,209 (44.2%) |
Housing Structures by Number of Rooms in Eastwood
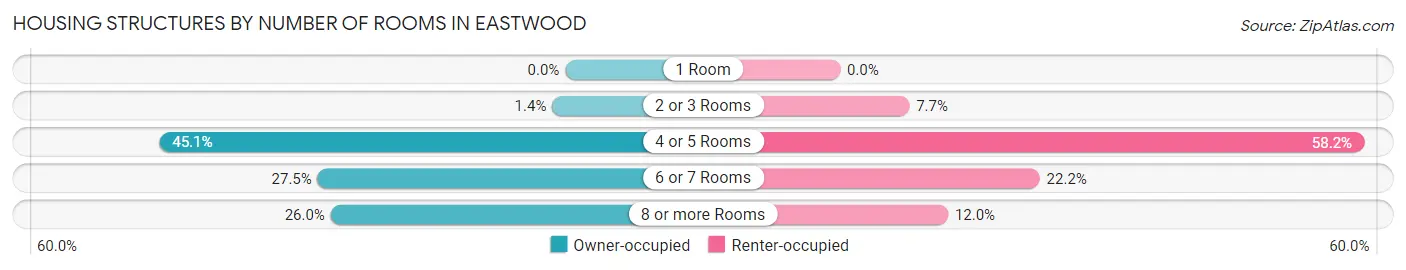
| Number of Rooms | Owner-occupied | Renter-occupied |
| 1 Room | 0 (0.0%) | 0 (0.0%) |
| 2 or 3 Rooms | 22 (1.4%) | 93 (7.7%) |
| 4 or 5 Rooms | 687 (45.1%) | 703 (58.2%) |
| 6 or 7 Rooms | 419 (27.5%) | 268 (22.2%) |
| 8 or more Rooms | 397 (26.0%) | 145 (12.0%) |
| Total | 1,525 (100.0%) | 1,209 (100.0%) |
Housing Structure by Heating Type in Eastwood
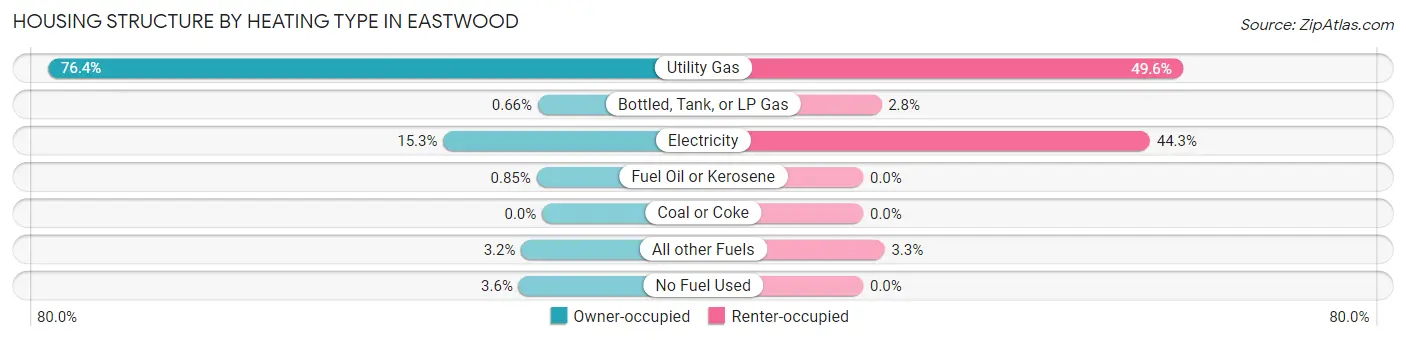
| Heating Type | Owner-occupied | Renter-occupied |
| Utility Gas | 1,165 (76.4%) | 599 (49.5%) |
| Bottled, Tank, or LP Gas | 10 (0.7%) | 34 (2.8%) |
| Electricity | 233 (15.3%) | 536 (44.3%) |
| Fuel Oil or Kerosene | 13 (0.9%) | 0 (0.0%) |
| Coal or Coke | 0 (0.0%) | 0 (0.0%) |
| All other Fuels | 49 (3.2%) | 40 (3.3%) |
| No Fuel Used | 55 (3.6%) | 0 (0.0%) |
| Total | 1,525 (100.0%) | 1,209 (100.0%) |
Household Vehicle Usage in Eastwood
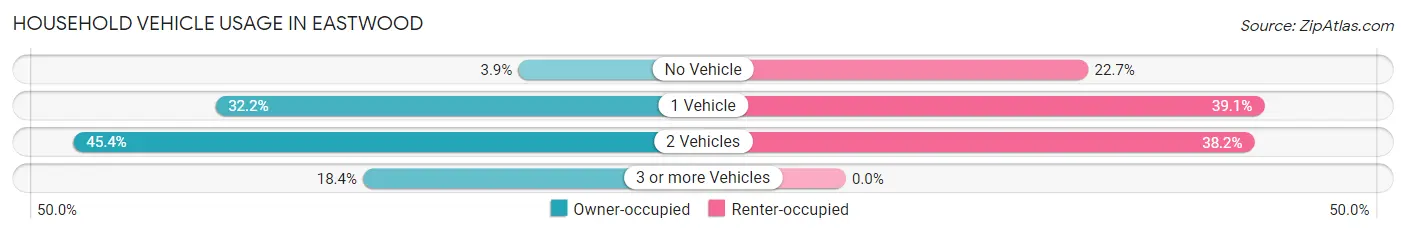
| Vehicles per Household | Owner-occupied | Renter-occupied |
| No Vehicle | 60 (3.9%) | 274 (22.7%) |
| 1 Vehicle | 491 (32.2%) | 473 (39.1%) |
| 2 Vehicles | 693 (45.4%) | 462 (38.2%) |
| 3 or more Vehicles | 281 (18.4%) | 0 (0.0%) |
| Total | 1,525 (100.0%) | 1,209 (100.0%) |
Real Estate & Mortgages in Eastwood
Real Estate and Mortgage Overview in Eastwood
| Characteristic | Without Mortgage | With Mortgage |
| Housing Units | 560 | 965 |
| Median Property Value | $99,700 | $125,500 |
| Median Household Income | $46,250 | $116 |
| Monthly Housing Costs | $439 | $0 |
| Real Estate Taxes | $1,900 | $25 |
Property Value by Mortgage Status in Eastwood
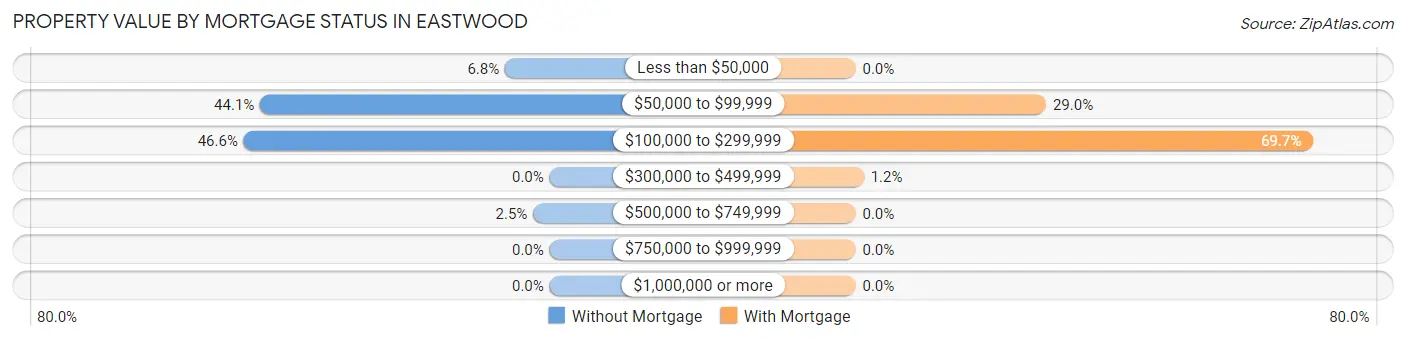
| Property Value | Without Mortgage | With Mortgage |
| Less than $50,000 | 38 (6.8%) | 0 (0.0%) |
| $50,000 to $99,999 | 247 (44.1%) | 280 (29.0%) |
| $100,000 to $299,999 | 261 (46.6%) | 673 (69.7%) |
| $300,000 to $499,999 | 0 (0.0%) | 12 (1.2%) |
| $500,000 to $749,999 | 14 (2.5%) | 0 (0.0%) |
| $750,000 to $999,999 | 0 (0.0%) | 0 (0.0%) |
| $1,000,000 or more | 0 (0.0%) | 0 (0.0%) |
| Total | 560 (100.0%) | 965 (100.0%) |
Household Income by Mortgage Status in Eastwood
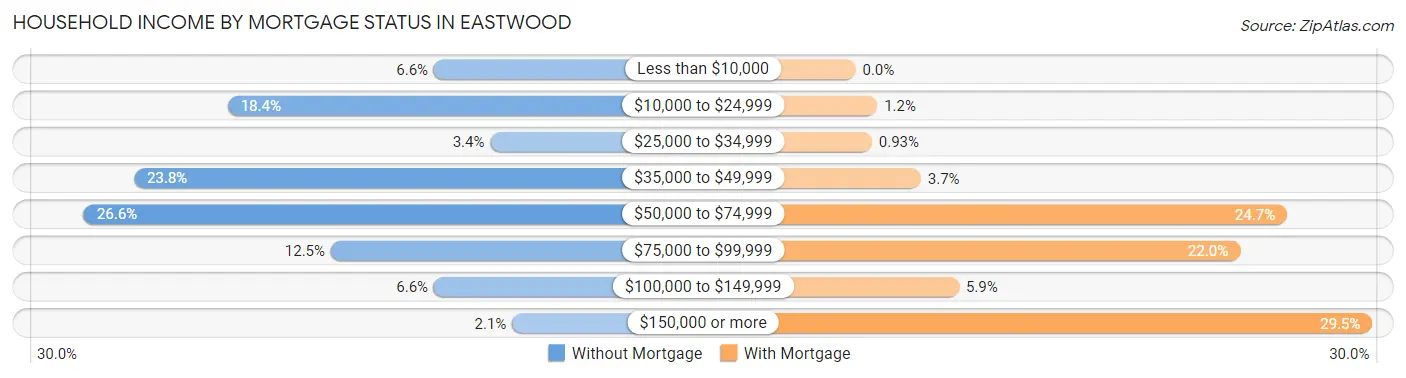
| Household Income | Without Mortgage | With Mortgage |
| Less than $10,000 | 37 (6.6%) | 0 (0.0%) |
| $10,000 to $24,999 | 103 (18.4%) | 12 (1.2%) |
| $25,000 to $34,999 | 19 (3.4%) | 9 (0.9%) |
| $35,000 to $49,999 | 133 (23.7%) | 36 (3.7%) |
| $50,000 to $74,999 | 149 (26.6%) | 238 (24.7%) |
| $75,000 to $99,999 | 70 (12.5%) | 212 (22.0%) |
| $100,000 to $149,999 | 37 (6.6%) | 57 (5.9%) |
| $150,000 or more | 12 (2.1%) | 285 (29.5%) |
| Total | 560 (100.0%) | 965 (100.0%) |
Property Value to Household Income Ratio in Eastwood
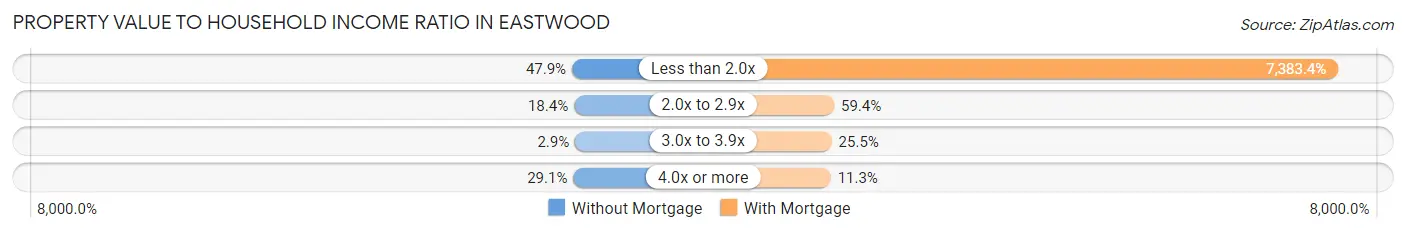
| Value-to-Income Ratio | Without Mortgage | With Mortgage |
| Less than 2.0x | 268 (47.9%) | 71,250 (7,383.4%) |
| 2.0x to 2.9x | 103 (18.4%) | 573 (59.4%) |
| 3.0x to 3.9x | 16 (2.9%) | 246 (25.5%) |
| 4.0x or more | 163 (29.1%) | 109 (11.3%) |
| Total | 560 (100.0%) | 965 (100.0%) |
Real Estate Taxes by Mortgage Status in Eastwood
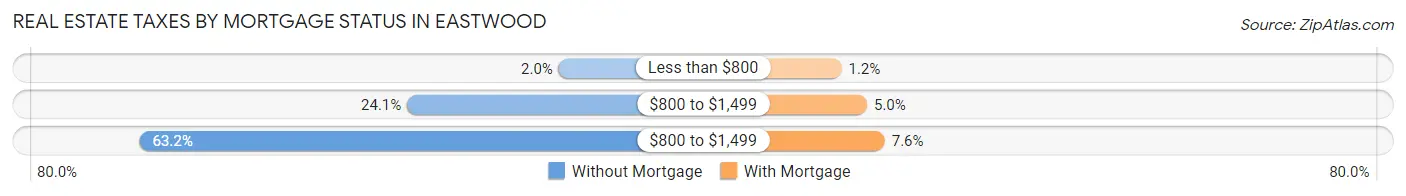
| Property Taxes | Without Mortgage | With Mortgage |
| Less than $800 | 11 (2.0%) | 12 (1.2%) |
| $800 to $1,499 | 135 (24.1%) | 48 (5.0%) |
| $800 to $1,499 | 354 (63.2%) | 73 (7.6%) |
| Total | 560 (100.0%) | 965 (100.0%) |
Health & Disability in Eastwood
Health Insurance Coverage by Age in Eastwood
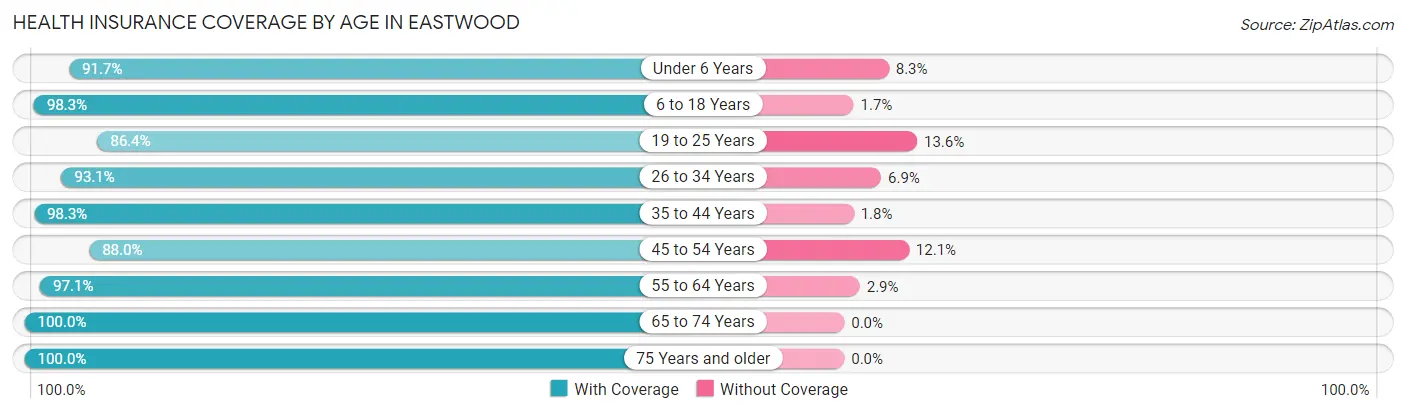
| Age Bracket | With Coverage | Without Coverage |
| Under 6 Years | 608 (91.7%) | 55 (8.3%) |
| 6 to 18 Years | 967 (98.3%) | 17 (1.7%) |
| 19 to 25 Years | 465 (86.4%) | 73 (13.6%) |
| 26 to 34 Years | 1,141 (93.1%) | 84 (6.9%) |
| 35 to 44 Years | 617 (98.3%) | 11 (1.8%) |
| 45 to 54 Years | 1,058 (87.9%) | 145 (12.0%) |
| 55 to 64 Years | 572 (97.1%) | 17 (2.9%) |
| 65 to 74 Years | 339 (100.0%) | 0 (0.0%) |
| 75 Years and older | 216 (100.0%) | 0 (0.0%) |
| Total | 5,983 (93.7%) | 402 (6.3%) |
Health Insurance Coverage by Citizenship Status in Eastwood
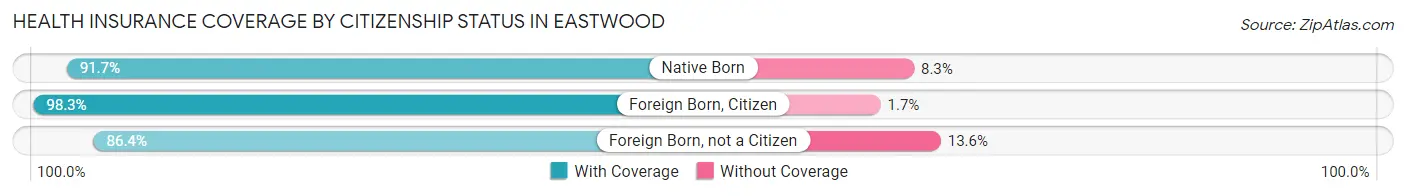
| Citizenship Status | With Coverage | Without Coverage |
| Native Born | 608 (91.7%) | 55 (8.3%) |
| Foreign Born, Citizen | 967 (98.3%) | 17 (1.7%) |
| Foreign Born, not a Citizen | 465 (86.4%) | 73 (13.6%) |
Health Insurance Coverage by Household Income in Eastwood
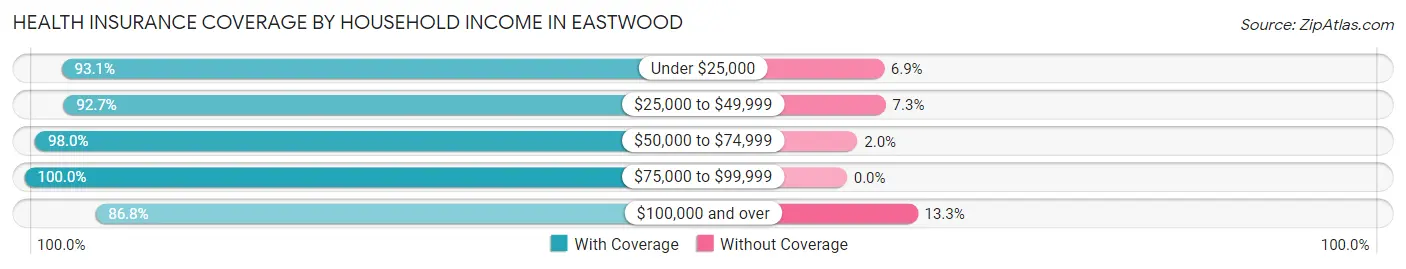
| Household Income | With Coverage | Without Coverage |
| Under $25,000 | 536 (93.1%) | 40 (6.9%) |
| $25,000 to $49,999 | 1,631 (92.7%) | 128 (7.3%) |
| $50,000 to $74,999 | 1,735 (98.0%) | 35 (2.0%) |
| $75,000 to $99,999 | 757 (100.0%) | 0 (0.0%) |
| $100,000 and over | 1,303 (86.8%) | 199 (13.3%) |
Public vs Private Health Insurance Coverage by Age in Eastwood
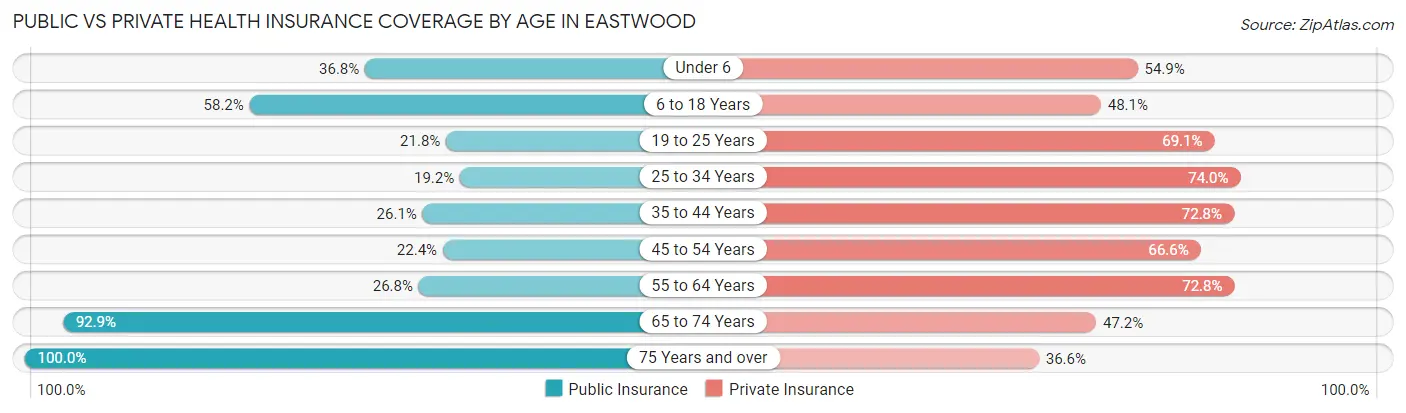
| Age Bracket | Public Insurance | Private Insurance |
| Under 6 | 244 (36.8%) | 364 (54.9%) |
| 6 to 18 Years | 573 (58.2%) | 473 (48.1%) |
| 19 to 25 Years | 117 (21.7%) | 372 (69.1%) |
| 25 to 34 Years | 235 (19.2%) | 906 (74.0%) |
| 35 to 44 Years | 164 (26.1%) | 457 (72.8%) |
| 45 to 54 Years | 269 (22.4%) | 801 (66.6%) |
| 55 to 64 Years | 158 (26.8%) | 429 (72.8%) |
| 65 to 74 Years | 315 (92.9%) | 160 (47.2%) |
| 75 Years and over | 216 (100.0%) | 79 (36.6%) |
| Total | 2,291 (35.9%) | 4,041 (63.3%) |
Disability Status by Sex by Age in Eastwood
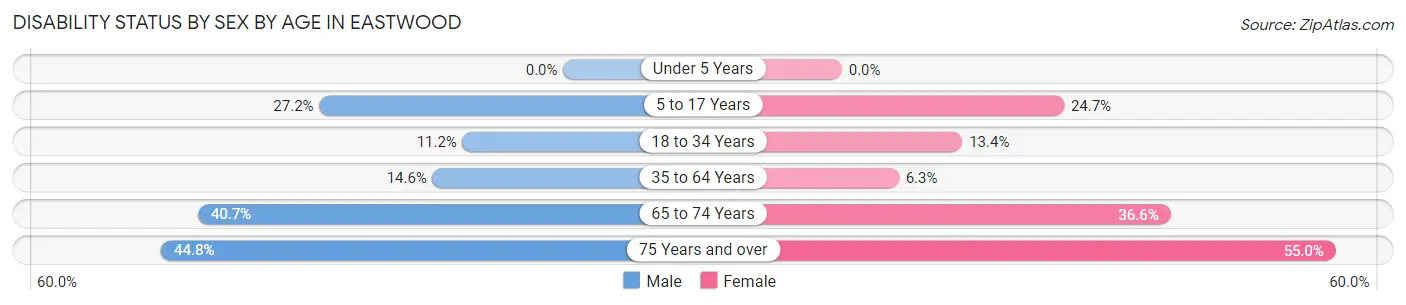
| Age Bracket | Male | Female |
| Under 5 Years | 0 (0.0%) | 0 (0.0%) |
| 5 to 17 Years | 200 (27.2%) | 95 (24.7%) |
| 18 to 34 Years | 96 (11.2%) | 136 (13.4%) |
| 35 to 64 Years | 150 (14.5%) | 88 (6.3%) |
| 65 to 74 Years | 59 (40.7%) | 71 (36.6%) |
| 75 Years and over | 43 (44.8%) | 66 (55.0%) |
Disability Class by Sex by Age in Eastwood
Disability Class: Hearing Difficulty
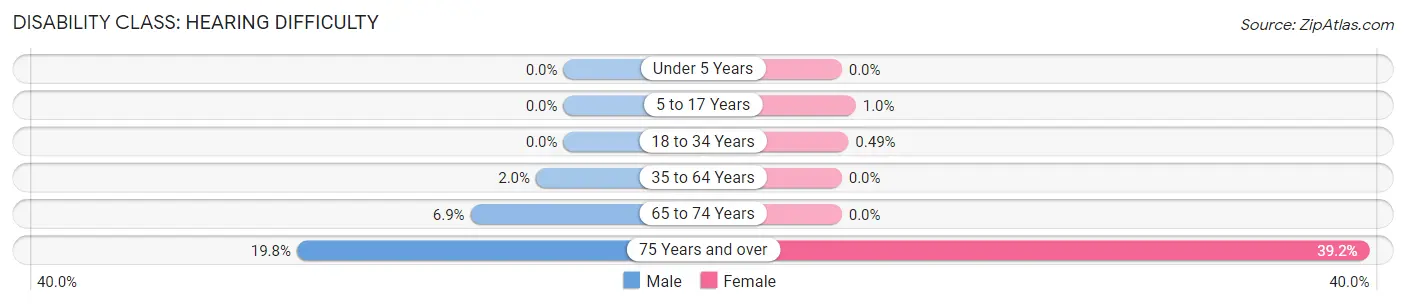
| Age Bracket | Male | Female |
| Under 5 Years | 0 (0.0%) | 0 (0.0%) |
| 5 to 17 Years | 0 (0.0%) | 4 (1.0%) |
| 18 to 34 Years | 0 (0.0%) | 5 (0.5%) |
| 35 to 64 Years | 21 (2.0%) | 0 (0.0%) |
| 65 to 74 Years | 10 (6.9%) | 0 (0.0%) |
| 75 Years and over | 19 (19.8%) | 47 (39.2%) |
Disability Class: Vision Difficulty
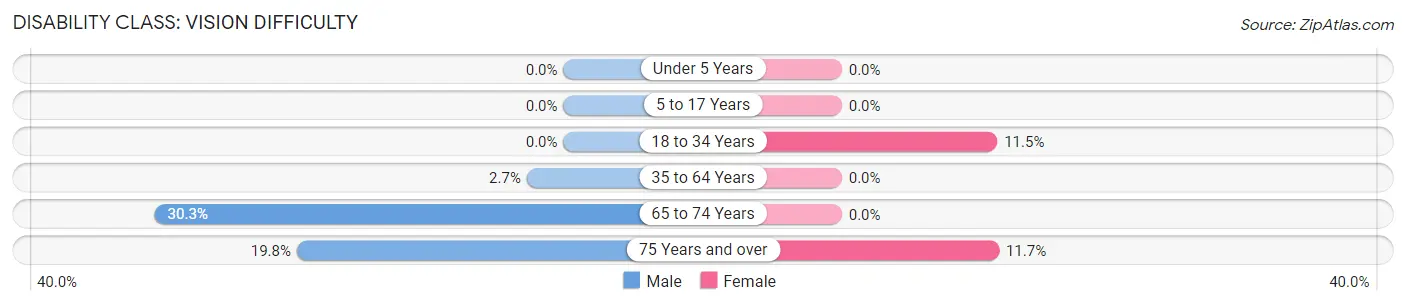
| Age Bracket | Male | Female |
| Under 5 Years | 0 (0.0%) | 0 (0.0%) |
| 5 to 17 Years | 0 (0.0%) | 0 (0.0%) |
| 18 to 34 Years | 0 (0.0%) | 117 (11.5%) |
| 35 to 64 Years | 28 (2.7%) | 0 (0.0%) |
| 65 to 74 Years | 44 (30.3%) | 0 (0.0%) |
| 75 Years and over | 19 (19.8%) | 14 (11.7%) |
Disability Class: Cognitive Difficulty
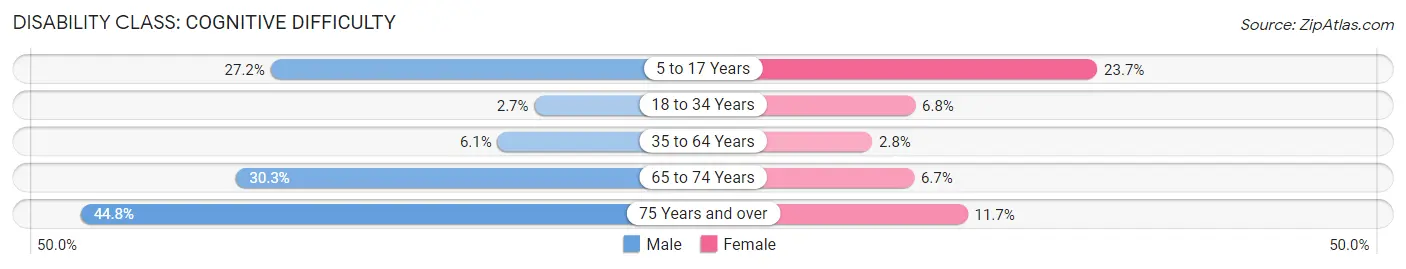
| Age Bracket | Male | Female |
| 5 to 17 Years | 200 (27.2%) | 91 (23.7%) |
| 18 to 34 Years | 23 (2.7%) | 69 (6.8%) |
| 35 to 64 Years | 63 (6.1%) | 39 (2.8%) |
| 65 to 74 Years | 44 (30.3%) | 13 (6.7%) |
| 75 Years and over | 43 (44.8%) | 14 (11.7%) |
Disability Class: Ambulatory Difficulty
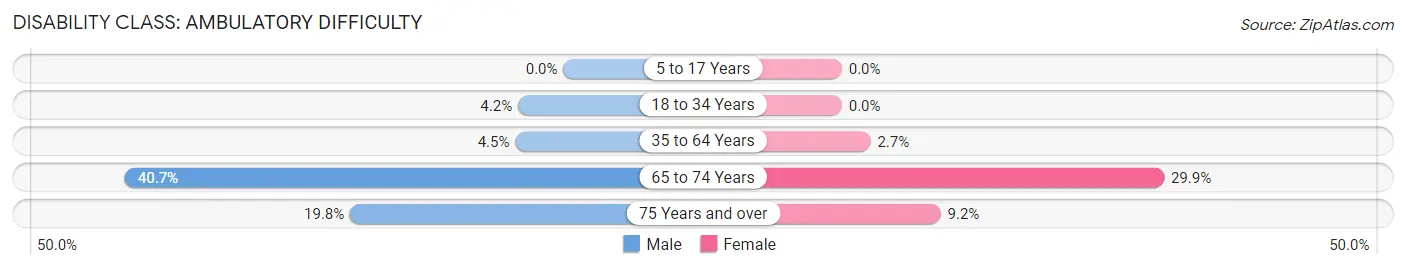
| Age Bracket | Male | Female |
| 5 to 17 Years | 0 (0.0%) | 0 (0.0%) |
| 18 to 34 Years | 36 (4.2%) | 0 (0.0%) |
| 35 to 64 Years | 46 (4.5%) | 37 (2.7%) |
| 65 to 74 Years | 59 (40.7%) | 58 (29.9%) |
| 75 Years and over | 19 (19.8%) | 11 (9.2%) |
Disability Class: Self-Care Difficulty
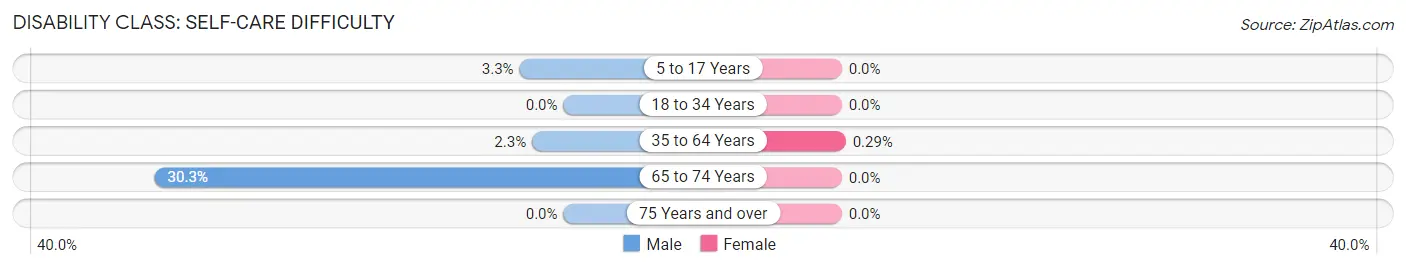
| Age Bracket | Male | Female |
| 5 to 17 Years | 24 (3.3%) | 0 (0.0%) |
| 18 to 34 Years | 0 (0.0%) | 0 (0.0%) |
| 35 to 64 Years | 24 (2.3%) | 4 (0.3%) |
| 65 to 74 Years | 44 (30.3%) | 0 (0.0%) |
| 75 Years and over | 0 (0.0%) | 0 (0.0%) |
Technology Access in Eastwood
Computing Device Access in Eastwood
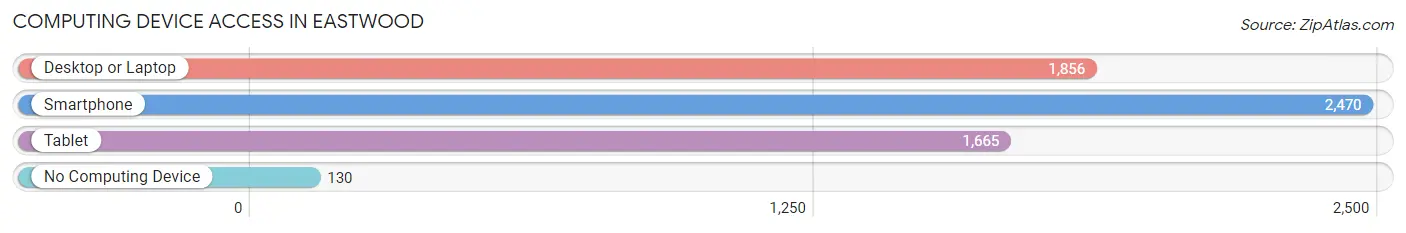
| Device Type | # Households | % Households |
| Desktop or Laptop | 1,856 | 67.9% |
| Smartphone | 2,470 | 90.3% |
| Tablet | 1,665 | 60.9% |
| No Computing Device | 130 | 4.8% |
| Total | 2,734 | 100.0% |
Internet Access in Eastwood
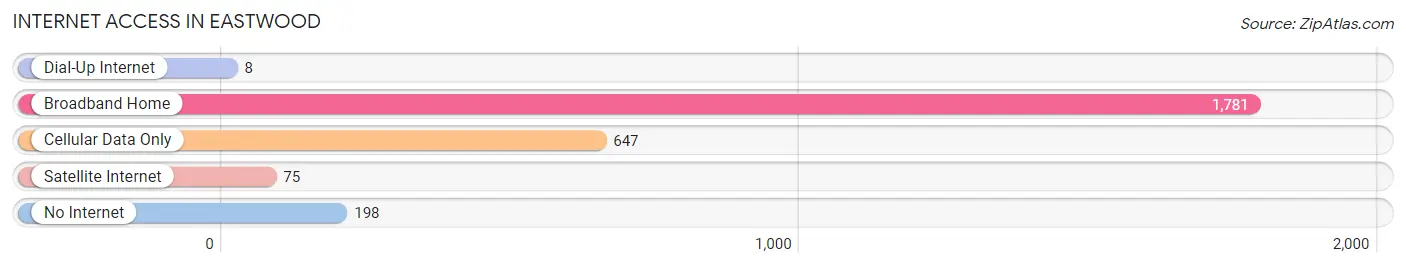
| Internet Type | # Households | % Households |
| Dial-Up Internet | 8 | 0.3% |
| Broadband Home | 1,781 | 65.1% |
| Cellular Data Only | 647 | 23.7% |
| Satellite Internet | 75 | 2.7% |
| No Internet | 198 | 7.2% |
| Total | 2,734 | 100.0% |
Eastwood Summary
Eastwood, Michigan is a small village located in the northern part of the state, in the county of Grand Traverse. It is situated on the shores of Lake Michigan, and is home to a population of just over 1,000 people. The village is known for its picturesque views of the lake, and its quaint, small-town atmosphere.
History
Eastwood was first settled in 1855 by a group of settlers from New York. The village was originally known as Eastwood Station, and was a stop on the Grand Rapids and Indiana Railroad. The village was officially incorporated in 1891, and was named after the Eastwood family, who were among the first settlers.
Geography
Eastwood is located in the northern part of Michigan, in Grand Traverse County. It is situated on the shores of Lake Michigan, and is bordered by the towns of Traverse City, Kingsley, and Fife Lake. The village is located in a rural area, and is surrounded by forests and rolling hills. The village is located at an elevation of 645 feet above sea level.
Economy
The economy of Eastwood is largely based on tourism and agriculture. The village is home to several small businesses, including restaurants, shops, and a marina. The village also has a small industrial park, which is home to several manufacturing companies. The village is also home to a number of wineries, which produce a variety of wines.
Demographics
As of the 2010 census, the population of Eastwood was 1,072. The racial makeup of the village was 97.2% White, 0.7% African American, 0.3% Native American, 0.2% Asian, 0.1% Pacific Islander, 0.3% from other races, and 1.3% from two or more races. The median household income in Eastwood was $41,250, and the median family income was $50,000.
Conclusion
Eastwood, Michigan is a small village located in the northern part of the state, in the county of Grand Traverse. It is situated on the shores of Lake Michigan, and is home to a population of just over 1,000 people. The village is known for its picturesque views of the lake, and its quaint, small-town atmosphere. The economy of Eastwood is largely based on tourism and agriculture, and the village is home to several small businesses, including restaurants, shops, and a marina. The racial makeup of the village is predominantly White, with a small percentage of African American, Native American, Asian, and Pacific Islander residents. The median household income in Eastwood is $41,250, and the median family income is $50,000.
Common Questions
What is the Total Population of Eastwood?
Total Population of Eastwood is 6,497.
What is the Total Male Population of Eastwood?
Total Male Population of Eastwood is 3,108.
What is the Total Female Population of Eastwood?
Total Female Population of Eastwood is 3,389.
What is the Ratio of Males per 100 Females in Eastwood?
There are 91.71 Males per 100 Females in Eastwood.
What is the Ratio of Females per 100 Males in Eastwood?
There are 109.04 Females per 100 Males in Eastwood.
What is the Median Population Age in Eastwood?
Median Population Age in Eastwood is 33.5 Years.
What is the Average Family Size in Eastwood
Average Family Size in Eastwood is 2.8 People.
What is the Average Household Size in Eastwood
Average Household Size in Eastwood is 2.3 People.
What is Per Capita Income in Eastwood?
Per Capita income in Eastwood is $26,606.
What is the Median Family Income in Eastwood?
Median Family Income in Eastwood is $61,658.
What is the Median Household income in Eastwood?
Median Household Income in Eastwood is $54,231.
What is Income or Wage Gap in Eastwood?
Income or Wage Gap in Eastwood is 3.8%.
Women in Eastwood earn 96.2 cents for every dollar earned by a man.
What is Family Income Deficit in Eastwood?
Family Income Deficit in Eastwood is $7,613.
Families that are below poverty line in Eastwood earn $7,613 less on average than the poverty threshold level.
What is Inequality or Gini Index in Eastwood?
Inequality or Gini Index in Eastwood is 0.37.
How Large is the Labor Force in Eastwood?
There are 3,752 People in the Labor Forcein in Eastwood.
What is the Percentage of People in the Labor Force in Eastwood?
74.0% of People are in the Labor Force in Eastwood.
What is the Unemployment Rate in Eastwood?
Unemployment Rate in Eastwood is 8.0%.