Westwood, MI
Westwood Map
Westwood Overview
9,022
TOTAL POPULATION
4,420
MALE POPULATION
4,602
FEMALE POPULATION
96.05
MALES / 100 FEMALES
104.12
FEMALES / 100 MALES
34.8
MEDIAN AGE
2.8
AVG FAMILY SIZE
2.0
AVG HOUSEHOLD SIZE
$43,640
PER CAPITA INCOME
$82,257
AVG FAMILY INCOME
$61,348
AVG HOUSEHOLD INCOME
33.4%
WAGE / INCOME GAP [ % ]
66.6¢/ $1
WAGE / INCOME GAP [ $ ]
0.51
INEQUALITY / GINI INDEX
5,186
LABOR FORCE [ PEOPLE ]
66.8%
PERCENT IN LABOR FORCE
3.7%
UNEMPLOYMENT RATE
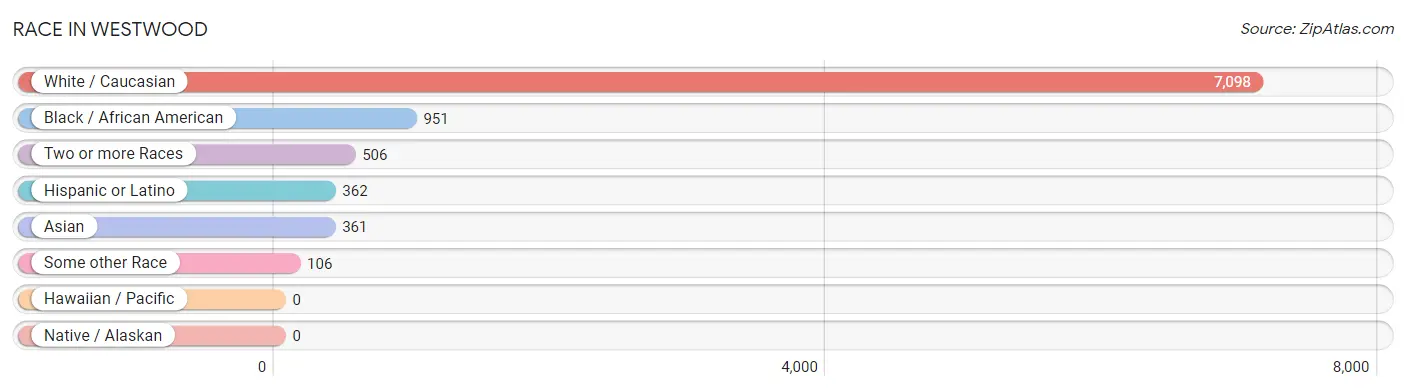
Race in Westwood
The most populous races in Westwood are White / Caucasian (7,098 | 78.7%), Black / African American (951 | 10.5%), and Two or more Races (506 | 5.6%).
| Race | # Population | % Population |
| Asian | 361 | 4.0% |
| Black / African American | 951 | 10.5% |
| Hawaiian / Pacific | 0 | 0.0% |
| Hispanic or Latino | 362 | 4.0% |
| Native / Alaskan | 0 | 0.0% |
| White / Caucasian | 7,098 | 78.7% |
| Two or more Races | 506 | 5.6% |
| Some other Race | 106 | 1.2% |
| Total | 9,022 | 100.0% |
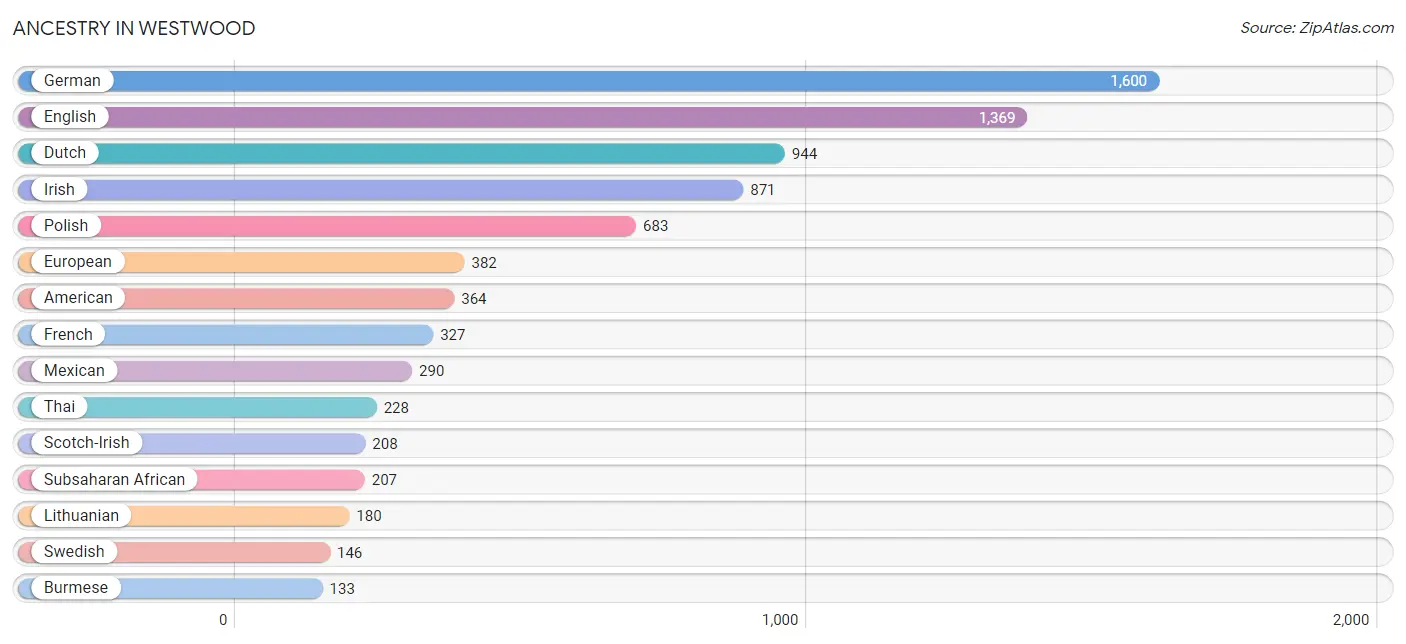
Ancestry in Westwood
The most populous ancestries reported in Westwood are German (1,600 | 17.7%), English (1,369 | 15.2%), Dutch (944 | 10.5%), Irish (871 | 9.7%), and Polish (683 | 7.6%), together accounting for 60.6% of all Westwood residents.
| Ancestry | # Population | % Population |
| African | 20 | 0.2% |
| American | 364 | 4.0% |
| Arab | 28 | 0.3% |
| Belgian | 41 | 0.4% |
| Blackfeet | 48 | 0.5% |
| British | 33 | 0.4% |
| Burmese | 133 | 1.5% |
| Canadian | 30 | 0.3% |
| Cherokee | 51 | 0.6% |
| Chippewa | 12 | 0.1% |
| Croatian | 103 | 1.1% |
| Czech | 14 | 0.2% |
| Danish | 42 | 0.5% |
| Dutch | 944 | 10.5% |
| Eastern European | 58 | 0.6% |
| English | 1,369 | 15.2% |
| European | 382 | 4.2% |
| Finnish | 43 | 0.5% |
| French | 327 | 3.6% |
| French Canadian | 128 | 1.4% |
| German | 1,600 | 17.7% |
| Hungarian | 3 | 0.0% |
| Icelander | 16 | 0.2% |
| Indian (Asian) | 108 | 1.2% |
| Iranian | 86 | 0.9% |
| Irish | 871 | 9.7% |
| Iroquois | 51 | 0.6% |
| Italian | 123 | 1.4% |
| Korean | 48 | 0.5% |
| Latvian | 10 | 0.1% |
| Lebanese | 19 | 0.2% |
| Lithuanian | 180 | 2.0% |
| Mexican | 290 | 3.2% |
| Nigerian | 78 | 0.9% |
| Norwegian | 133 | 1.5% |
| Polish | 683 | 7.6% |
| Portuguese | 15 | 0.2% |
| Russian | 17 | 0.2% |
| Samoan | 27 | 0.3% |
| Scandinavian | 10 | 0.1% |
| Scotch-Irish | 208 | 2.3% |
| Scottish | 113 | 1.3% |
| Spaniard | 72 | 0.8% |
| Sri Lankan | 31 | 0.3% |
| Subsaharan African | 207 | 2.3% |
| Swedish | 146 | 1.6% |
| Thai | 228 | 2.5% |
| Ukrainian | 32 | 0.4% |
| Welsh | 31 | 0.3% | View All 49 Rows |
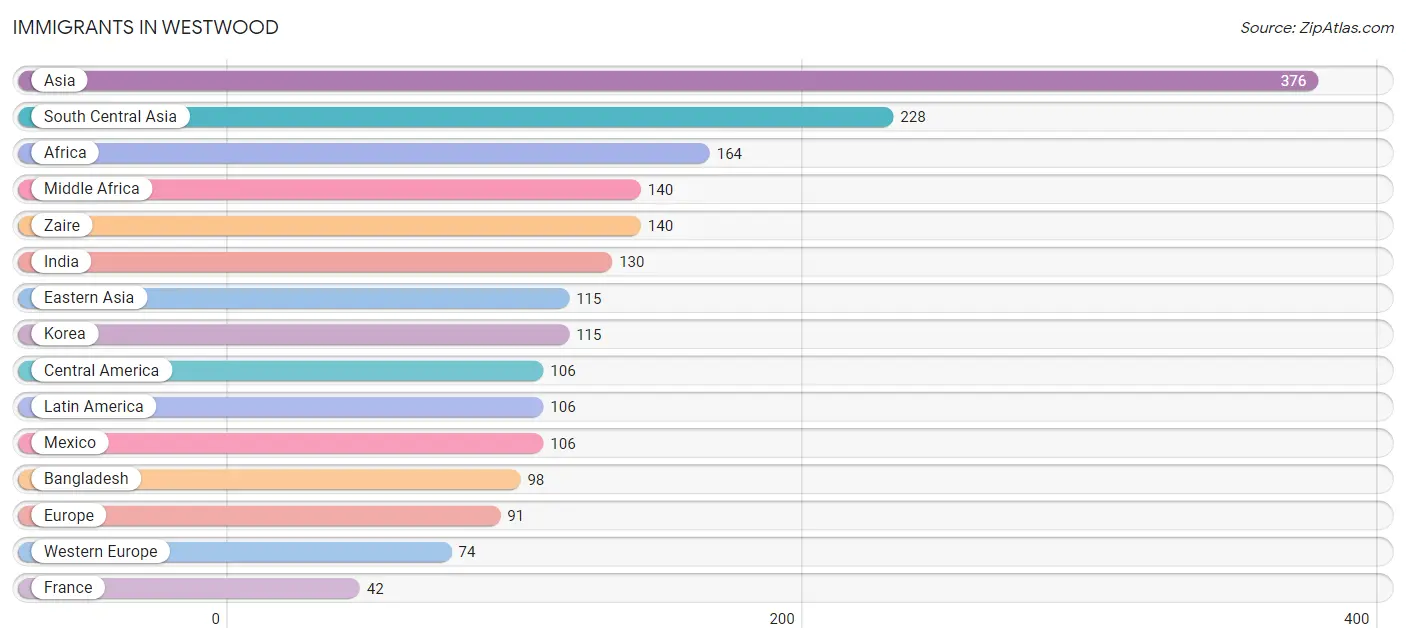
Immigrants in Westwood
The most numerous immigrant groups reported in Westwood came from Asia (376 | 4.2%), South Central Asia (228 | 2.5%), Africa (164 | 1.8%), Middle Africa (140 | 1.5%), and Zaire (140 | 1.5%), together accounting for 11.6% of all Westwood residents.
| Immigration Origin | # Population | % Population |
| Africa | 164 | 1.8% |
| Asia | 376 | 4.2% |
| Bangladesh | 98 | 1.1% |
| Canada | 21 | 0.2% |
| Central America | 106 | 1.2% |
| Eastern Asia | 115 | 1.3% |
| Eastern Europe | 17 | 0.2% |
| Europe | 91 | 1.0% |
| France | 42 | 0.5% |
| Germany | 32 | 0.4% |
| India | 130 | 1.4% |
| Korea | 115 | 1.3% |
| Latin America | 106 | 1.2% |
| Lebanon | 19 | 0.2% |
| Mexico | 106 | 1.2% |
| Middle Africa | 140 | 1.5% |
| Russia | 17 | 0.2% |
| Saudi Arabia | 14 | 0.2% |
| South Central Asia | 228 | 2.5% |
| Western Africa | 24 | 0.3% |
| Western Asia | 33 | 0.4% |
| Western Europe | 74 | 0.8% |
| Zaire | 140 | 1.5% | View All 23 Rows |
Sex and Age in Westwood
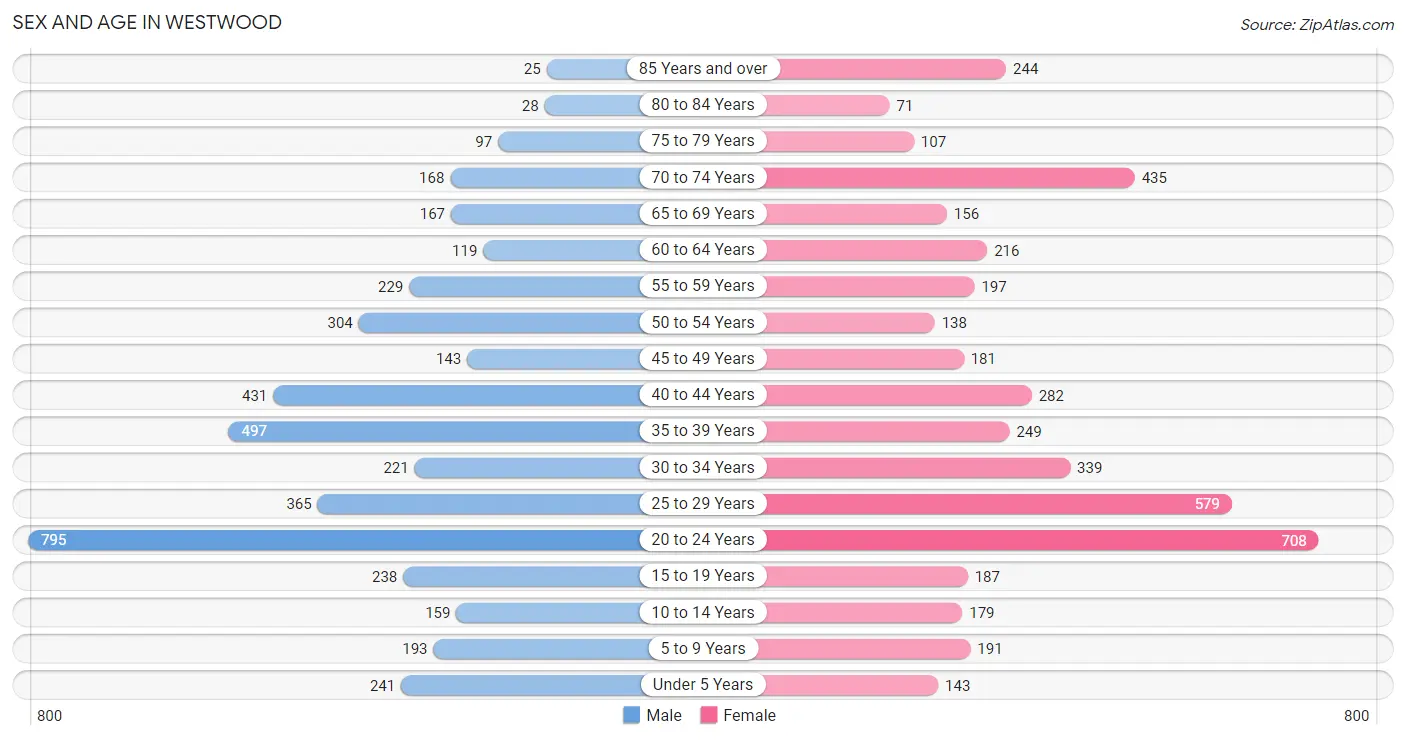
Sex and Age in Westwood
The most populous age groups in Westwood are 20 to 24 Years (795 | 18.0%) for men and 20 to 24 Years (708 | 15.4%) for women.
| Age Bracket | Male | Female |
| Under 5 Years | 241 (5.4%) | 143 (3.1%) |
| 5 to 9 Years | 193 (4.4%) | 191 (4.2%) |
| 10 to 14 Years | 159 (3.6%) | 179 (3.9%) |
| 15 to 19 Years | 238 (5.4%) | 187 (4.1%) |
| 20 to 24 Years | 795 (18.0%) | 708 (15.4%) |
| 25 to 29 Years | 365 (8.3%) | 579 (12.6%) |
| 30 to 34 Years | 221 (5.0%) | 339 (7.4%) |
| 35 to 39 Years | 497 (11.2%) | 249 (5.4%) |
| 40 to 44 Years | 431 (9.8%) | 282 (6.1%) |
| 45 to 49 Years | 143 (3.2%) | 181 (3.9%) |
| 50 to 54 Years | 304 (6.9%) | 138 (3.0%) |
| 55 to 59 Years | 229 (5.2%) | 197 (4.3%) |
| 60 to 64 Years | 119 (2.7%) | 216 (4.7%) |
| 65 to 69 Years | 167 (3.8%) | 156 (3.4%) |
| 70 to 74 Years | 168 (3.8%) | 435 (9.5%) |
| 75 to 79 Years | 97 (2.2%) | 107 (2.3%) |
| 80 to 84 Years | 28 (0.6%) | 71 (1.5%) |
| 85 Years and over | 25 (0.6%) | 244 (5.3%) |
| Total | 4,420 (100.0%) | 4,602 (100.0%) |
Families and Households in Westwood
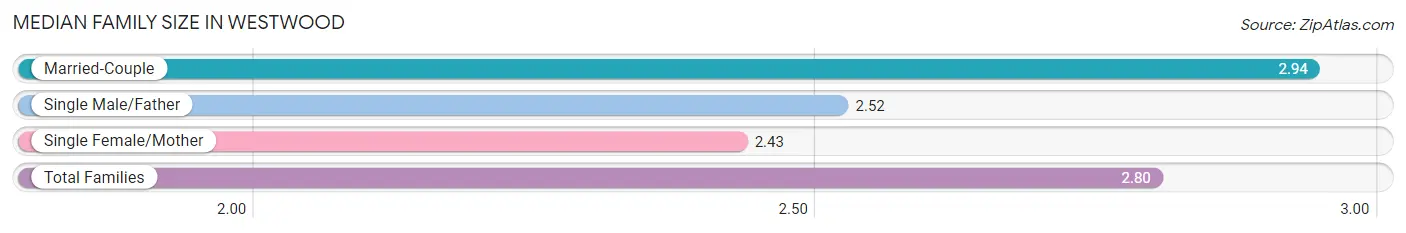
Median Family Size in Westwood
The median family size in Westwood is 2.80 persons per family, with married-couple families (1,390 | 71.4%) accounting for the largest median family size of 2.94 persons per family. On the other hand, single female/mother families (445 | 22.9%) represent the smallest median family size with 2.43 persons per family.
| Family Type | # Families | Family Size |
| Married-Couple | 1,390 (71.4%) | 2.94 |
| Single Male/Father | 111 (5.7%) | 2.52 |
| Single Female/Mother | 445 (22.9%) | 2.43 |
| Total Families | 1,946 (100.0%) | 2.80 |
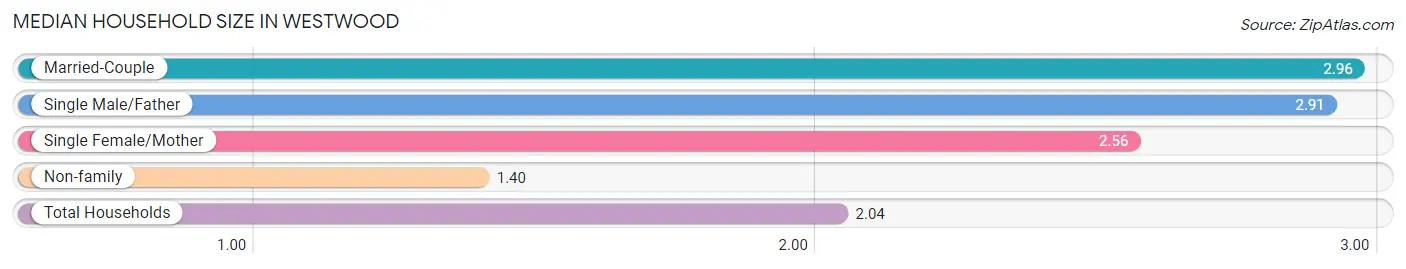
Median Household Size in Westwood
The median household size in Westwood is 2.04 persons per household, with married-couple households (1,390 | 31.5%) accounting for the largest median household size of 2.96 persons per household. non-family households (2,467 | 55.9%) represent the smallest median household size with 1.40 persons per household.
| Household Type | # Households | Household Size |
| Married-Couple | 1,390 (31.5%) | 2.96 |
| Single Male/Father | 111 (2.5%) | 2.91 |
| Single Female/Mother | 445 (10.1%) | 2.56 |
| Non-family | 2,467 (55.9%) | 1.40 |
| Total Households | 4,413 (100.0%) | 2.04 |
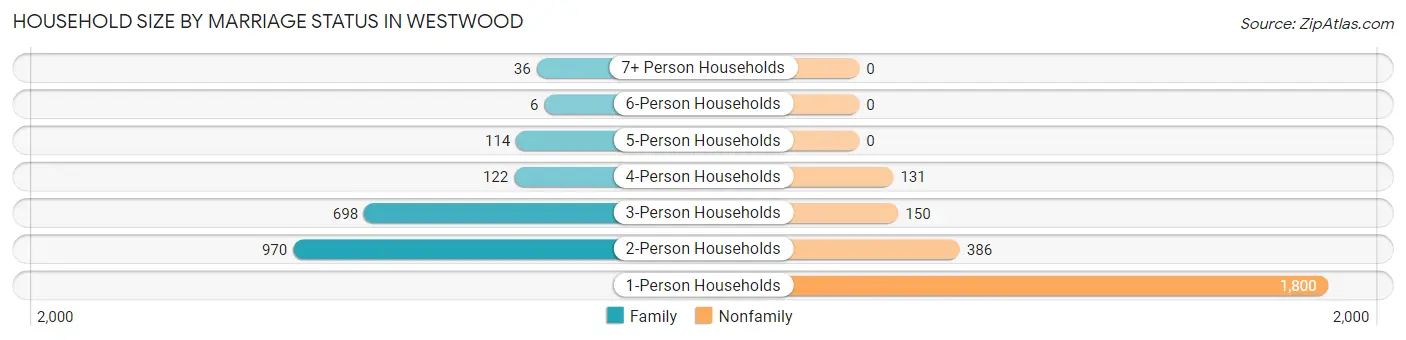
Household Size by Marriage Status in Westwood
Out of a total of 4,413 households in Westwood, 1,946 (44.1%) are family households, while 2,467 (55.9%) are nonfamily households. The most numerous type of family households are 2-person households, comprising 970, and the most common type of nonfamily households are 1-person households, comprising 1,800.
| Household Size | Family Households | Nonfamily Households |
| 1-Person Households | - | 1,800 (40.8%) |
| 2-Person Households | 970 (22.0%) | 386 (8.7%) |
| 3-Person Households | 698 (15.8%) | 150 (3.4%) |
| 4-Person Households | 122 (2.8%) | 131 (3.0%) |
| 5-Person Households | 114 (2.6%) | 0 (0.0%) |
| 6-Person Households | 6 (0.1%) | 0 (0.0%) |
| 7+ Person Households | 36 (0.8%) | 0 (0.0%) |
| Total | 1,946 (44.1%) | 2,467 (55.9%) |
Female Fertility in Westwood
Fertility by Age in Westwood
Average fertility rate in Westwood is 17.0 births per 1,000 women. Women in the age bracket of 35 to 50 years have the highest fertility rate with 29.0 births per 1,000 women. Women in the age bracket of 20 to 34 years acount for 51.1% of all women with births.
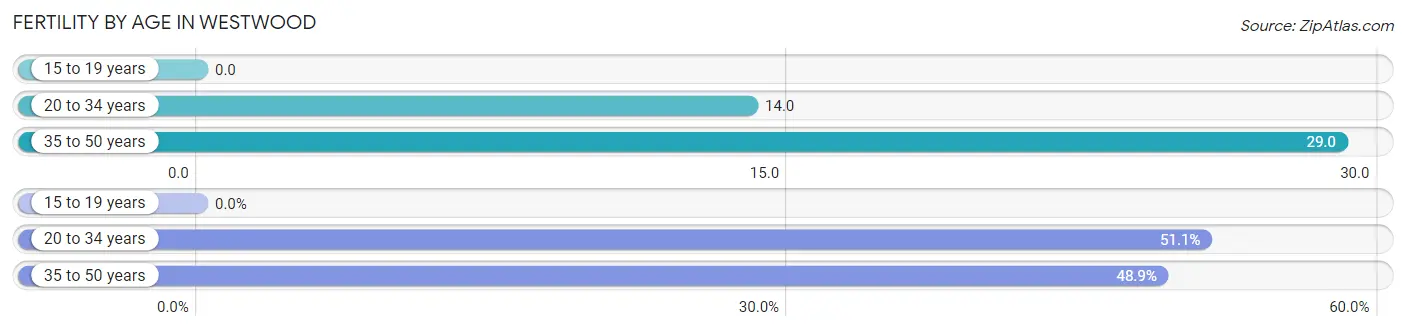
| Age Bracket | Women with Births | Births / 1,000 Women |
| 15 to 19 years | 0 (0.0%) | 0.0 |
| 20 to 34 years | 23 (51.1%) | 14.0 |
| 35 to 50 years | 22 (48.9%) | 29.0 |
| Total | 45 (100.0%) | 17.0 |
Fertility by Age by Marriage Status in Westwood
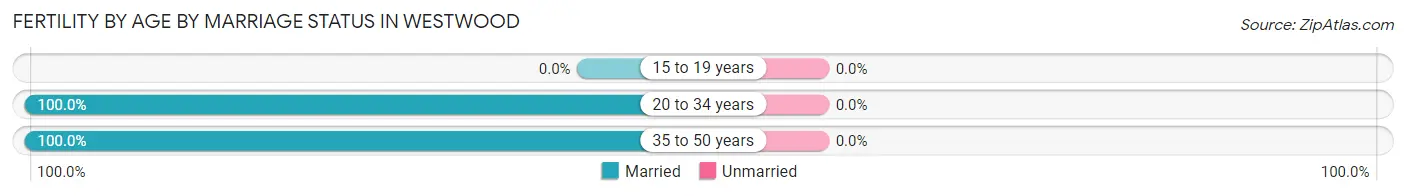
| Age Bracket | Married | Unmarried |
| 15 to 19 years | 0 (0.0%) | 0 (0.0%) |
| 20 to 34 years | 23 (100.0%) | 0 (0.0%) |
| 35 to 50 years | 22 (100.0%) | 0 (0.0%) |
| Total | 45 (100.0%) | 0 (0.0%) |
Fertility by Education in Westwood
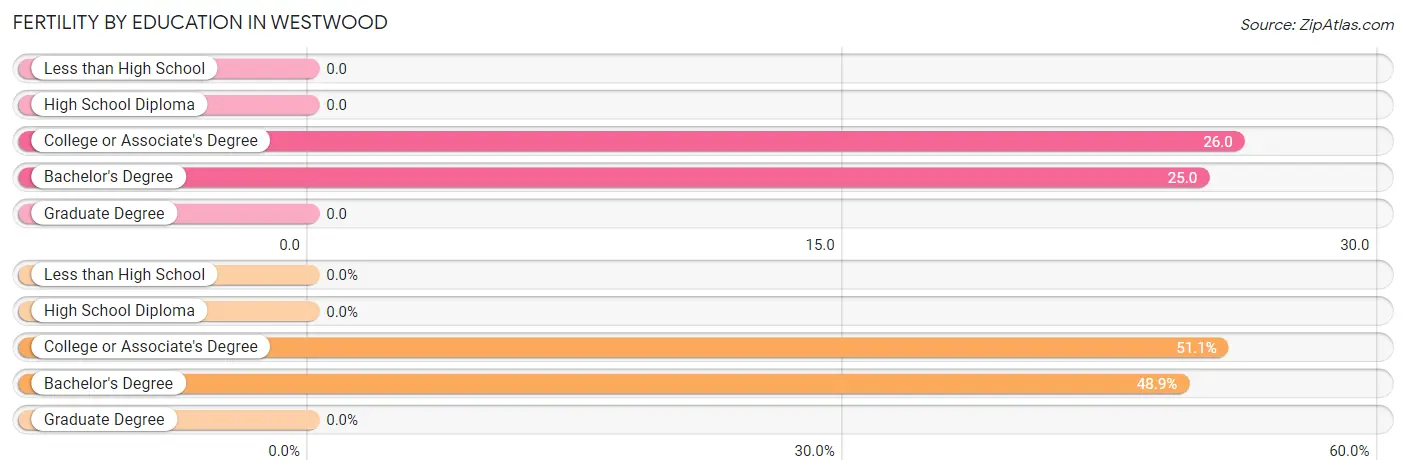
| Educational Attainment | Women with Births | Births / 1,000 Women |
| Less than High School | 0 (0.0%) | 0.0 |
| High School Diploma | 0 (0.0%) | 0.0 |
| College or Associate's Degree | 23 (51.1%) | 26.0 |
| Bachelor's Degree | 22 (48.9%) | 25.0 |
| Graduate Degree | 0 (0.0%) | 0.0 |
| Total | 45 (100.0%) | 17.0 |
Fertility by Education by Marriage Status in Westwood
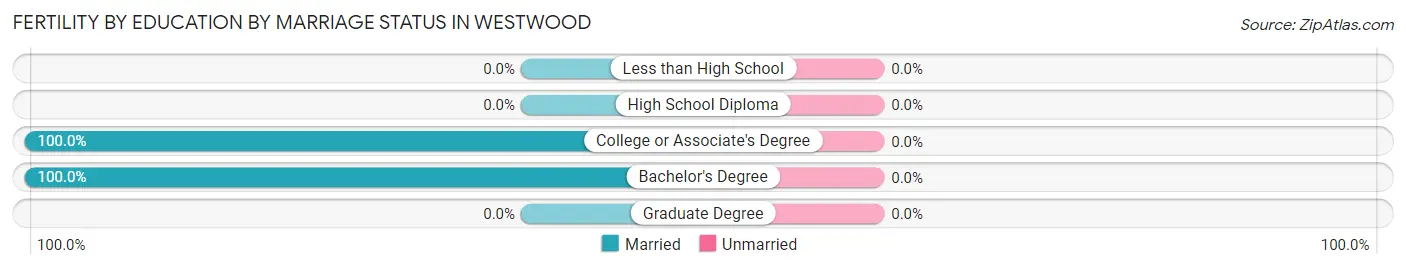
| Educational Attainment | Married | Unmarried |
| Less than High School | 0 (0.0%) | 0 (0.0%) |
| High School Diploma | 0 (0.0%) | 0 (0.0%) |
| College or Associate's Degree | 23 (100.0%) | 0 (0.0%) |
| Bachelor's Degree | 22 (100.0%) | 0 (0.0%) |
| Graduate Degree | 0 (0.0%) | 0 (0.0%) |
| Total | 45 (100.0%) | 0 (0.0%) |
Income in Westwood
Income Overview in Westwood
Per Capita Income in Westwood is $43,640, while median incomes of families and households are $82,257 and $61,348 respectively.
| Characteristic | Number | Measure |
| Per Capita Income | 9,022 | $43,640 |
| Median Family Income | 1,946 | $82,257 |
| Mean Family Income | 1,946 | $99,088 |
| Median Household Income | 4,413 | $61,348 |
| Mean Household Income | 4,413 | $87,286 |
| Income Deficit | 1,946 | $0 |
| Wage / Income Gap (%) | 9,022 | 33.44% |
| Wage / Income Gap ($) | 9,022 | 66.56¢ per $1 |
| Gini / Inequality Index | 9,022 | 0.51 |
Earnings by Sex in Westwood
Average Earnings in Westwood are $39,889, $45,873 for men and $30,534 for women, a difference of 33.4%.
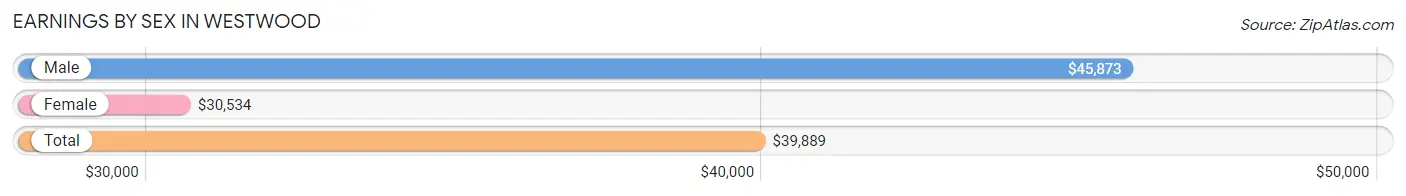
| Sex | Number | Average Earnings |
| Male | 2,985 (53.3%) | $45,873 |
| Female | 2,618 (46.7%) | $30,534 |
| Total | 5,603 (100.0%) | $39,889 |
Earnings by Sex by Income Bracket in Westwood
The most common earnings brackets in Westwood are $100,000+ for men (395 | 13.2%) and $5,000 to $7,499 for women (269 | 10.3%).
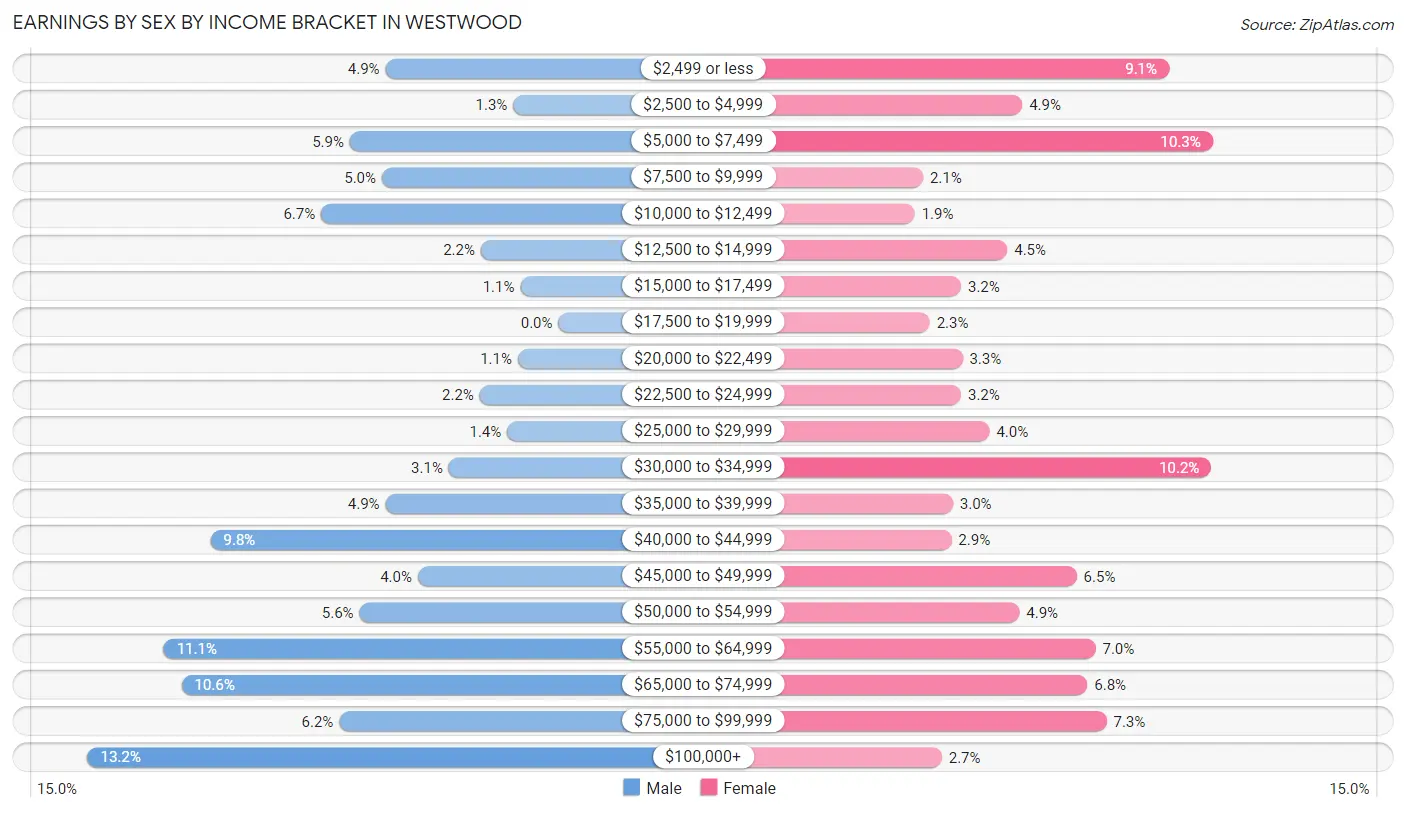
| Income | Male | Female |
| $2,499 or less | 145 (4.9%) | 237 (9.0%) |
| $2,500 to $4,999 | 38 (1.3%) | 129 (4.9%) |
| $5,000 to $7,499 | 175 (5.9%) | 269 (10.3%) |
| $7,500 to $9,999 | 148 (5.0%) | 56 (2.1%) |
| $10,000 to $12,499 | 199 (6.7%) | 50 (1.9%) |
| $12,500 to $14,999 | 65 (2.2%) | 118 (4.5%) |
| $15,000 to $17,499 | 32 (1.1%) | 84 (3.2%) |
| $17,500 to $19,999 | 0 (0.0%) | 61 (2.3%) |
| $20,000 to $22,499 | 34 (1.1%) | 85 (3.3%) |
| $22,500 to $24,999 | 66 (2.2%) | 84 (3.2%) |
| $25,000 to $29,999 | 43 (1.4%) | 105 (4.0%) |
| $30,000 to $34,999 | 92 (3.1%) | 268 (10.2%) |
| $35,000 to $39,999 | 145 (4.9%) | 78 (3.0%) |
| $40,000 to $44,999 | 292 (9.8%) | 77 (2.9%) |
| $45,000 to $49,999 | 118 (4.0%) | 169 (6.5%) |
| $50,000 to $54,999 | 167 (5.6%) | 127 (4.9%) |
| $55,000 to $64,999 | 331 (11.1%) | 183 (7.0%) |
| $65,000 to $74,999 | 316 (10.6%) | 177 (6.8%) |
| $75,000 to $99,999 | 184 (6.2%) | 191 (7.3%) |
| $100,000+ | 395 (13.2%) | 70 (2.7%) |
| Total | 2,985 (100.0%) | 2,618 (100.0%) |
Earnings by Sex by Educational Attainment in Westwood
Average earnings in Westwood are $55,377 for men and $44,797 for women, a difference of 19.1%. Men with an educational attainment of graduate degree enjoy the highest average annual earnings of $67,044, while those with less than high school education earn the least with $44,527. Women with an educational attainment of graduate degree earn the most with the average annual earnings of $58,183, while those with college or associate's degree education have the smallest earnings of $30,427.
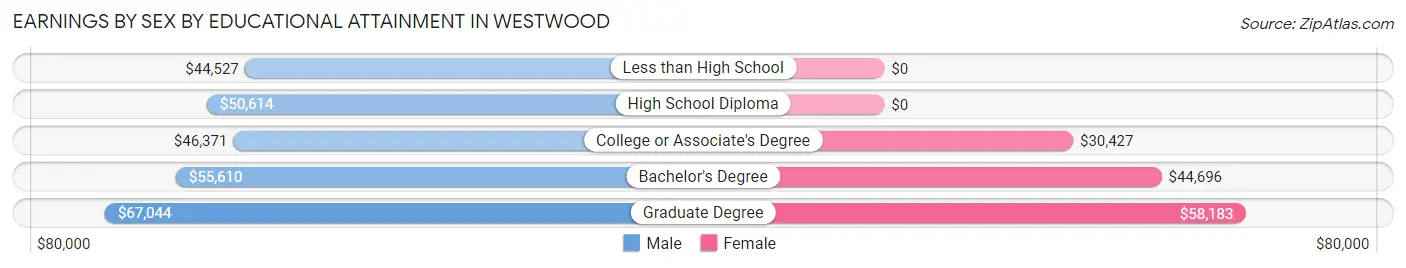
| Educational Attainment | Male Income | Female Income |
| Less than High School | $44,527 | $0 |
| High School Diploma | $50,614 | $0 |
| College or Associate's Degree | $46,371 | $30,427 |
| Bachelor's Degree | $55,610 | $44,696 |
| Graduate Degree | $67,044 | $58,183 |
| Total | $55,377 | $44,797 |
Family Income in Westwood
Family Income Brackets in Westwood
According to the Westwood family income data, there are 455 families falling into the $50,000 to $74,999 income range, which is the most common income bracket and makes up 23.4% of all families.
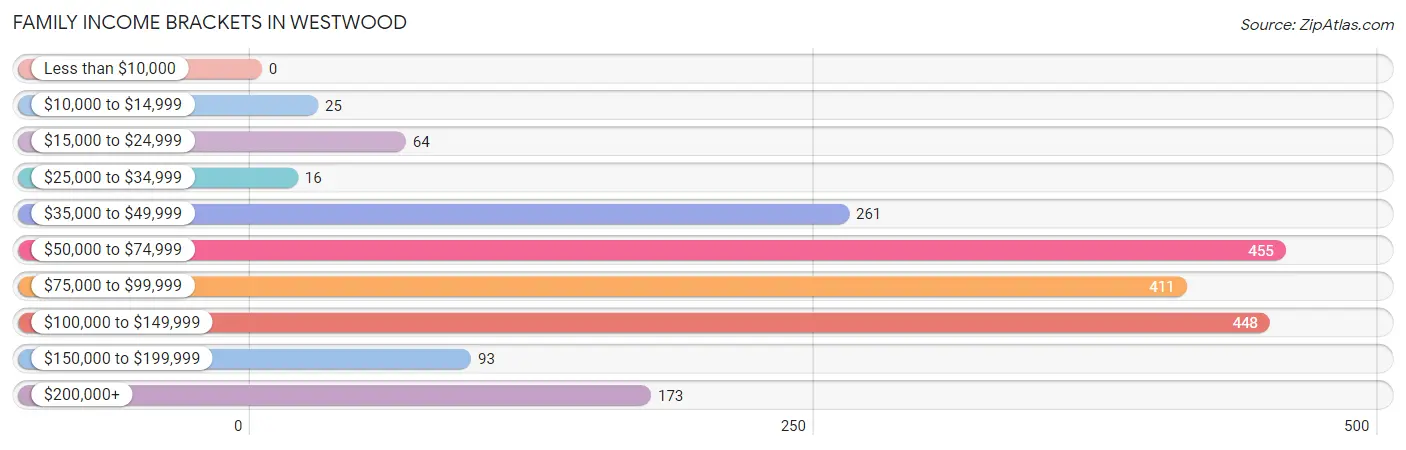
| Income Bracket | # Families | % Families |
| Less than $10,000 | 0 | 0.0% |
| $10,000 to $14,999 | 25 | 1.3% |
| $15,000 to $24,999 | 64 | 3.3% |
| $25,000 to $34,999 | 16 | 0.8% |
| $35,000 to $49,999 | 261 | 13.4% |
| $50,000 to $74,999 | 455 | 23.4% |
| $75,000 to $99,999 | 411 | 21.1% |
| $100,000 to $149,999 | 448 | 23.0% |
| $150,000 to $199,999 | 93 | 4.8% |
| $200,000+ | 173 | 8.9% |
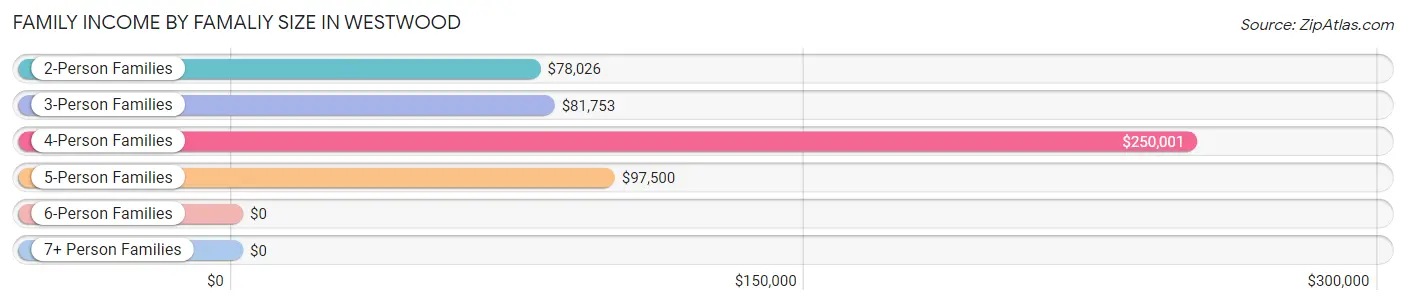
Family Income by Famaliy Size in Westwood
4-person families (113 | 5.8%) account for the highest median family income in Westwood with $250,001 per family, while 4-person families (113 | 5.8%) have the highest median income of $62,500 per family member.
| Income Bracket | # Families | Median Income |
| 2-Person Families | 1,046 (53.7%) | $78,026 |
| 3-Person Families | 631 (32.4%) | $81,753 |
| 4-Person Families | 113 (5.8%) | $250,001 |
| 5-Person Families | 114 (5.9%) | $97,500 |
| 6-Person Families | 23 (1.2%) | $0 |
| 7+ Person Families | 19 (1.0%) | $0 |
| Total | 1,946 (100.0%) | $82,257 |
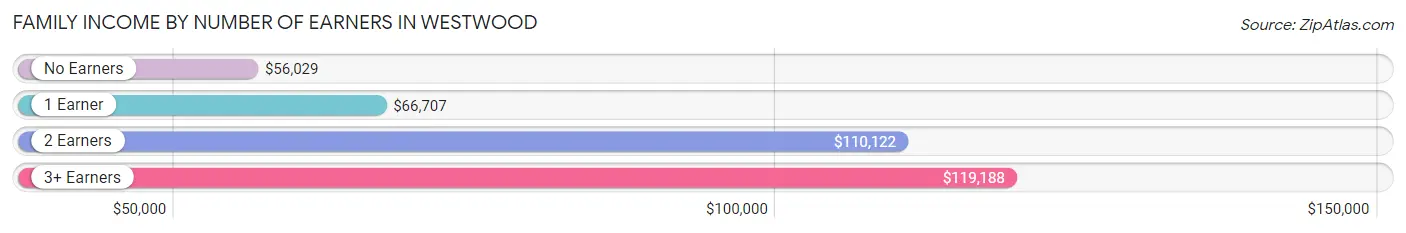
Family Income by Number of Earners in Westwood
The median family income in Westwood is $82,257, with families comprising 3+ earners (183) having the highest median family income of $119,188, while families with no earners (284) have the lowest median family income of $56,029, accounting for 9.4% and 14.6% of families, respectively.
| Number of Earners | # Families | Median Income |
| No Earners | 284 (14.6%) | $56,029 |
| 1 Earner | 635 (32.6%) | $66,707 |
| 2 Earners | 844 (43.4%) | $110,122 |
| 3+ Earners | 183 (9.4%) | $119,188 |
| Total | 1,946 (100.0%) | $82,257 |
Household Income in Westwood
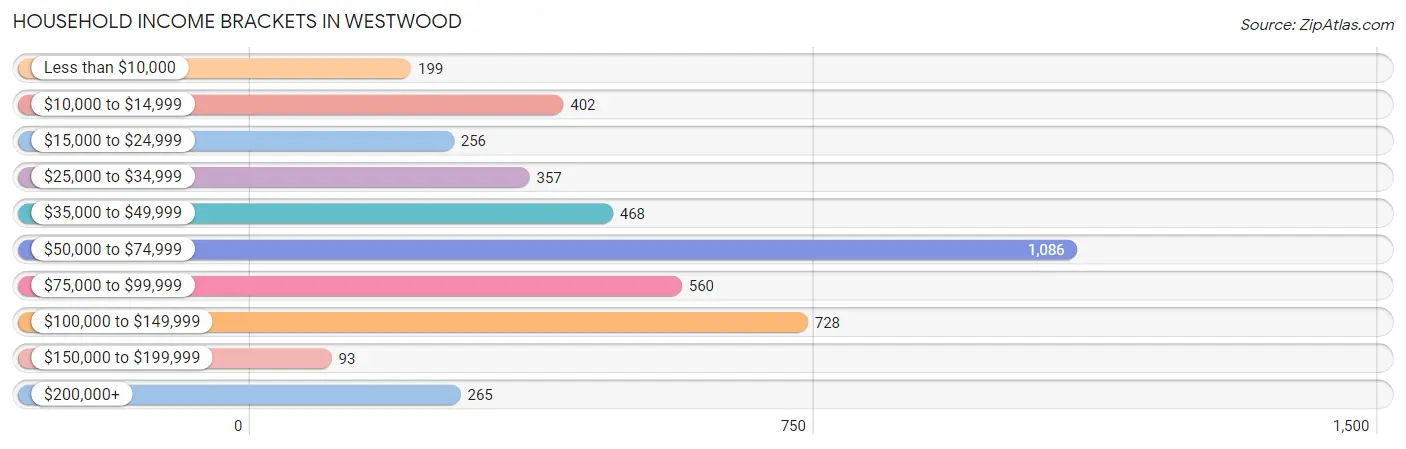
Household Income Brackets in Westwood
With 1,086 households falling in the category, the $50,000 to $74,999 income range is the most frequent in Westwood, accounting for 24.6% of all households. In contrast, only 93 households (2.1%) fall into the $150,000 to $199,999 income bracket, making it the least populous group.
| Income Bracket | # Households | % Households |
| Less than $10,000 | 199 | 4.5% |
| $10,000 to $14,999 | 402 | 9.1% |
| $15,000 to $24,999 | 256 | 5.8% |
| $25,000 to $34,999 | 357 | 8.1% |
| $35,000 to $49,999 | 468 | 10.6% |
| $50,000 to $74,999 | 1,086 | 24.6% |
| $75,000 to $99,999 | 560 | 12.7% |
| $100,000 to $149,999 | 728 | 16.5% |
| $150,000 to $199,999 | 93 | 2.1% |
| $200,000+ | 265 | 6.0% |
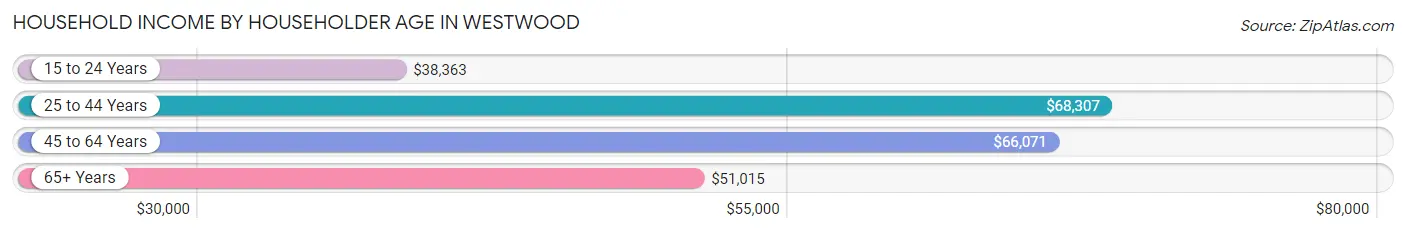
Household Income by Householder Age in Westwood
The median household income in Westwood is $61,348, with the highest median household income of $68,307 found in the 25 to 44 years age bracket for the primary householder. A total of 1,582 households (35.8%) fall into this category. Meanwhile, the 15 to 24 years age bracket for the primary householder has the lowest median household income of $38,363, with 632 households (14.3%) in this group.
| Income Bracket | # Households | Median Income |
| 15 to 24 Years | 632 (14.3%) | $38,363 |
| 25 to 44 Years | 1,582 (35.8%) | $68,307 |
| 45 to 64 Years | 1,026 (23.3%) | $66,071 |
| 65+ Years | 1,173 (26.6%) | $51,015 |
| Total | 4,413 (100.0%) | $61,348 |
Poverty in Westwood
Income Below Poverty by Sex and Age in Westwood
With 14.8% poverty level for males and 17.6% for females among the residents of Westwood, 45 to 54 year old males and 5 year old females are the most vulnerable to poverty, with 191 males (42.7%) and 13 females (100.0%) in their respective age groups living below the poverty level.
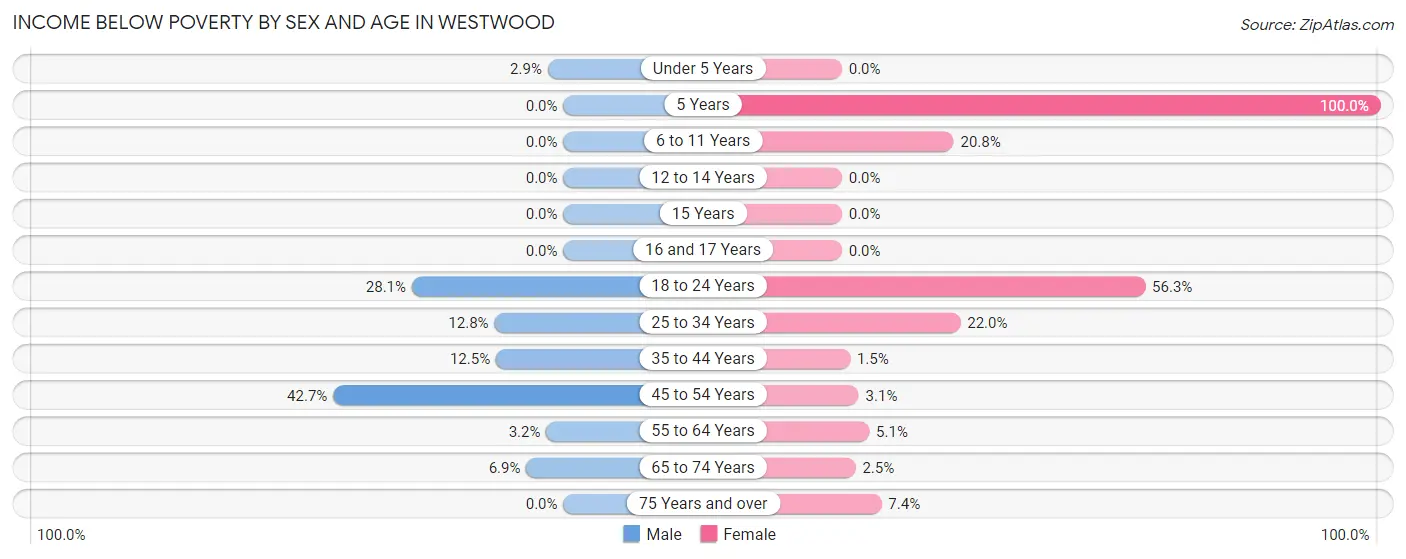
| Age Bracket | Male | Female |
| Under 5 Years | 7 (2.9%) | 0 (0.0%) |
| 5 Years | 0 (0.0%) | 13 (100.0%) |
| 6 to 11 Years | 0 (0.0%) | 44 (20.7%) |
| 12 to 14 Years | 0 (0.0%) | 0 (0.0%) |
| 15 Years | 0 (0.0%) | 0 (0.0%) |
| 16 and 17 Years | 0 (0.0%) | 0 (0.0%) |
| 18 to 24 Years | 230 (28.1%) | 464 (56.3%) |
| 25 to 34 Years | 75 (12.8%) | 202 (22.0%) |
| 35 to 44 Years | 116 (12.5%) | 8 (1.5%) |
| 45 to 54 Years | 191 (42.7%) | 10 (3.1%) |
| 55 to 64 Years | 11 (3.2%) | 21 (5.1%) |
| 65 to 74 Years | 23 (6.9%) | 15 (2.5%) |
| 75 Years and over | 0 (0.0%) | 31 (7.3%) |
| Total | 653 (14.8%) | 808 (17.6%) |
Income Above Poverty by Sex and Age in Westwood
According to the poverty statistics in Westwood, males aged 5 years and females aged under 5 years are the age groups that are most secure financially, with 100.0% of males and 100.0% of females in these age groups living above the poverty line.
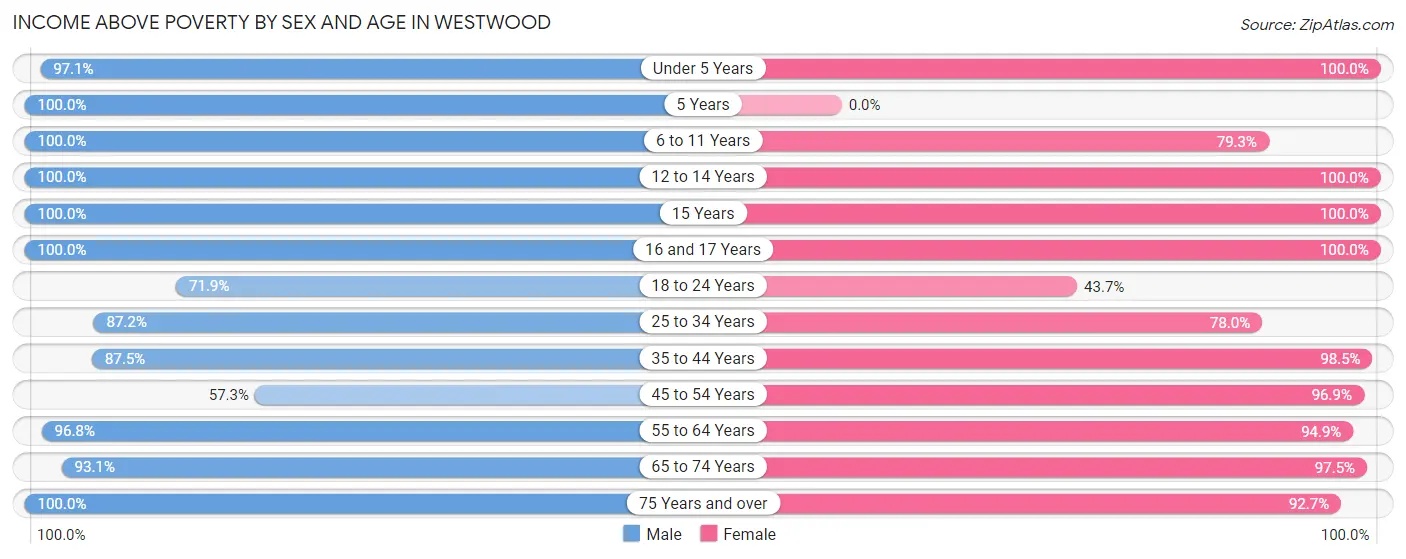
| Age Bracket | Male | Female |
| Under 5 Years | 234 (97.1%) | 143 (100.0%) |
| 5 Years | 17 (100.0%) | 0 (0.0%) |
| 6 to 11 Years | 213 (100.0%) | 168 (79.2%) |
| 12 to 14 Years | 104 (100.0%) | 145 (100.0%) |
| 15 Years | 131 (100.0%) | 22 (100.0%) |
| 16 and 17 Years | 84 (100.0%) | 49 (100.0%) |
| 18 to 24 Years | 588 (71.9%) | 360 (43.7%) |
| 25 to 34 Years | 511 (87.2%) | 716 (78.0%) |
| 35 to 44 Years | 812 (87.5%) | 523 (98.5%) |
| 45 to 54 Years | 256 (57.3%) | 309 (96.9%) |
| 55 to 64 Years | 337 (96.8%) | 392 (94.9%) |
| 65 to 74 Years | 312 (93.1%) | 576 (97.5%) |
| 75 Years and over | 150 (100.0%) | 391 (92.6%) |
| Total | 3,749 (85.2%) | 3,794 (82.4%) |
Income Below Poverty Among Married-Couple Families in Westwood
The poverty statistics for married-couple families in Westwood show that 0.4% or 6 of the total 1,390 families live below the poverty line. Families with 3 or 4 children have the highest poverty rate of 5.0%, comprising of 6 families. On the other hand, families with no children have the lowest poverty rate of 0.0%, which includes 0 families.
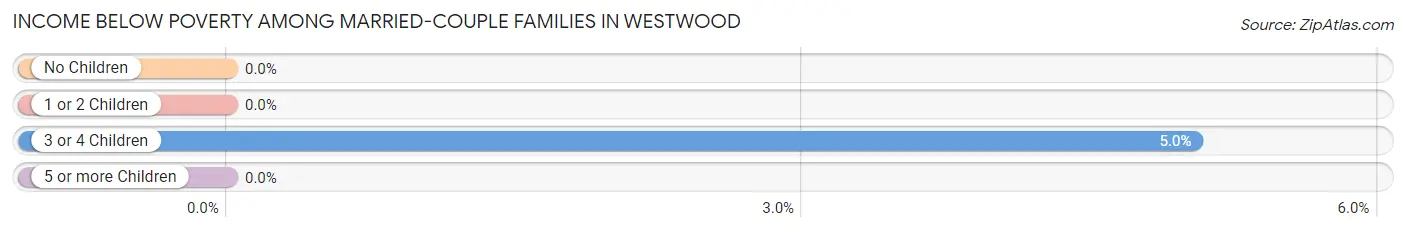
| Children | Above Poverty | Below Poverty |
| No Children | 852 (100.0%) | 0 (0.0%) |
| 1 or 2 Children | 419 (100.0%) | 0 (0.0%) |
| 3 or 4 Children | 113 (95.0%) | 6 (5.0%) |
| 5 or more Children | 0 (0.0%) | 0 (0.0%) |
| Total | 1,384 (99.6%) | 6 (0.4%) |
Income Below Poverty Among Single-Parent Households in Westwood
According to the poverty data in Westwood, 10.8% or 12 single-father households and 5.6% or 25 single-mother households are living below the poverty line. Among single-father households, those with no children have the highest poverty rate, with 12 households (57.1%) experiencing poverty. Likewise, among single-mother households, those with 1 or 2 children have the highest poverty rate, with 25 households (12.6%) falling below the poverty line.
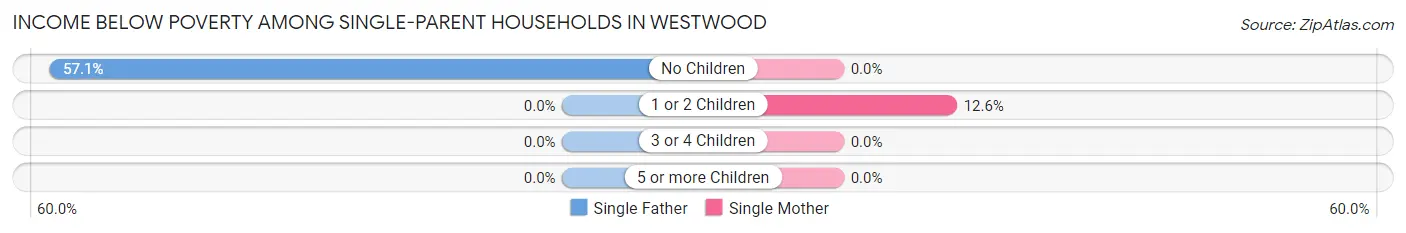
| Children | Single Father | Single Mother |
| No Children | 12 (57.1%) | 0 (0.0%) |
| 1 or 2 Children | 0 (0.0%) | 25 (12.6%) |
| 3 or 4 Children | 0 (0.0%) | 0 (0.0%) |
| 5 or more Children | 0 (0.0%) | 0 (0.0%) |
| Total | 12 (10.8%) | 25 (5.6%) |
Income Below Poverty Among Married-Couple vs Single-Parent Households in Westwood
The poverty data for Westwood shows that 6 of the married-couple family households (0.4%) and 37 of the single-parent households (6.7%) are living below the poverty level. Within the married-couple family households, those with 3 or 4 children have the highest poverty rate, with 6 households (5.0%) falling below the poverty line. Among the single-parent households, those with 1 or 2 children have the highest poverty rate, with 25 household (8.7%) living below poverty.
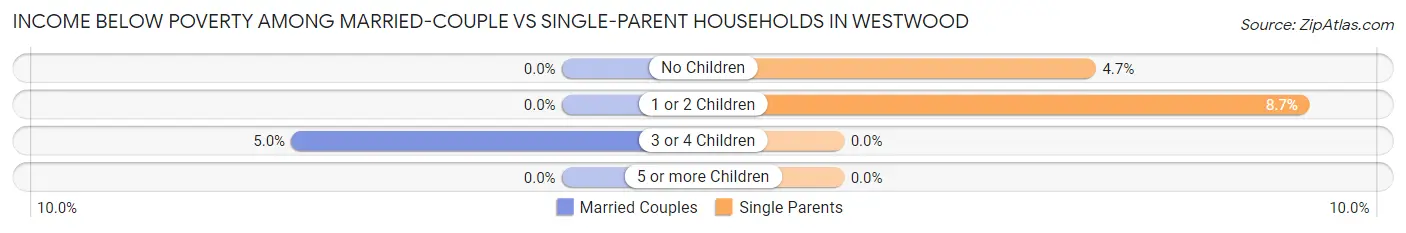
| Children | Married-Couple Families | Single-Parent Households |
| No Children | 0 (0.0%) | 12 (4.7%) |
| 1 or 2 Children | 0 (0.0%) | 25 (8.7%) |
| 3 or 4 Children | 6 (5.0%) | 0 (0.0%) |
| 5 or more Children | 0 (0.0%) | 0 (0.0%) |
| Total | 6 (0.4%) | 37 (6.7%) |
Employment Characteristics in Westwood
Employment by Class of Employer in Westwood
Among the 4,870 employed individuals in Westwood, private company employees (3,358 | 69.0%), not-for-profit organizations (619 | 12.7%), and state government employees (276 | 5.7%) make up the most common classes of employment.
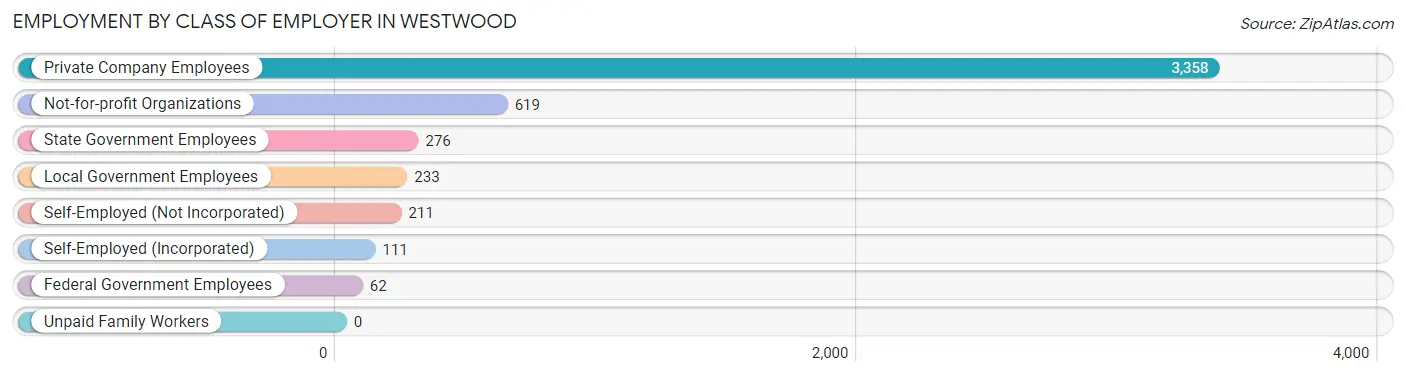
| Employer Class | # Employees | % Employees |
| Private Company Employees | 3,358 | 69.0% |
| Self-Employed (Incorporated) | 111 | 2.3% |
| Self-Employed (Not Incorporated) | 211 | 4.3% |
| Not-for-profit Organizations | 619 | 12.7% |
| Local Government Employees | 233 | 4.8% |
| State Government Employees | 276 | 5.7% |
| Federal Government Employees | 62 | 1.3% |
| Unpaid Family Workers | 0 | 0.0% |
| Total | 4,870 | 100.0% |
Employment Status by Age in Westwood
According to the labor force statistics for Westwood, out of the total population over 16 years of age (7,763), 66.8% or 5,186 individuals are in the labor force, with 3.7% or 192 of them unemployed. The age group with the highest labor force participation rate is 55 to 59 years, with 94.4% or 402 individuals in the labor force. Within the labor force, the 16 to 19 years age range has the highest percentage of unemployed individuals, with 15.0% or 22 of them being unemployed.
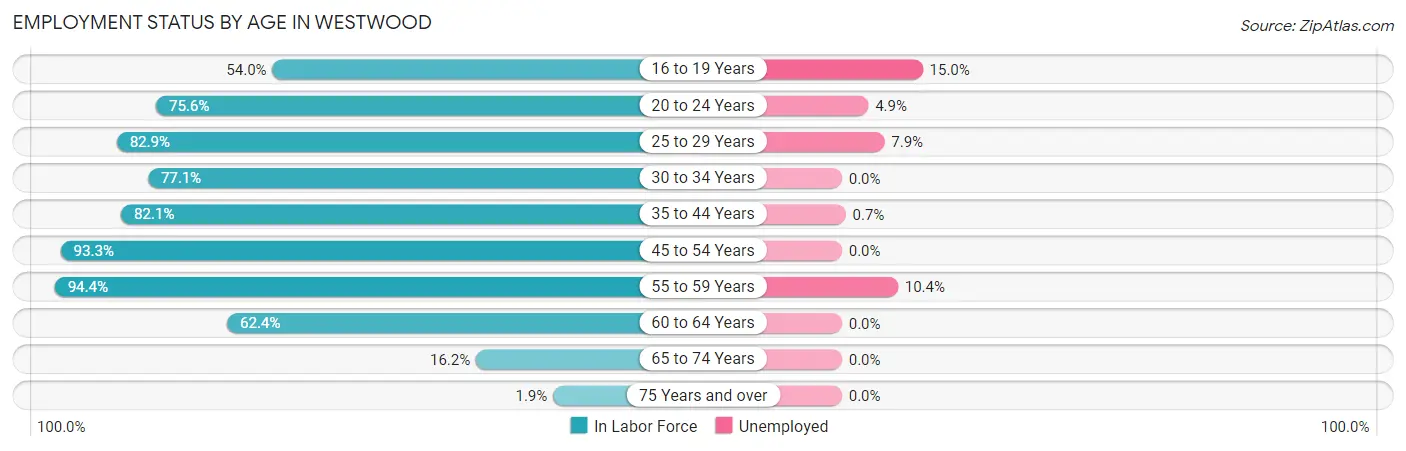
| Age Bracket | In Labor Force | Unemployed |
| 16 to 19 Years | 147 (54.0%) | 22 (15.0%) |
| 20 to 24 Years | 1,136 (75.6%) | 56 (4.9%) |
| 25 to 29 Years | 783 (82.9%) | 62 (7.9%) |
| 30 to 34 Years | 432 (77.1%) | 0 (0.0%) |
| 35 to 44 Years | 1,198 (82.1%) | 8 (0.7%) |
| 45 to 54 Years | 715 (93.3%) | 0 (0.0%) |
| 55 to 59 Years | 402 (94.4%) | 42 (10.4%) |
| 60 to 64 Years | 209 (62.4%) | 0 (0.0%) |
| 65 to 74 Years | 150 (16.2%) | 0 (0.0%) |
| 75 Years and over | 11 (1.9%) | 0 (0.0%) |
| Total | 5,186 (66.8%) | 192 (3.7%) |
Employment Status by Educational Attainment in Westwood
According to labor force statistics for Westwood, 83.3% of individuals (3,740) out of the total population between 25 and 64 years of age (4,490) are in the labor force, with 3.0% or 112 of them being unemployed. The group with the highest labor force participation rate are those with the educational attainment of bachelor's degree or higher, with 87.2% or 2,196 individuals in the labor force. Within the labor force, individuals with college / associate degree education have the highest percentage of unemployment, with 6.8% or 70 of them being unemployed.
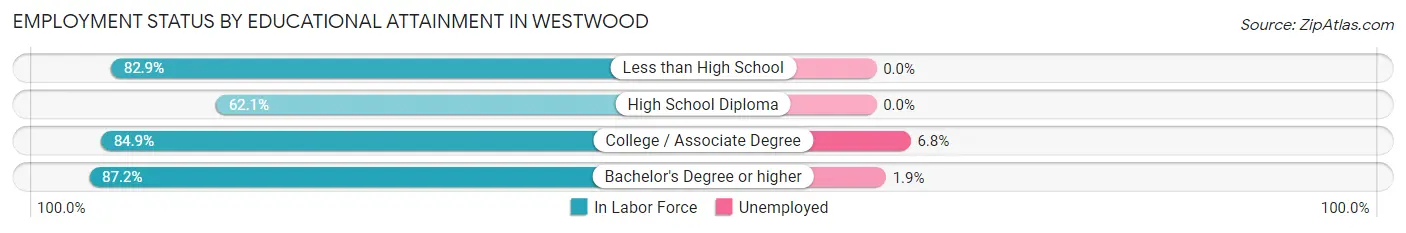
| Educational Attainment | In Labor Force | Unemployed |
| Less than High School | 179 (82.9%) | 0 (0.0%) |
| High School Diploma | 342 (62.1%) | 0 (0.0%) |
| College / Associate Degree | 1,023 (84.9%) | 82 (6.8%) |
| Bachelor's Degree or higher | 2,196 (87.2%) | 48 (1.9%) |
| Total | 3,740 (83.3%) | 135 (3.0%) |
Employment Occupations by Sex in Westwood
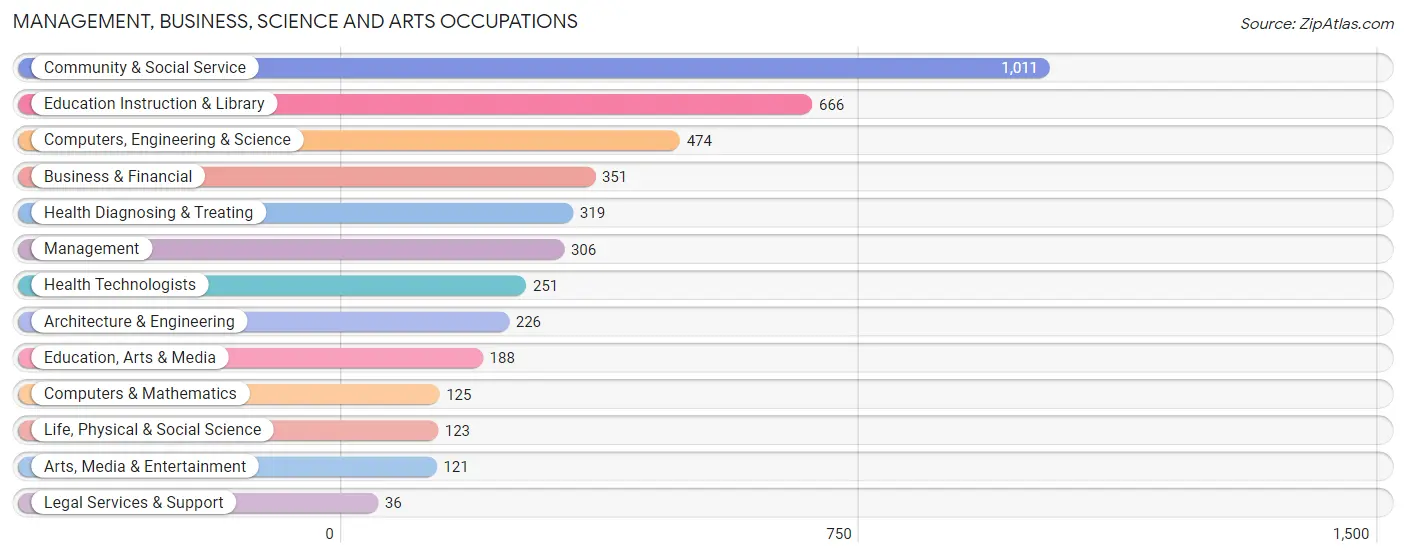
Management, Business, Science and Arts Occupations
The most common Management, Business, Science and Arts occupations in Westwood are Community & Social Service (1,011 | 20.3%), Education Instruction & Library (666 | 13.3%), Computers, Engineering & Science (474 | 9.5%), Business & Financial (351 | 7.0%), and Health Diagnosing & Treating (319 | 6.4%).
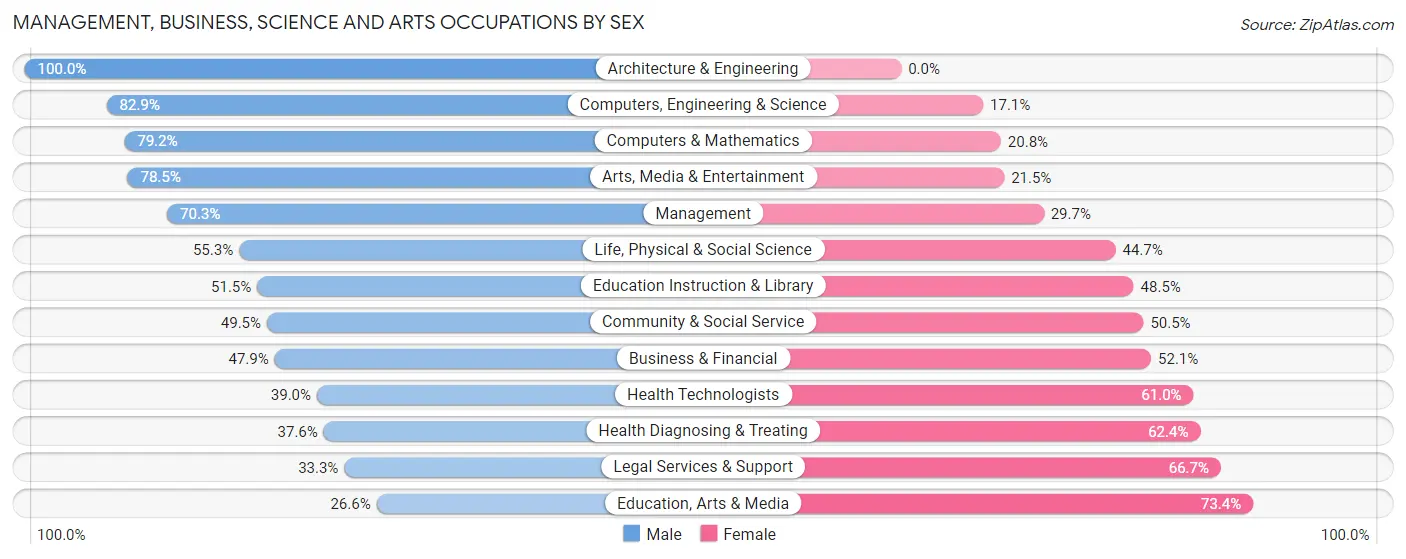
Management, Business, Science and Arts Occupations by Sex
Within the Management, Business, Science and Arts occupations in Westwood, the most male-oriented occupations are Architecture & Engineering (100.0%), Computers, Engineering & Science (82.9%), and Computers & Mathematics (79.2%), while the most female-oriented occupations are Education, Arts & Media (73.4%), Legal Services & Support (66.7%), and Health Diagnosing & Treating (62.4%).
| Occupation | Male | Female |
| Management | 215 (70.3%) | 91 (29.7%) |
| Business & Financial | 168 (47.9%) | 183 (52.1%) |
| Computers, Engineering & Science | 393 (82.9%) | 81 (17.1%) |
| Computers & Mathematics | 99 (79.2%) | 26 (20.8%) |
| Architecture & Engineering | 226 (100.0%) | 0 (0.0%) |
| Life, Physical & Social Science | 68 (55.3%) | 55 (44.7%) |
| Community & Social Service | 500 (49.5%) | 511 (50.5%) |
| Education, Arts & Media | 50 (26.6%) | 138 (73.4%) |
| Legal Services & Support | 12 (33.3%) | 24 (66.7%) |
| Education Instruction & Library | 343 (51.5%) | 323 (48.5%) |
| Arts, Media & Entertainment | 95 (78.5%) | 26 (21.5%) |
| Health Diagnosing & Treating | 120 (37.6%) | 199 (62.4%) |
| Health Technologists | 98 (39.0%) | 153 (61.0%) |
| Total (Category) | 1,396 (56.7%) | 1,065 (43.3%) |
| Total (Overall) | 2,693 (53.9%) | 2,300 (46.1%) |
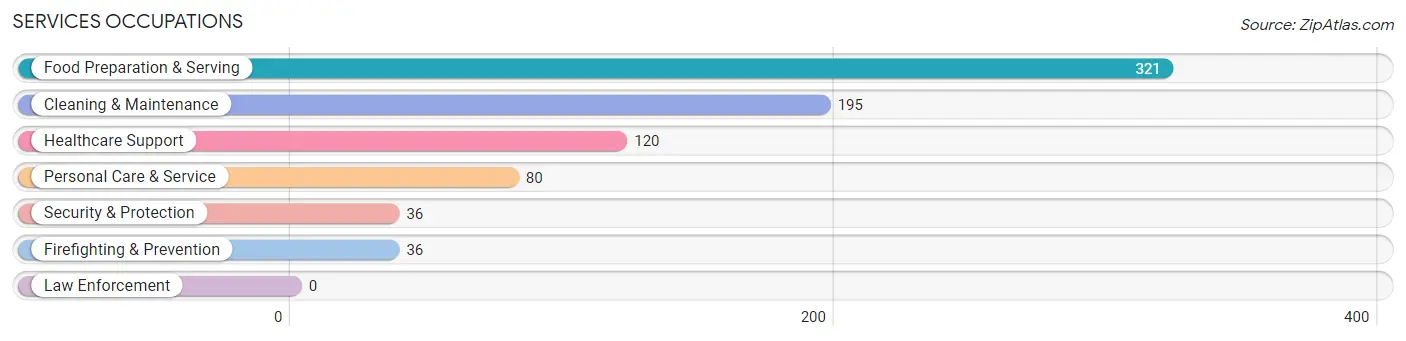
Services Occupations
The most common Services occupations in Westwood are Food Preparation & Serving (321 | 6.4%), Cleaning & Maintenance (195 | 3.9%), Healthcare Support (120 | 2.4%), Personal Care & Service (80 | 1.6%), and Security & Protection (36 | 0.7%).
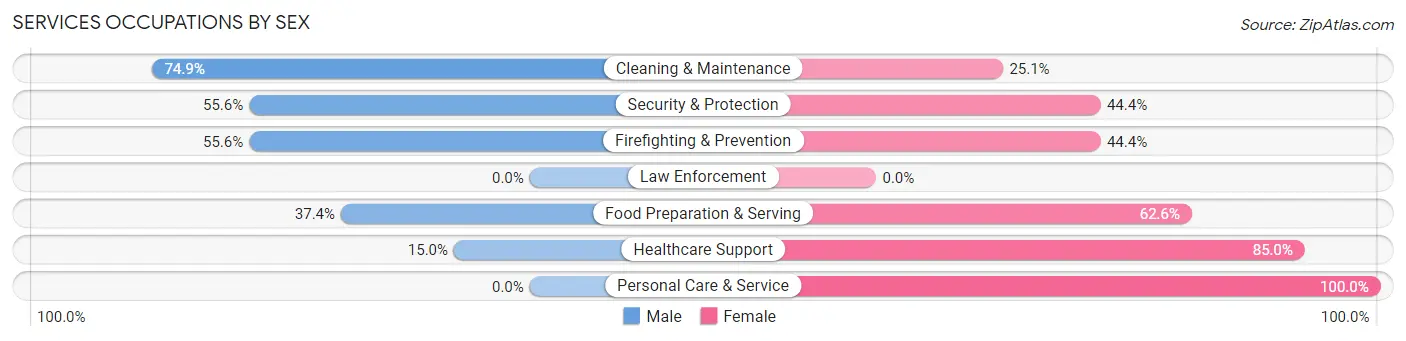
Services Occupations by Sex
Within the Services occupations in Westwood, the most male-oriented occupations are Cleaning & Maintenance (74.9%), Security & Protection (55.6%), and Firefighting & Prevention (55.6%), while the most female-oriented occupations are Personal Care & Service (100.0%), Healthcare Support (85.0%), and Food Preparation & Serving (62.6%).
| Occupation | Male | Female |
| Healthcare Support | 18 (15.0%) | 102 (85.0%) |
| Security & Protection | 20 (55.6%) | 16 (44.4%) |
| Firefighting & Prevention | 20 (55.6%) | 16 (44.4%) |
| Law Enforcement | 0 (0.0%) | 0 (0.0%) |
| Food Preparation & Serving | 120 (37.4%) | 201 (62.6%) |
| Cleaning & Maintenance | 146 (74.9%) | 49 (25.1%) |
| Personal Care & Service | 0 (0.0%) | 80 (100.0%) |
| Total (Category) | 304 (40.4%) | 448 (59.6%) |
| Total (Overall) | 2,693 (53.9%) | 2,300 (46.1%) |
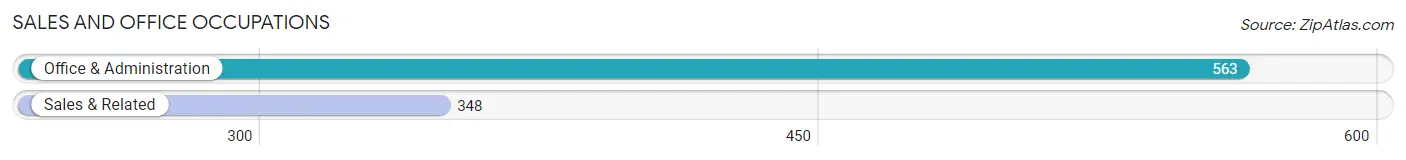
Sales and Office Occupations
The most common Sales and Office occupations in Westwood are Office & Administration (563 | 11.3%), and Sales & Related (348 | 7.0%).
Sales and Office Occupations by Sex
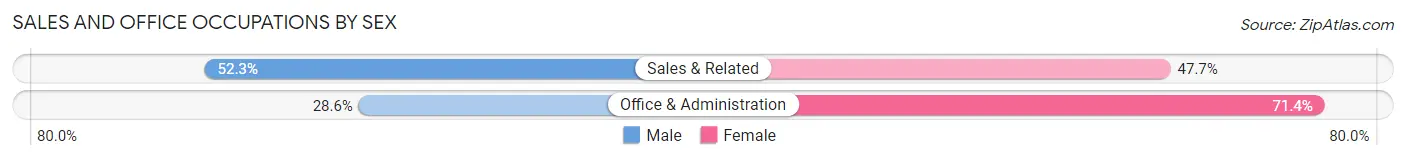
| Occupation | Male | Female |
| Sales & Related | 182 (52.3%) | 166 (47.7%) |
| Office & Administration | 161 (28.6%) | 402 (71.4%) |
| Total (Category) | 343 (37.7%) | 568 (62.4%) |
| Total (Overall) | 2,693 (53.9%) | 2,300 (46.1%) |
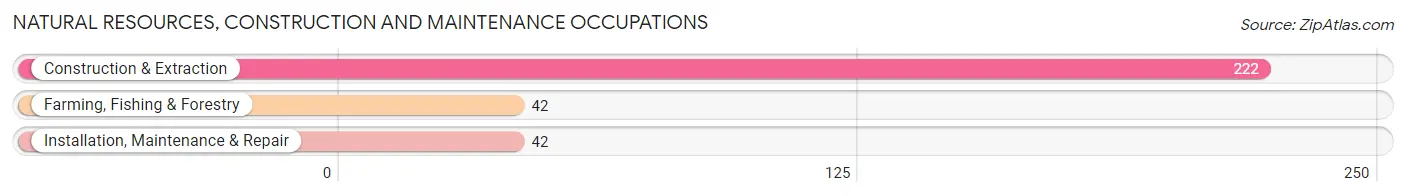
Natural Resources, Construction and Maintenance Occupations
The most common Natural Resources, Construction and Maintenance occupations in Westwood are Construction & Extraction (222 | 4.4%), Farming, Fishing & Forestry (42 | 0.8%), and Installation, Maintenance & Repair (42 | 0.8%).
Natural Resources, Construction and Maintenance Occupations by Sex
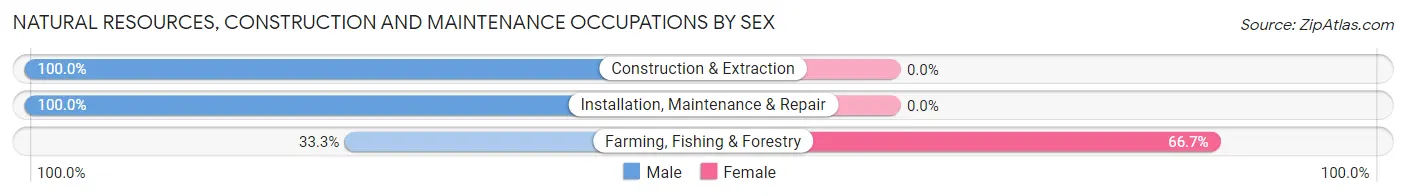
| Occupation | Male | Female |
| Farming, Fishing & Forestry | 14 (33.3%) | 28 (66.7%) |
| Construction & Extraction | 222 (100.0%) | 0 (0.0%) |
| Installation, Maintenance & Repair | 42 (100.0%) | 0 (0.0%) |
| Total (Category) | 278 (90.8%) | 28 (9.1%) |
| Total (Overall) | 2,693 (53.9%) | 2,300 (46.1%) |
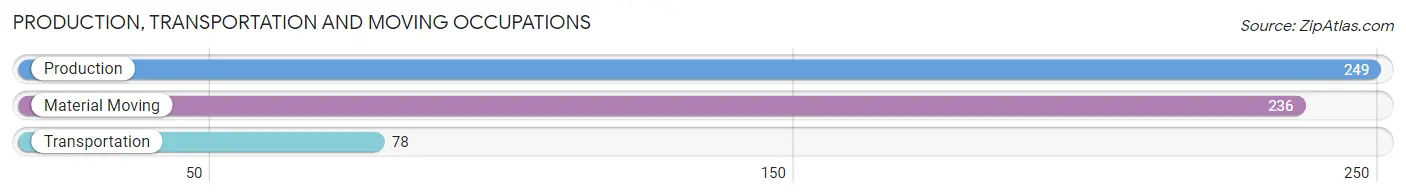
Production, Transportation and Moving Occupations
The most common Production, Transportation and Moving occupations in Westwood are Production (249 | 5.0%), Material Moving (236 | 4.7%), and Transportation (78 | 1.6%).
Production, Transportation and Moving Occupations by Sex
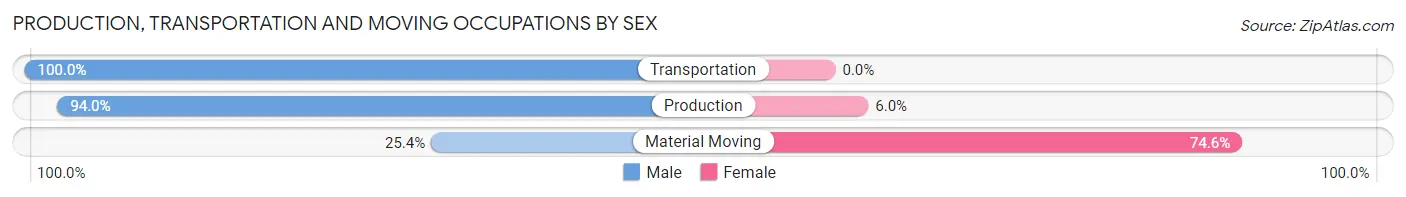
| Occupation | Male | Female |
| Production | 234 (94.0%) | 15 (6.0%) |
| Transportation | 78 (100.0%) | 0 (0.0%) |
| Material Moving | 60 (25.4%) | 176 (74.6%) |
| Total (Category) | 372 (66.1%) | 191 (33.9%) |
| Total (Overall) | 2,693 (53.9%) | 2,300 (46.1%) |
Employment Industries by Sex in Westwood
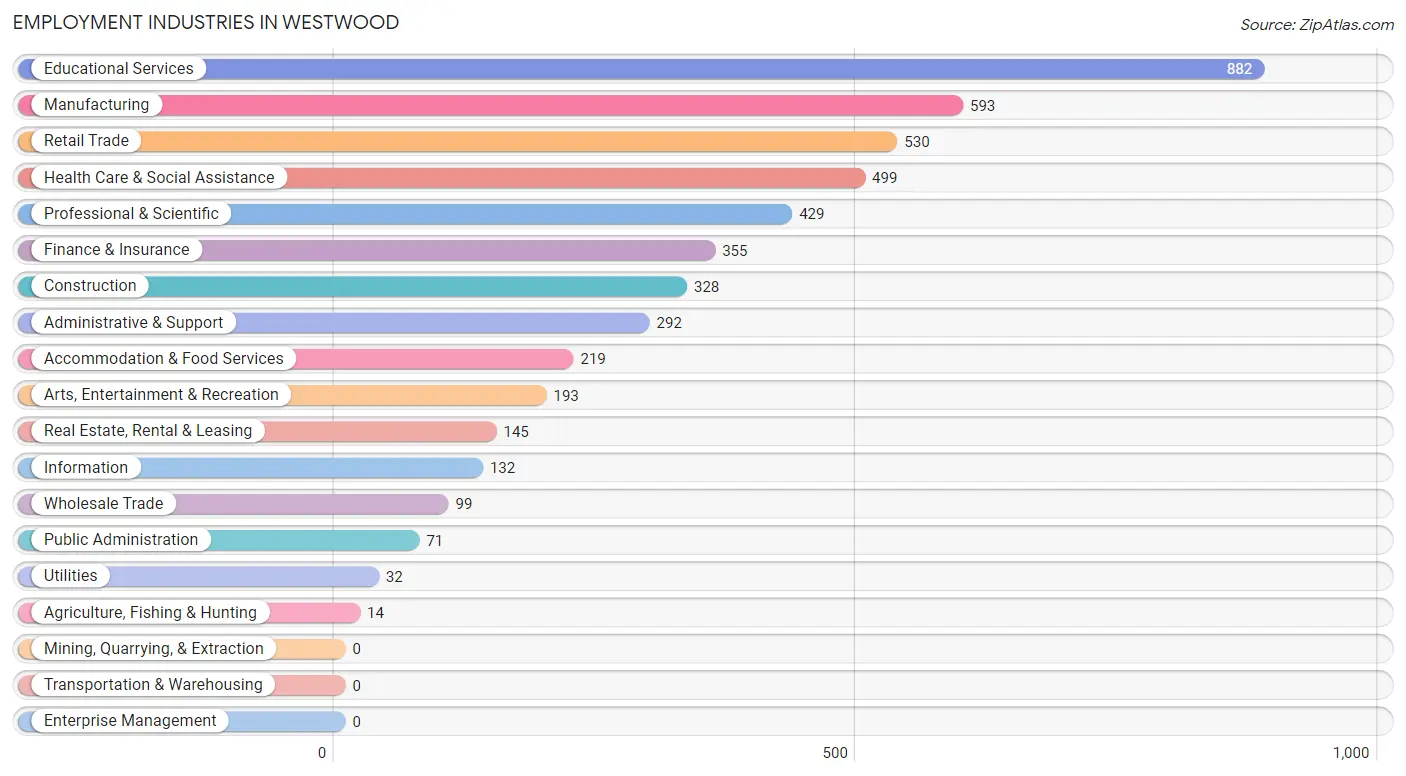
Employment Industries in Westwood
The major employment industries in Westwood include Educational Services (882 | 17.7%), Manufacturing (593 | 11.9%), Retail Trade (530 | 10.6%), Health Care & Social Assistance (499 | 10.0%), and Professional & Scientific (429 | 8.6%).
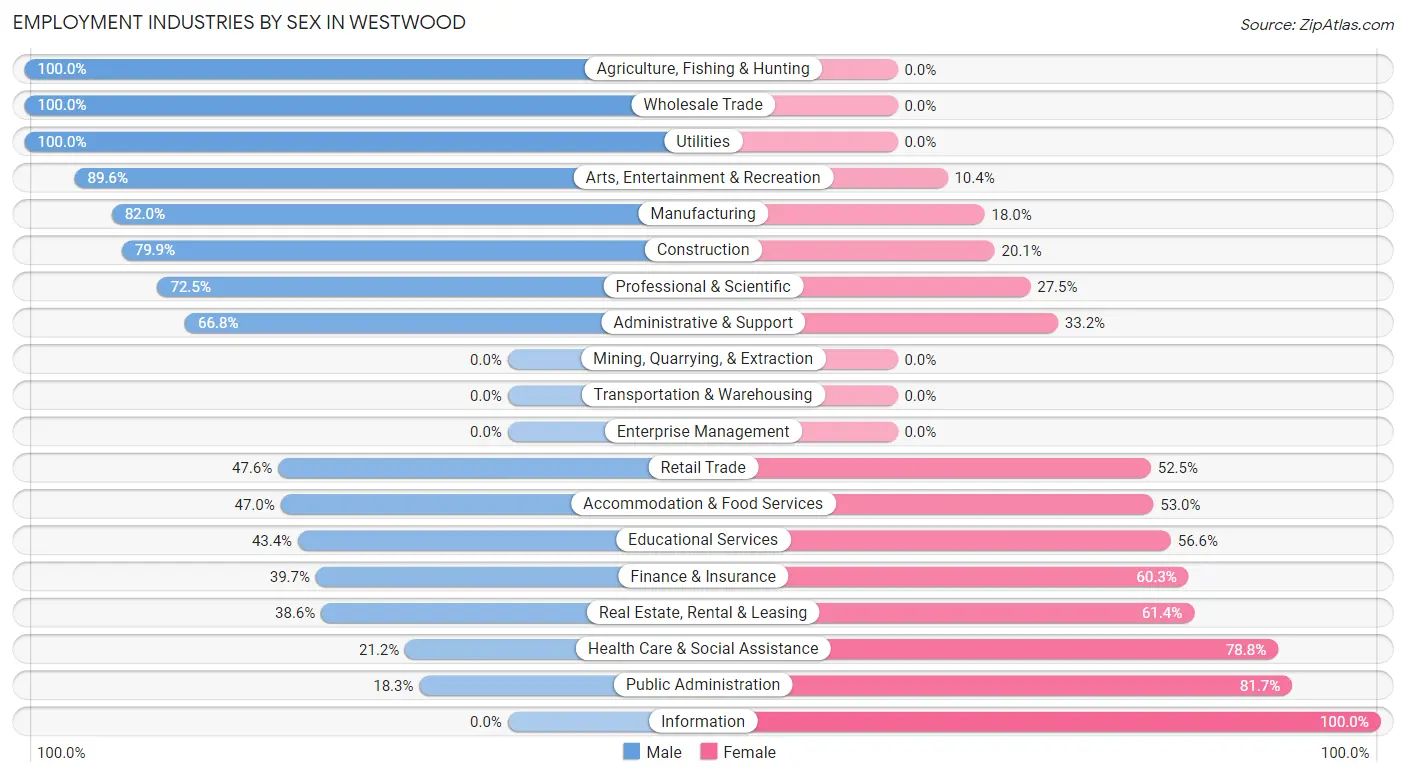
Employment Industries by Sex in Westwood
The Westwood industries that see more men than women are Agriculture, Fishing & Hunting (100.0%), Wholesale Trade (100.0%), and Utilities (100.0%), whereas the industries that tend to have a higher number of women are Information (100.0%), Public Administration (81.7%), and Health Care & Social Assistance (78.8%).
| Industry | Male | Female |
| Agriculture, Fishing & Hunting | 14 (100.0%) | 0 (0.0%) |
| Mining, Quarrying, & Extraction | 0 (0.0%) | 0 (0.0%) |
| Construction | 262 (79.9%) | 66 (20.1%) |
| Manufacturing | 486 (82.0%) | 107 (18.0%) |
| Wholesale Trade | 99 (100.0%) | 0 (0.0%) |
| Retail Trade | 252 (47.5%) | 278 (52.4%) |
| Transportation & Warehousing | 0 (0.0%) | 0 (0.0%) |
| Utilities | 32 (100.0%) | 0 (0.0%) |
| Information | 0 (0.0%) | 132 (100.0%) |
| Finance & Insurance | 141 (39.7%) | 214 (60.3%) |
| Real Estate, Rental & Leasing | 56 (38.6%) | 89 (61.4%) |
| Professional & Scientific | 311 (72.5%) | 118 (27.5%) |
| Enterprise Management | 0 (0.0%) | 0 (0.0%) |
| Administrative & Support | 195 (66.8%) | 97 (33.2%) |
| Educational Services | 383 (43.4%) | 499 (56.6%) |
| Health Care & Social Assistance | 106 (21.2%) | 393 (78.8%) |
| Arts, Entertainment & Recreation | 173 (89.6%) | 20 (10.4%) |
| Accommodation & Food Services | 103 (47.0%) | 116 (53.0%) |
| Public Administration | 13 (18.3%) | 58 (81.7%) |
| Total | 2,693 (53.9%) | 2,300 (46.1%) |
Education in Westwood
School Enrollment in Westwood
The most common levels of schooling among the 2,287 students in Westwood are college / undergraduate (877 | 38.4%), graduate / professional (342 | 14.9%), and elementary school (329 | 14.4%).
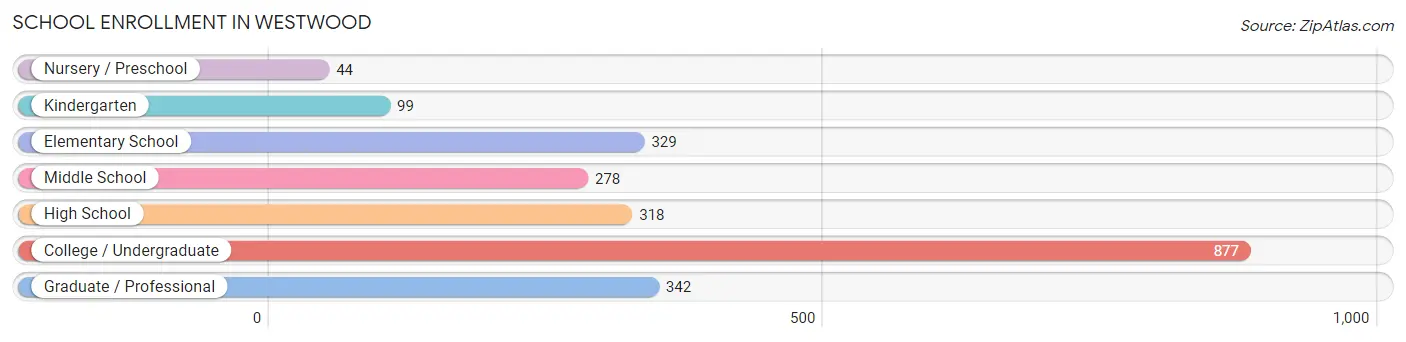
| School Level | # Students | % Students |
| Nursery / Preschool | 44 | 1.9% |
| Kindergarten | 99 | 4.3% |
| Elementary School | 329 | 14.4% |
| Middle School | 278 | 12.2% |
| High School | 318 | 13.9% |
| College / Undergraduate | 877 | 38.4% |
| Graduate / Professional | 342 | 14.9% |
| Total | 2,287 | 100.0% |
School Enrollment by Age by Funding Source in Westwood
Out of a total of 2,287 students who are enrolled in schools in Westwood, 167 (7.3%) attend a private institution, while the remaining 2,120 (92.7%) are enrolled in public schools. The age group of 35 years and over has the highest likelihood of being enrolled in private schools, with 28 (100.0% in the age bracket) enrolled. Conversely, the age group of 5 to 9 year old has the lowest likelihood of being enrolled in a private school, with 384 (100.0% in the age bracket) attending a public institution.
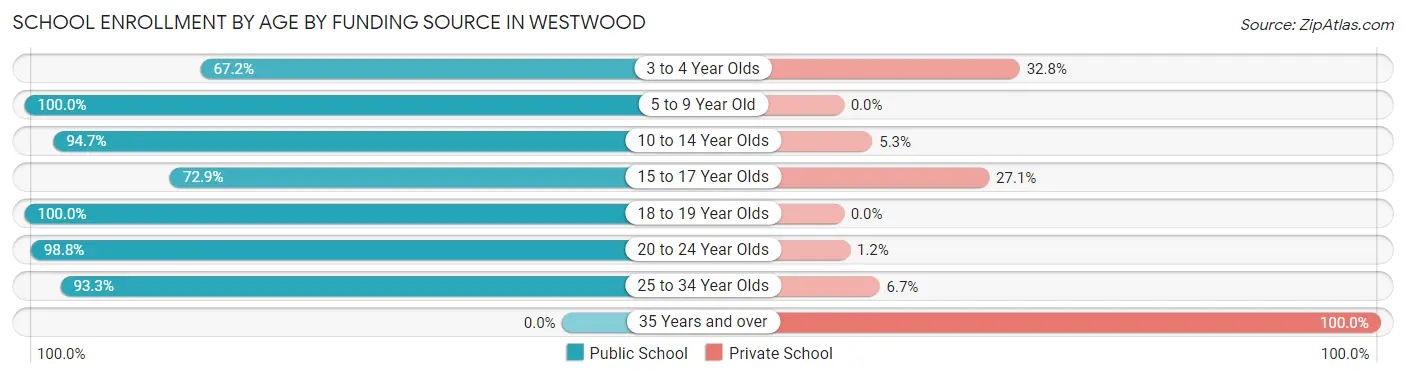
| Age Bracket | Public School | Private School |
| 3 to 4 Year Olds | 41 (67.2%) | 20 (32.8%) |
| 5 to 9 Year Old | 384 (100.0%) | 0 (0.0%) |
| 10 to 14 Year Olds | 320 (94.7%) | 18 (5.3%) |
| 15 to 17 Year Olds | 191 (72.9%) | 71 (27.1%) |
| 18 to 19 Year Olds | 139 (100.0%) | 0 (0.0%) |
| 20 to 24 Year Olds | 752 (98.8%) | 9 (1.2%) |
| 25 to 34 Year Olds | 293 (93.3%) | 21 (6.7%) |
| 35 Years and over | 0 (0.0%) | 28 (100.0%) |
| Total | 2,120 (92.7%) | 167 (7.3%) |
Educational Attainment by Field of Study in Westwood
Education (517 | 13.8%), business (489 | 13.0%), psychology (470 | 12.5%), literature & languages (258 | 6.9%), and science & technology (249 | 6.6%) are the most common fields of study among 3,753 individuals in Westwood who have obtained a bachelor's degree or higher.
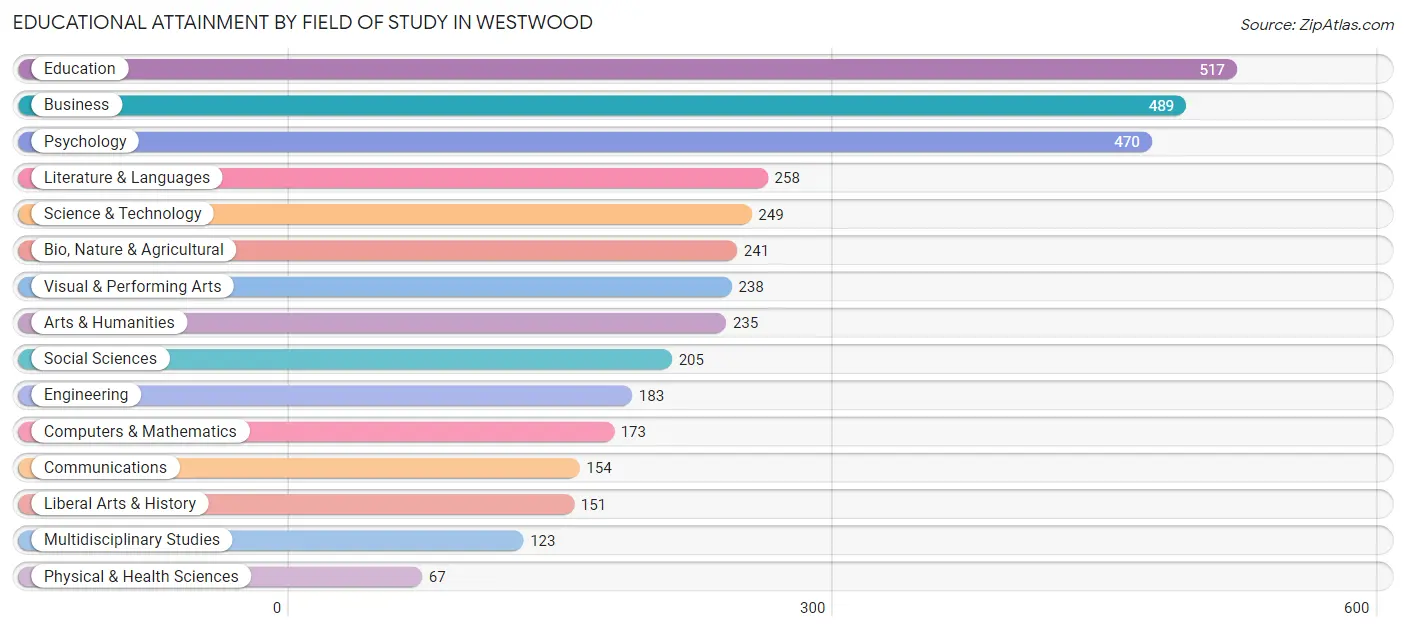
| Field of Study | # Graduates | % Graduates |
| Computers & Mathematics | 173 | 4.6% |
| Bio, Nature & Agricultural | 241 | 6.4% |
| Physical & Health Sciences | 67 | 1.8% |
| Psychology | 470 | 12.5% |
| Social Sciences | 205 | 5.5% |
| Engineering | 183 | 4.9% |
| Multidisciplinary Studies | 123 | 3.3% |
| Science & Technology | 249 | 6.6% |
| Business | 489 | 13.0% |
| Education | 517 | 13.8% |
| Literature & Languages | 258 | 6.9% |
| Liberal Arts & History | 151 | 4.0% |
| Visual & Performing Arts | 238 | 6.3% |
| Communications | 154 | 4.1% |
| Arts & Humanities | 235 | 6.3% |
| Total | 3,753 | 100.0% |
Transportation & Commute in Westwood
Vehicle Availability by Sex in Westwood
The most prevalent vehicle ownership categories in Westwood are males with 2 vehicles (1,082, accounting for 40.2%) and females with 2 vehicles (1,067, making up 49.7%).
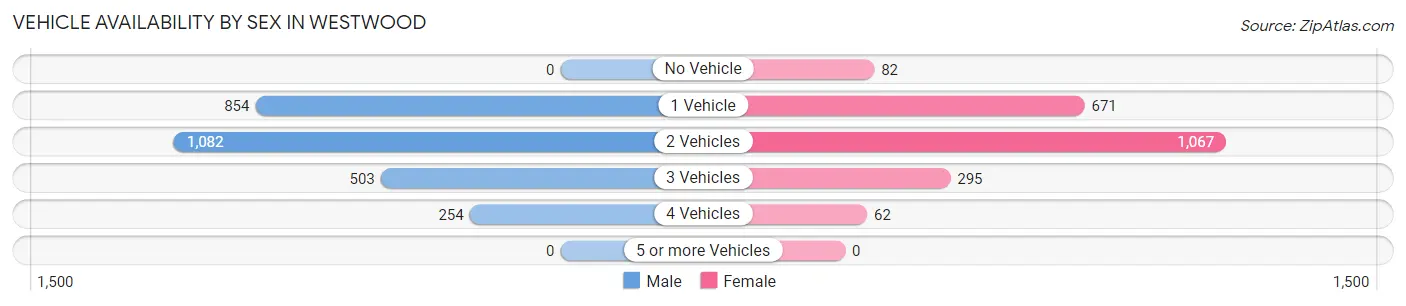
| Vehicles Available | Male | Female |
| No Vehicle | 0 (0.0%) | 82 (3.8%) |
| 1 Vehicle | 854 (31.7%) | 671 (30.8%) |
| 2 Vehicles | 1,082 (40.2%) | 1,067 (49.0%) |
| 3 Vehicles | 503 (18.7%) | 295 (13.6%) |
| 4 Vehicles | 254 (9.4%) | 62 (2.9%) |
| 5 or more Vehicles | 0 (0.0%) | 0 (0.0%) |
| Total | 2,693 (100.0%) | 2,177 (100.0%) |
Commute Time in Westwood
The most frequently occuring commute durations in Westwood are 15 to 19 minutes (851 commuters, 20.0%), 10 to 14 minutes (711 commuters, 16.7%), and 5 to 9 minutes (637 commuters, 15.0%).
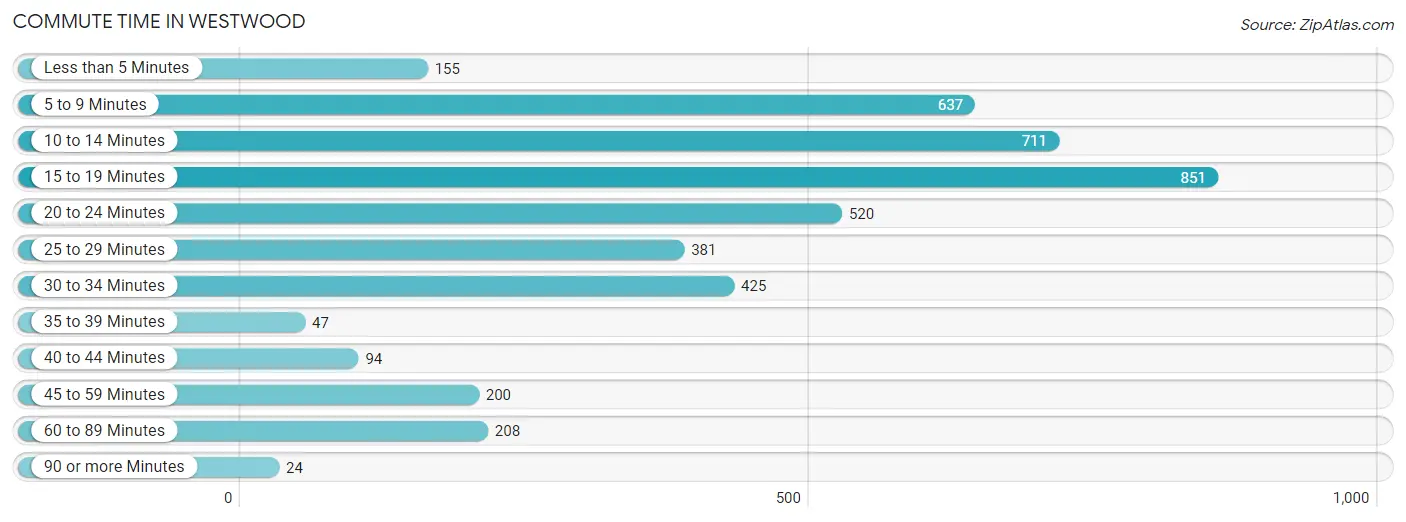
| Commute Time | # Commuters | % Commuters |
| Less than 5 Minutes | 155 | 3.6% |
| 5 to 9 Minutes | 637 | 15.0% |
| 10 to 14 Minutes | 711 | 16.7% |
| 15 to 19 Minutes | 851 | 20.0% |
| 20 to 24 Minutes | 520 | 12.2% |
| 25 to 29 Minutes | 381 | 9.0% |
| 30 to 34 Minutes | 425 | 10.0% |
| 35 to 39 Minutes | 47 | 1.1% |
| 40 to 44 Minutes | 94 | 2.2% |
| 45 to 59 Minutes | 200 | 4.7% |
| 60 to 89 Minutes | 208 | 4.9% |
| 90 or more Minutes | 24 | 0.6% |
Commute Time by Sex in Westwood
The most common commute times in Westwood are 15 to 19 minutes (558 commuters, 24.2%) for males and 10 to 14 minutes (520 commuters, 26.7%) for females.
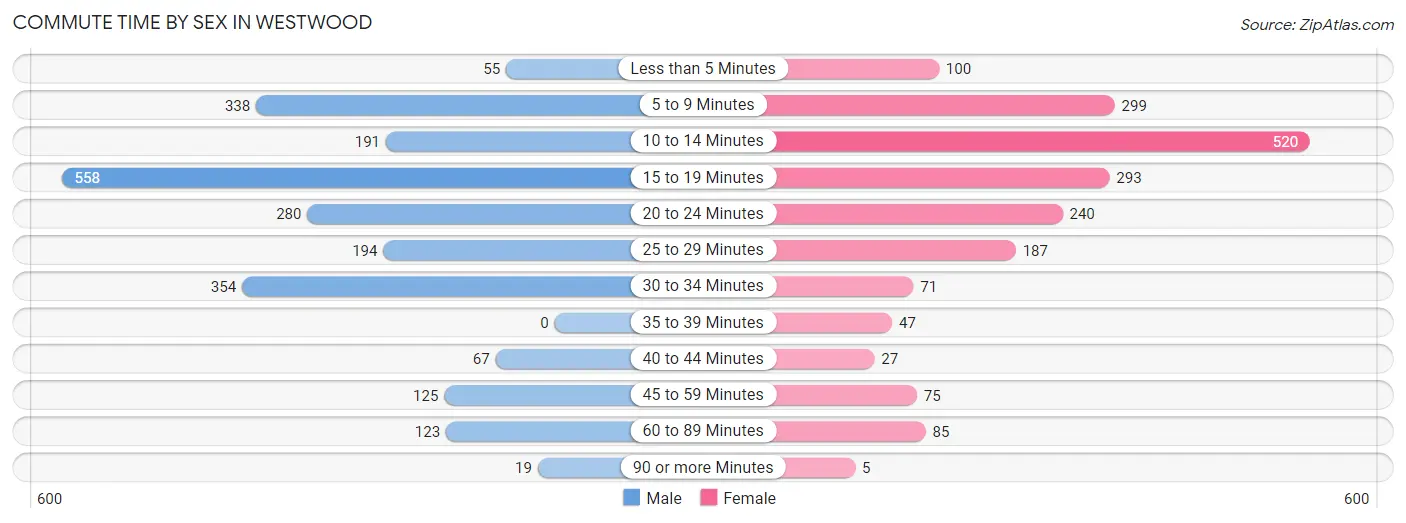
| Commute Time | Male | Female |
| Less than 5 Minutes | 55 (2.4%) | 100 (5.1%) |
| 5 to 9 Minutes | 338 (14.7%) | 299 (15.3%) |
| 10 to 14 Minutes | 191 (8.3%) | 520 (26.7%) |
| 15 to 19 Minutes | 558 (24.2%) | 293 (15.0%) |
| 20 to 24 Minutes | 280 (12.1%) | 240 (12.3%) |
| 25 to 29 Minutes | 194 (8.4%) | 187 (9.6%) |
| 30 to 34 Minutes | 354 (15.4%) | 71 (3.6%) |
| 35 to 39 Minutes | 0 (0.0%) | 47 (2.4%) |
| 40 to 44 Minutes | 67 (2.9%) | 27 (1.4%) |
| 45 to 59 Minutes | 125 (5.4%) | 75 (3.8%) |
| 60 to 89 Minutes | 123 (5.3%) | 85 (4.4%) |
| 90 or more Minutes | 19 (0.8%) | 5 (0.3%) |
Time of Departure to Work by Sex in Westwood
The most frequent times of departure to work in Westwood are 7:00 AM to 7:29 AM (439, 19.1%) for males and 8:00 AM to 8:29 AM (392, 20.1%) for females.
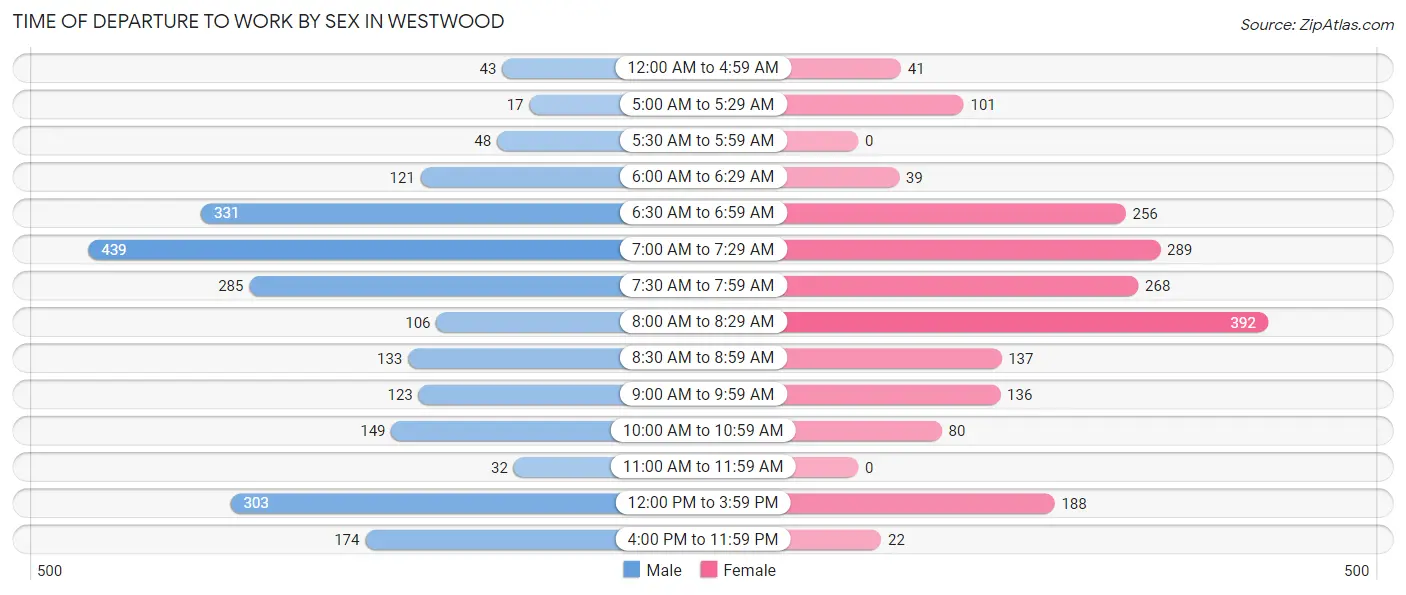
| Time of Departure | Male | Female |
| 12:00 AM to 4:59 AM | 43 (1.9%) | 41 (2.1%) |
| 5:00 AM to 5:29 AM | 17 (0.7%) | 101 (5.2%) |
| 5:30 AM to 5:59 AM | 48 (2.1%) | 0 (0.0%) |
| 6:00 AM to 6:29 AM | 121 (5.2%) | 39 (2.0%) |
| 6:30 AM to 6:59 AM | 331 (14.4%) | 256 (13.1%) |
| 7:00 AM to 7:29 AM | 439 (19.1%) | 289 (14.8%) |
| 7:30 AM to 7:59 AM | 285 (12.4%) | 268 (13.8%) |
| 8:00 AM to 8:29 AM | 106 (4.6%) | 392 (20.1%) |
| 8:30 AM to 8:59 AM | 133 (5.8%) | 137 (7.0%) |
| 9:00 AM to 9:59 AM | 123 (5.3%) | 136 (7.0%) |
| 10:00 AM to 10:59 AM | 149 (6.5%) | 80 (4.1%) |
| 11:00 AM to 11:59 AM | 32 (1.4%) | 0 (0.0%) |
| 12:00 PM to 3:59 PM | 303 (13.2%) | 188 (9.7%) |
| 4:00 PM to 11:59 PM | 174 (7.5%) | 22 (1.1%) |
| Total | 2,304 (100.0%) | 1,949 (100.0%) |
Housing Occupancy in Westwood
Occupancy by Ownership in Westwood
Of the total 4,413 dwellings in Westwood, owner-occupied units account for 2,550 (57.8%), while renter-occupied units make up 1,863 (42.2%).
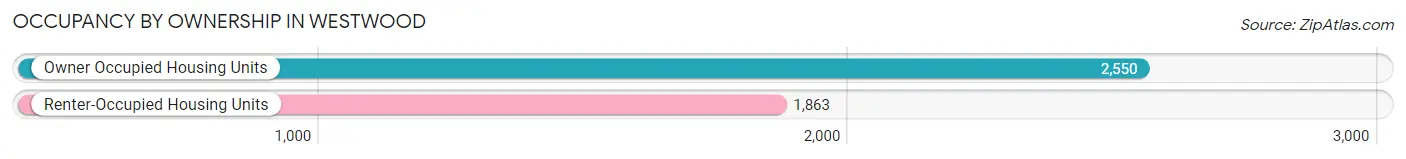
| Occupancy | # Housing Units | % Housing Units |
| Owner Occupied Housing Units | 2,550 | 57.8% |
| Renter-Occupied Housing Units | 1,863 | 42.2% |
| Total Occupied Housing Units | 4,413 | 100.0% |
Occupancy by Household Size in Westwood
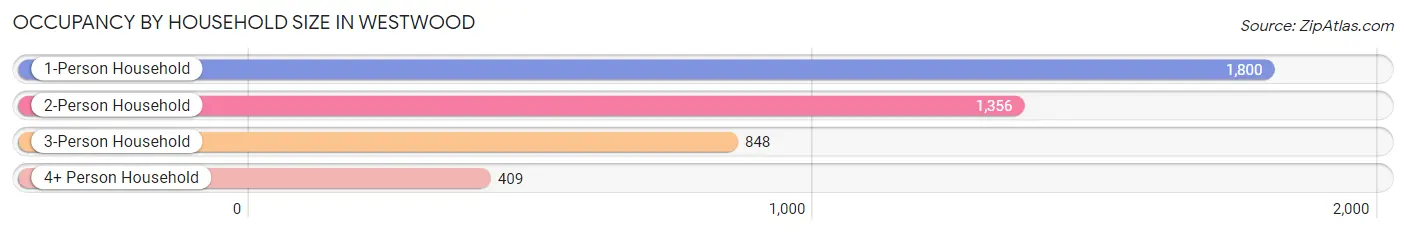
| Household Size | # Housing Units | % Housing Units |
| 1-Person Household | 1,800 | 40.8% |
| 2-Person Household | 1,356 | 30.7% |
| 3-Person Household | 848 | 19.2% |
| 4+ Person Household | 409 | 9.3% |
| Total Housing Units | 4,413 | 100.0% |
Occupancy by Ownership by Household Size in Westwood
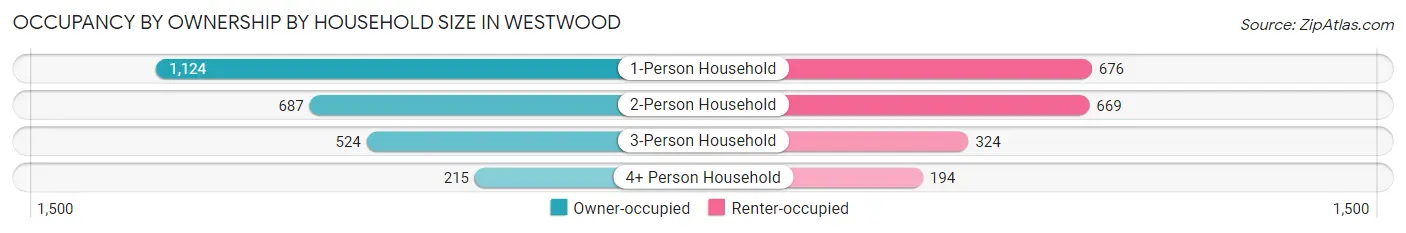
| Household Size | Owner-occupied | Renter-occupied |
| 1-Person Household | 1,124 (62.4%) | 676 (37.6%) |
| 2-Person Household | 687 (50.7%) | 669 (49.3%) |
| 3-Person Household | 524 (61.8%) | 324 (38.2%) |
| 4+ Person Household | 215 (52.6%) | 194 (47.4%) |
| Total Housing Units | 2,550 (57.8%) | 1,863 (42.2%) |
Occupancy by Educational Attainment in Westwood
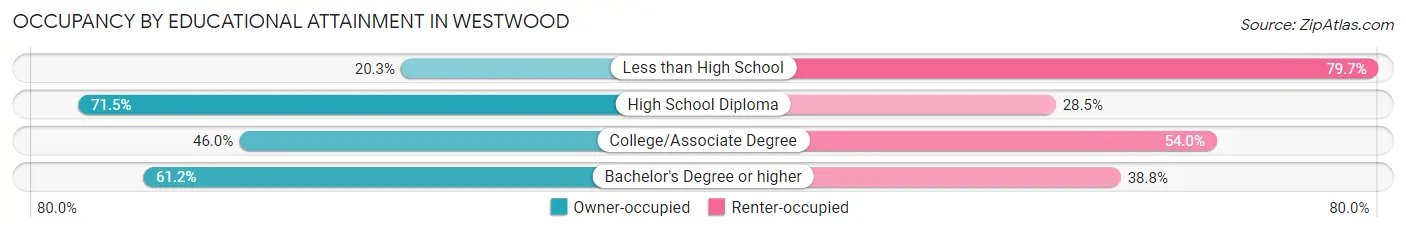
| Household Size | Owner-occupied | Renter-occupied |
| Less than High School | 25 (20.3%) | 98 (79.7%) |
| High School Diploma | 442 (71.5%) | 176 (28.5%) |
| College/Associate Degree | 497 (46.0%) | 584 (54.0%) |
| Bachelor's Degree or higher | 1,586 (61.2%) | 1,005 (38.8%) |
Occupancy by Age of Householder in Westwood
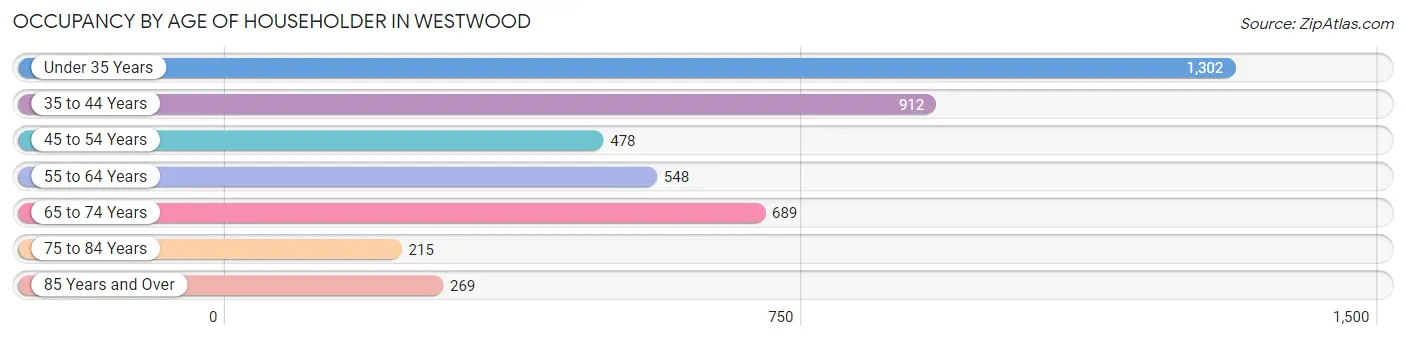
| Age Bracket | # Households | % Households |
| Under 35 Years | 1,302 | 29.5% |
| 35 to 44 Years | 912 | 20.7% |
| 45 to 54 Years | 478 | 10.8% |
| 55 to 64 Years | 548 | 12.4% |
| 65 to 74 Years | 689 | 15.6% |
| 75 to 84 Years | 215 | 4.9% |
| 85 Years and Over | 269 | 6.1% |
| Total | 4,413 | 100.0% |
Housing Finances in Westwood
Median Income by Occupancy in Westwood
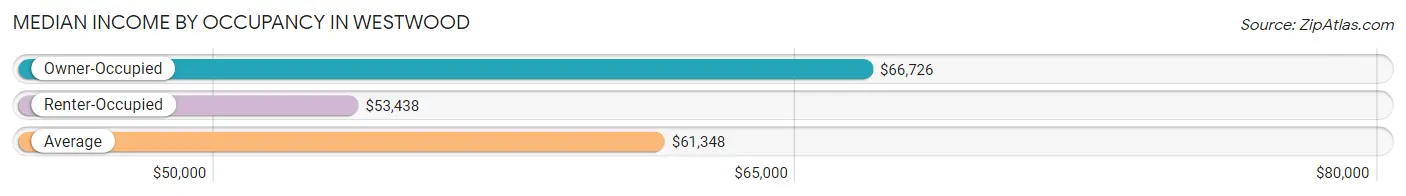
| Occupancy Type | # Households | Median Income |
| Owner-Occupied | 2,550 (57.8%) | $66,726 |
| Renter-Occupied | 1,863 (42.2%) | $53,438 |
| Average | 4,413 (100.0%) | $61,348 |
Occupancy by Householder Income Bracket in Westwood
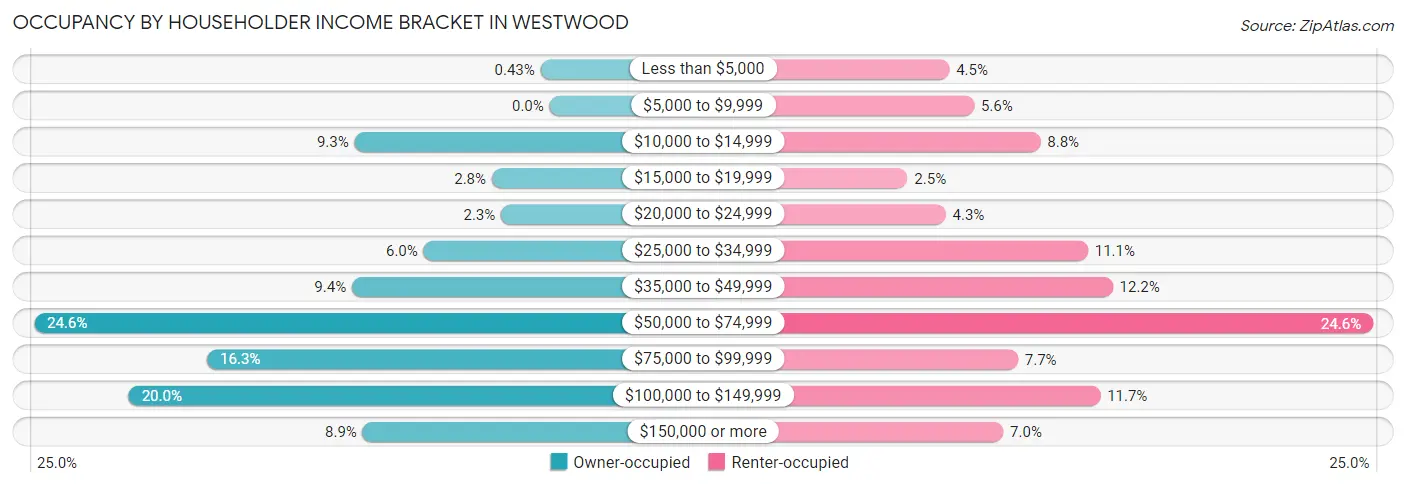
| Income Bracket | Owner-occupied | Renter-occupied |
| Less than $5,000 | 11 (0.4%) | 83 (4.5%) |
| $5,000 to $9,999 | 0 (0.0%) | 105 (5.6%) |
| $10,000 to $14,999 | 237 (9.3%) | 164 (8.8%) |
| $15,000 to $19,999 | 70 (2.8%) | 46 (2.5%) |
| $20,000 to $24,999 | 59 (2.3%) | 80 (4.3%) |
| $25,000 to $34,999 | 153 (6.0%) | 206 (11.1%) |
| $35,000 to $49,999 | 240 (9.4%) | 228 (12.2%) |
| $50,000 to $74,999 | 626 (24.5%) | 459 (24.6%) |
| $75,000 to $99,999 | 416 (16.3%) | 144 (7.7%) |
| $100,000 to $149,999 | 511 (20.0%) | 217 (11.7%) |
| $150,000 or more | 227 (8.9%) | 131 (7.0%) |
| Total | 2,550 (100.0%) | 1,863 (100.0%) |
Monthly Housing Cost Tiers in Westwood
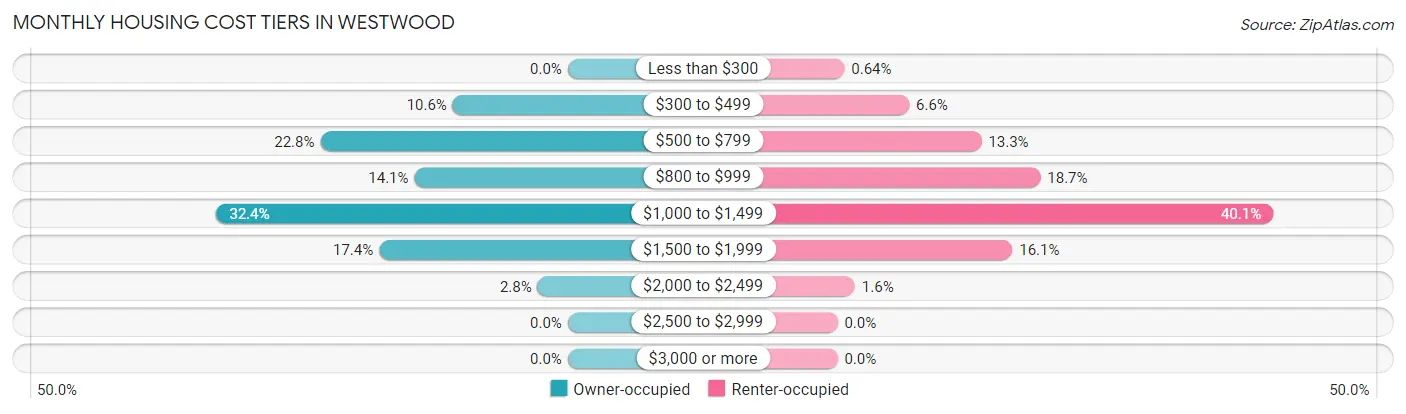
| Monthly Cost | Owner-occupied | Renter-occupied |
| Less than $300 | 0 (0.0%) | 12 (0.6%) |
| $300 to $499 | 270 (10.6%) | 123 (6.6%) |
| $500 to $799 | 581 (22.8%) | 247 (13.3%) |
| $800 to $999 | 360 (14.1%) | 348 (18.7%) |
| $1,000 to $1,499 | 825 (32.4%) | 747 (40.1%) |
| $1,500 to $1,999 | 443 (17.4%) | 300 (16.1%) |
| $2,000 to $2,499 | 71 (2.8%) | 30 (1.6%) |
| $2,500 to $2,999 | 0 (0.0%) | 0 (0.0%) |
| $3,000 or more | 0 (0.0%) | 0 (0.0%) |
| Total | 2,550 (100.0%) | 1,863 (100.0%) |
Physical Housing Characteristics in Westwood
Housing Structures in Westwood
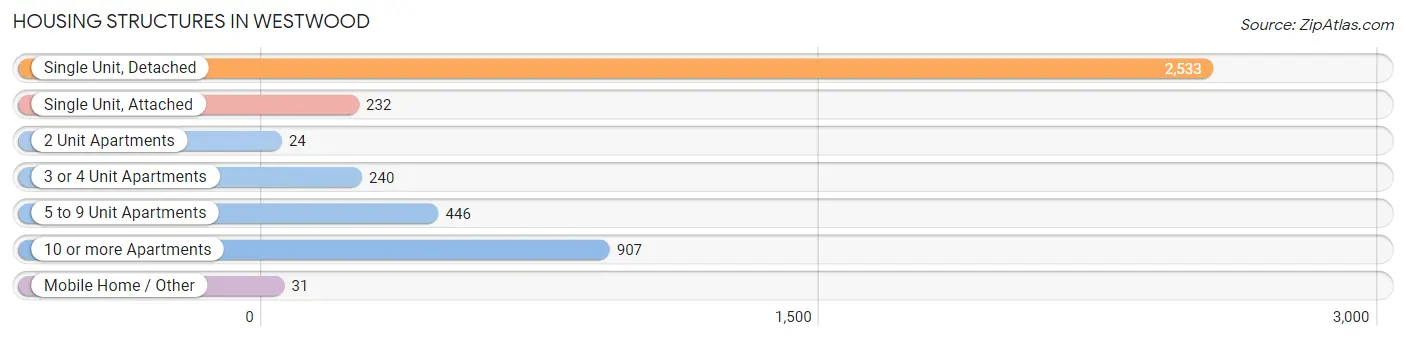
| Structure Type | # Housing Units | % Housing Units |
| Single Unit, Detached | 2,533 | 57.4% |
| Single Unit, Attached | 232 | 5.3% |
| 2 Unit Apartments | 24 | 0.5% |
| 3 or 4 Unit Apartments | 240 | 5.4% |
| 5 to 9 Unit Apartments | 446 | 10.1% |
| 10 or more Apartments | 907 | 20.5% |
| Mobile Home / Other | 31 | 0.7% |
| Total | 4,413 | 100.0% |
Housing Structures by Occupancy in Westwood
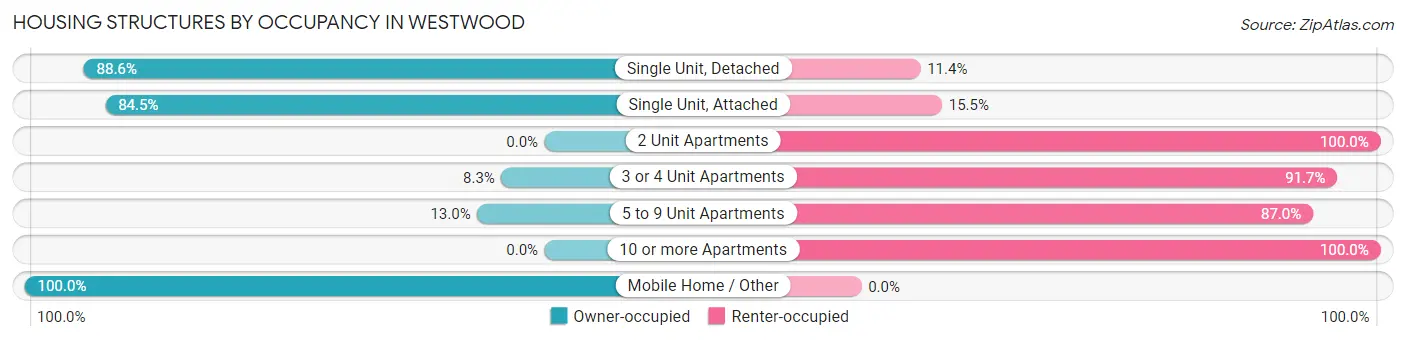
| Structure Type | Owner-occupied | Renter-occupied |
| Single Unit, Detached | 2,245 (88.6%) | 288 (11.4%) |
| Single Unit, Attached | 196 (84.5%) | 36 (15.5%) |
| 2 Unit Apartments | 0 (0.0%) | 24 (100.0%) |
| 3 or 4 Unit Apartments | 20 (8.3%) | 220 (91.7%) |
| 5 to 9 Unit Apartments | 58 (13.0%) | 388 (87.0%) |
| 10 or more Apartments | 0 (0.0%) | 907 (100.0%) |
| Mobile Home / Other | 31 (100.0%) | 0 (0.0%) |
| Total | 2,550 (57.8%) | 1,863 (42.2%) |
Housing Structures by Number of Rooms in Westwood
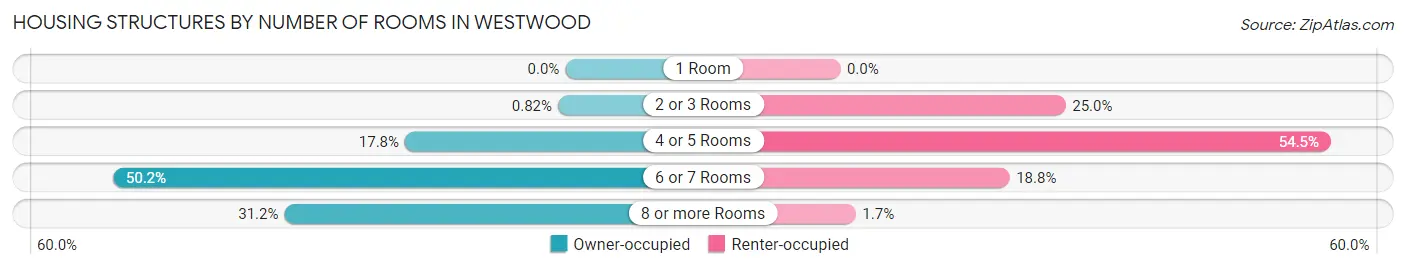
| Number of Rooms | Owner-occupied | Renter-occupied |
| 1 Room | 0 (0.0%) | 0 (0.0%) |
| 2 or 3 Rooms | 21 (0.8%) | 466 (25.0%) |
| 4 or 5 Rooms | 454 (17.8%) | 1,015 (54.5%) |
| 6 or 7 Rooms | 1,280 (50.2%) | 350 (18.8%) |
| 8 or more Rooms | 795 (31.2%) | 32 (1.7%) |
| Total | 2,550 (100.0%) | 1,863 (100.0%) |
Housing Structure by Heating Type in Westwood
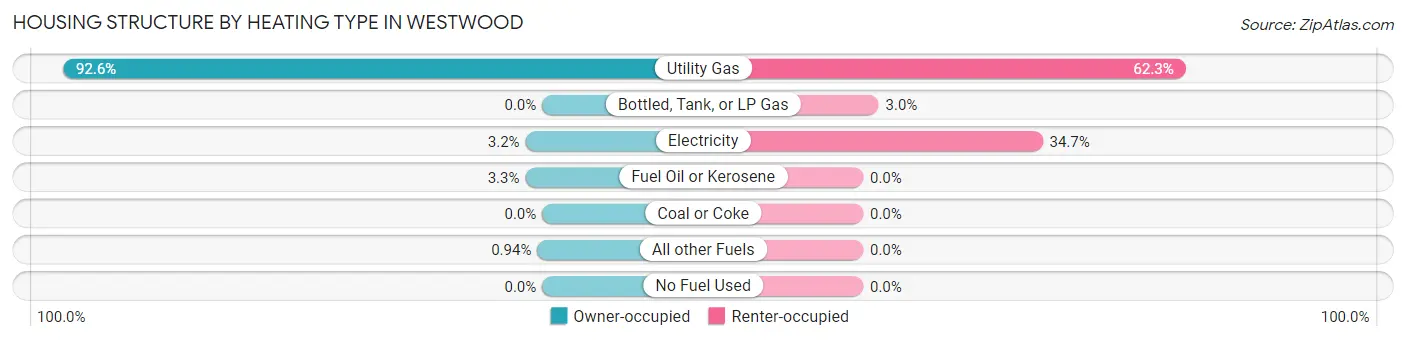
| Heating Type | Owner-occupied | Renter-occupied |
| Utility Gas | 2,361 (92.6%) | 1,161 (62.3%) |
| Bottled, Tank, or LP Gas | 0 (0.0%) | 56 (3.0%) |
| Electricity | 82 (3.2%) | 646 (34.7%) |
| Fuel Oil or Kerosene | 83 (3.3%) | 0 (0.0%) |
| Coal or Coke | 0 (0.0%) | 0 (0.0%) |
| All other Fuels | 24 (0.9%) | 0 (0.0%) |
| No Fuel Used | 0 (0.0%) | 0 (0.0%) |
| Total | 2,550 (100.0%) | 1,863 (100.0%) |
Household Vehicle Usage in Westwood
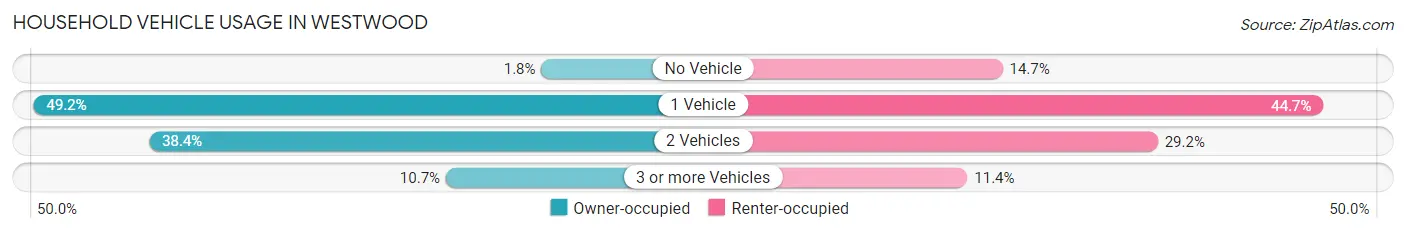
| Vehicles per Household | Owner-occupied | Renter-occupied |
| No Vehicle | 45 (1.8%) | 274 (14.7%) |
| 1 Vehicle | 1,254 (49.2%) | 832 (44.7%) |
| 2 Vehicles | 979 (38.4%) | 544 (29.2%) |
| 3 or more Vehicles | 272 (10.7%) | 213 (11.4%) |
| Total | 2,550 (100.0%) | 1,863 (100.0%) |
Real Estate & Mortgages in Westwood
Real Estate and Mortgage Overview in Westwood
| Characteristic | Without Mortgage | With Mortgage |
| Housing Units | 858 | 1,692 |
| Median Property Value | $181,700 | $166,100 |
| Median Household Income | $54,194 | $159 |
| Monthly Housing Costs | $573 | $0 |
| Real Estate Taxes | $2,972 | $102 |
Property Value by Mortgage Status in Westwood
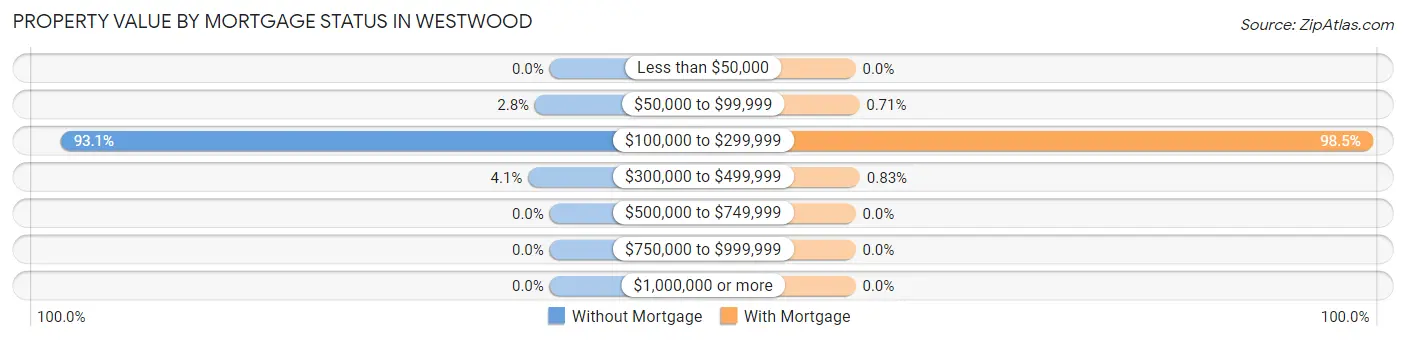
| Property Value | Without Mortgage | With Mortgage |
| Less than $50,000 | 0 (0.0%) | 0 (0.0%) |
| $50,000 to $99,999 | 24 (2.8%) | 12 (0.7%) |
| $100,000 to $299,999 | 799 (93.1%) | 1,666 (98.5%) |
| $300,000 to $499,999 | 35 (4.1%) | 14 (0.8%) |
| $500,000 to $749,999 | 0 (0.0%) | 0 (0.0%) |
| $750,000 to $999,999 | 0 (0.0%) | 0 (0.0%) |
| $1,000,000 or more | 0 (0.0%) | 0 (0.0%) |
| Total | 858 (100.0%) | 1,692 (100.0%) |
Household Income by Mortgage Status in Westwood
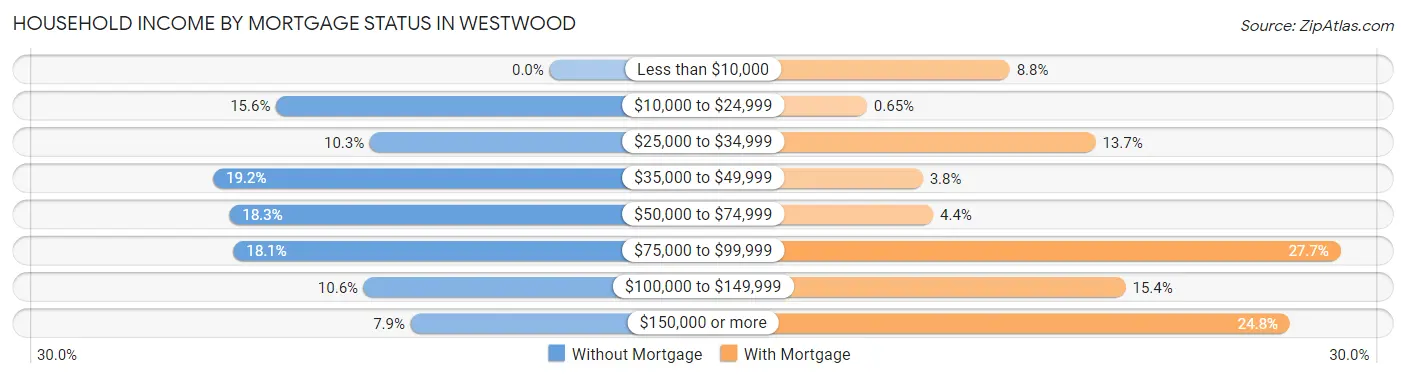
| Household Income | Without Mortgage | With Mortgage |
| Less than $10,000 | 0 (0.0%) | 149 (8.8%) |
| $10,000 to $24,999 | 134 (15.6%) | 11 (0.6%) |
| $25,000 to $34,999 | 88 (10.3%) | 232 (13.7%) |
| $35,000 to $49,999 | 165 (19.2%) | 65 (3.8%) |
| $50,000 to $74,999 | 157 (18.3%) | 75 (4.4%) |
| $75,000 to $99,999 | 155 (18.1%) | 469 (27.7%) |
| $100,000 to $149,999 | 91 (10.6%) | 261 (15.4%) |
| $150,000 or more | 68 (7.9%) | 420 (24.8%) |
| Total | 858 (100.0%) | 1,692 (100.0%) |
Property Value to Household Income Ratio in Westwood
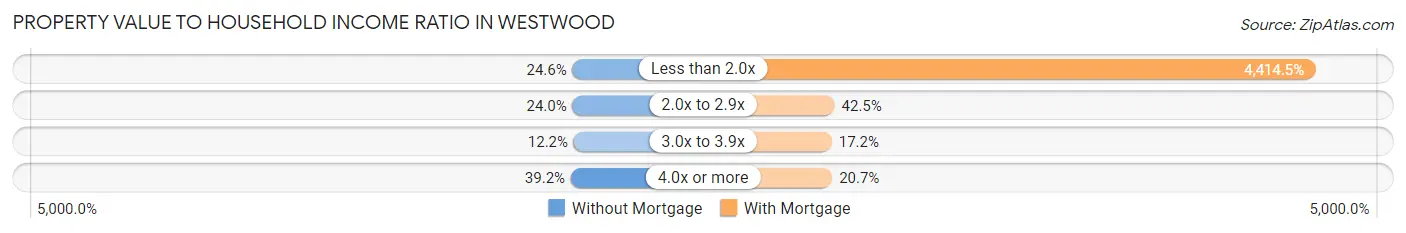
| Value-to-Income Ratio | Without Mortgage | With Mortgage |
| Less than 2.0x | 211 (24.6%) | 74,694 (4,414.5%) |
| 2.0x to 2.9x | 206 (24.0%) | 719 (42.5%) |
| 3.0x to 3.9x | 105 (12.2%) | 291 (17.2%) |
| 4.0x or more | 336 (39.2%) | 351 (20.7%) |
| Total | 858 (100.0%) | 1,692 (100.0%) |
Real Estate Taxes by Mortgage Status in Westwood
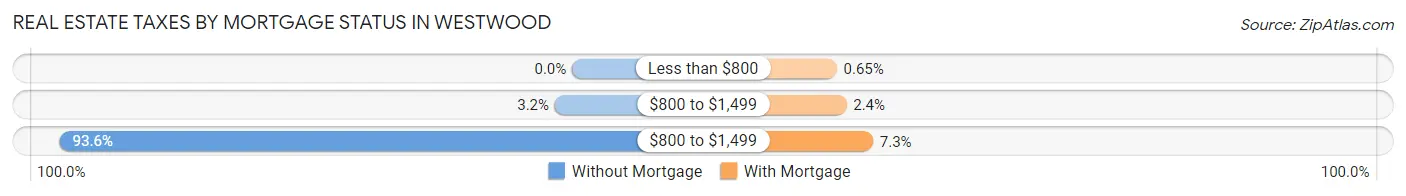
| Property Taxes | Without Mortgage | With Mortgage |
| Less than $800 | 0 (0.0%) | 11 (0.6%) |
| $800 to $1,499 | 27 (3.2%) | 41 (2.4%) |
| $800 to $1,499 | 803 (93.6%) | 123 (7.3%) |
| Total | 858 (100.0%) | 1,692 (100.0%) |
Health & Disability in Westwood
Health Insurance Coverage by Age in Westwood
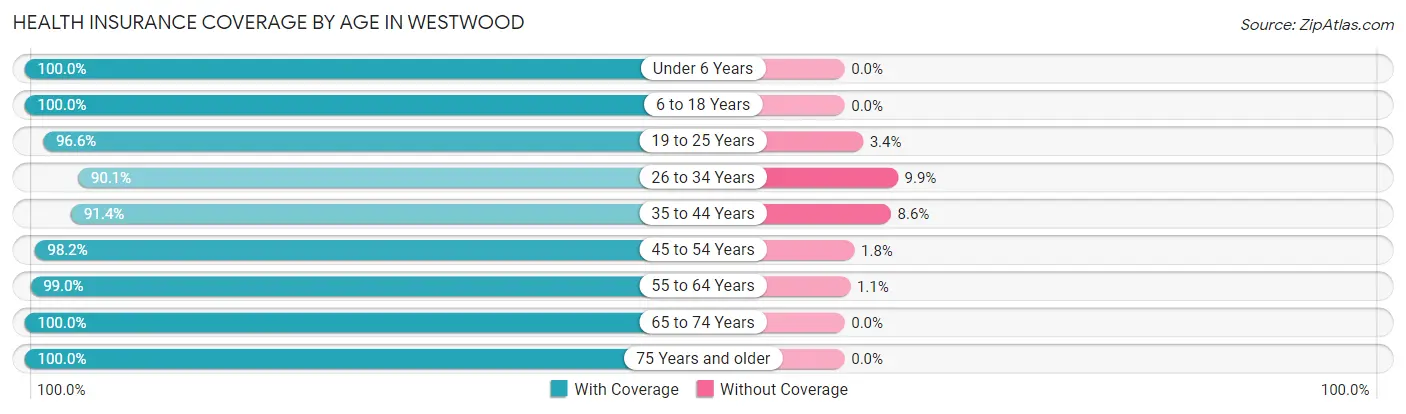
| Age Bracket | With Coverage | Without Coverage |
| Under 6 Years | 414 (100.0%) | 0 (0.0%) |
| 6 to 18 Years | 1,001 (100.0%) | 0 (0.0%) |
| 19 to 25 Years | 1,743 (96.6%) | 62 (3.4%) |
| 26 to 34 Years | 1,187 (90.1%) | 131 (9.9%) |
| 35 to 44 Years | 1,333 (91.4%) | 126 (8.6%) |
| 45 to 54 Years | 752 (98.2%) | 14 (1.8%) |
| 55 to 64 Years | 753 (99.0%) | 8 (1.1%) |
| 65 to 74 Years | 926 (100.0%) | 0 (0.0%) |
| 75 Years and older | 572 (100.0%) | 0 (0.0%) |
| Total | 8,681 (96.2%) | 341 (3.8%) |
Health Insurance Coverage by Citizenship Status in Westwood
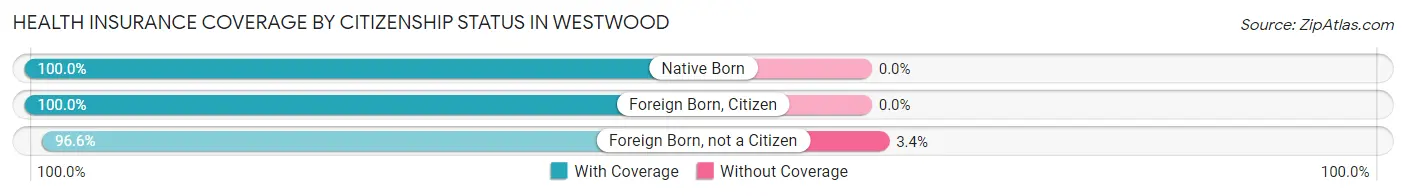
| Citizenship Status | With Coverage | Without Coverage |
| Native Born | 414 (100.0%) | 0 (0.0%) |
| Foreign Born, Citizen | 1,001 (100.0%) | 0 (0.0%) |
| Foreign Born, not a Citizen | 1,743 (96.6%) | 62 (3.4%) |
Health Insurance Coverage by Household Income in Westwood
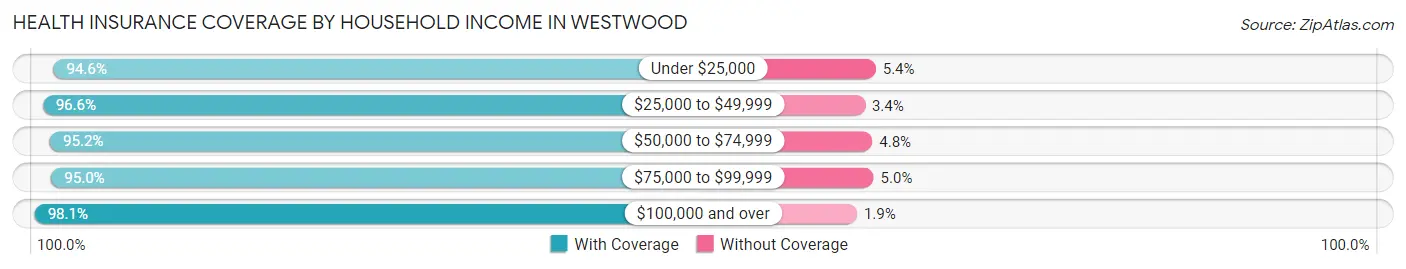
| Household Income | With Coverage | Without Coverage |
| Under $25,000 | 1,079 (94.6%) | 62 (5.4%) |
| $25,000 to $49,999 | 1,589 (96.6%) | 56 (3.4%) |
| $50,000 to $74,999 | 1,930 (95.2%) | 97 (4.8%) |
| $75,000 to $99,999 | 1,396 (95.0%) | 74 (5.0%) |
| $100,000 and over | 2,681 (98.1%) | 52 (1.9%) |
Public vs Private Health Insurance Coverage by Age in Westwood
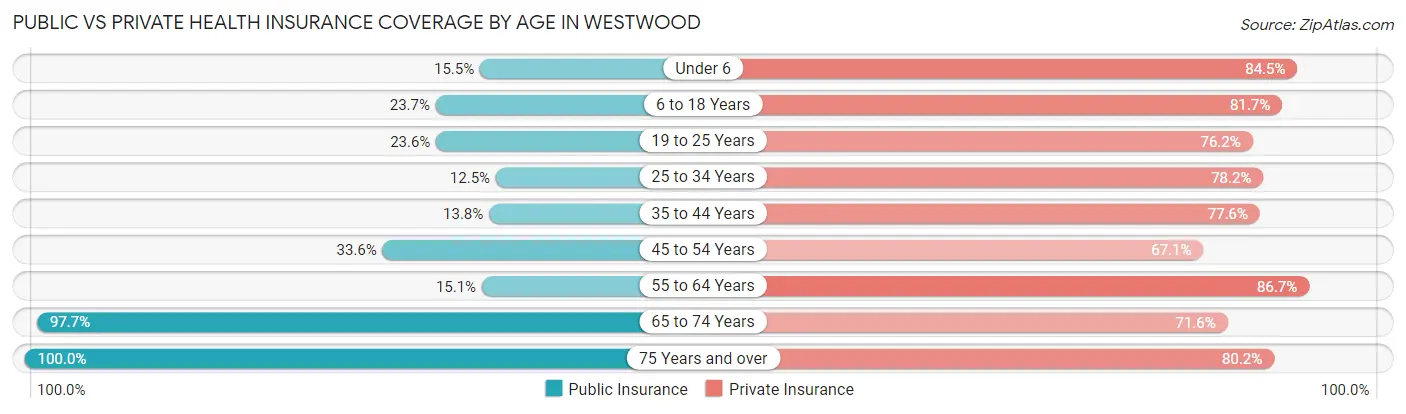
| Age Bracket | Public Insurance | Private Insurance |
| Under 6 | 64 (15.5%) | 350 (84.5%) |
| 6 to 18 Years | 237 (23.7%) | 818 (81.7%) |
| 19 to 25 Years | 426 (23.6%) | 1,376 (76.2%) |
| 25 to 34 Years | 165 (12.5%) | 1,031 (78.2%) |
| 35 to 44 Years | 201 (13.8%) | 1,132 (77.6%) |
| 45 to 54 Years | 257 (33.6%) | 514 (67.1%) |
| 55 to 64 Years | 115 (15.1%) | 660 (86.7%) |
| 65 to 74 Years | 905 (97.7%) | 663 (71.6%) |
| 75 Years and over | 572 (100.0%) | 459 (80.2%) |
| Total | 2,942 (32.6%) | 7,003 (77.6%) |
Disability Status by Sex by Age in Westwood
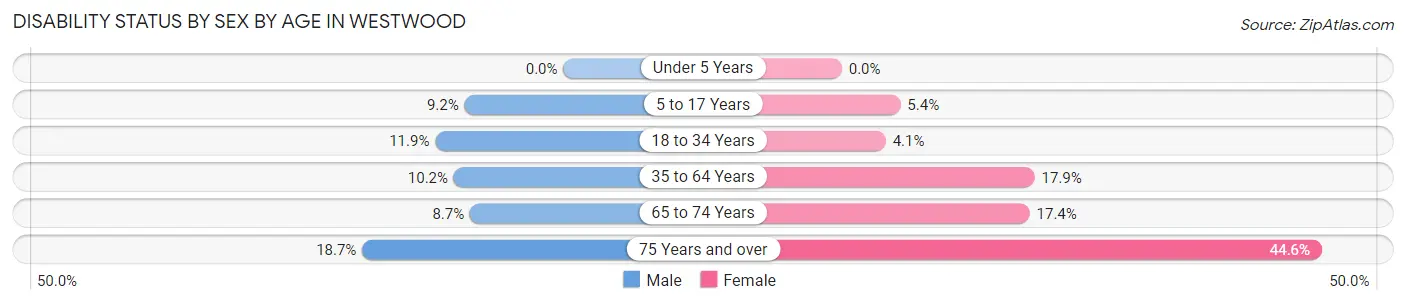
| Age Bracket | Male | Female |
| Under 5 Years | 0 (0.0%) | 0 (0.0%) |
| 5 to 17 Years | 52 (9.2%) | 24 (5.4%) |
| 18 to 34 Years | 167 (11.9%) | 71 (4.1%) |
| 35 to 64 Years | 175 (10.2%) | 226 (17.9%) |
| 65 to 74 Years | 29 (8.7%) | 103 (17.4%) |
| 75 Years and over | 28 (18.7%) | 188 (44.6%) |
Disability Class by Sex by Age in Westwood
Disability Class: Hearing Difficulty
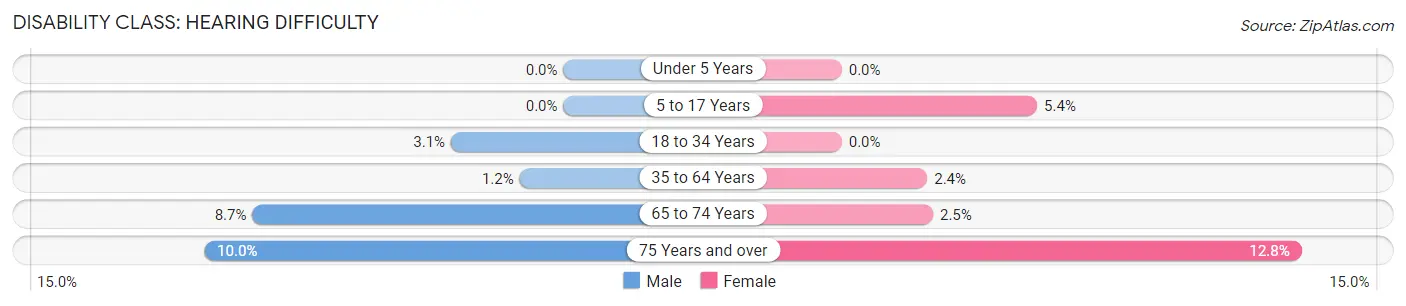
| Age Bracket | Male | Female |
| Under 5 Years | 0 (0.0%) | 0 (0.0%) |
| 5 to 17 Years | 0 (0.0%) | 24 (5.4%) |
| 18 to 34 Years | 44 (3.1%) | 0 (0.0%) |
| 35 to 64 Years | 21 (1.2%) | 30 (2.4%) |
| 65 to 74 Years | 29 (8.7%) | 15 (2.5%) |
| 75 Years and over | 15 (10.0%) | 54 (12.8%) |
Disability Class: Vision Difficulty
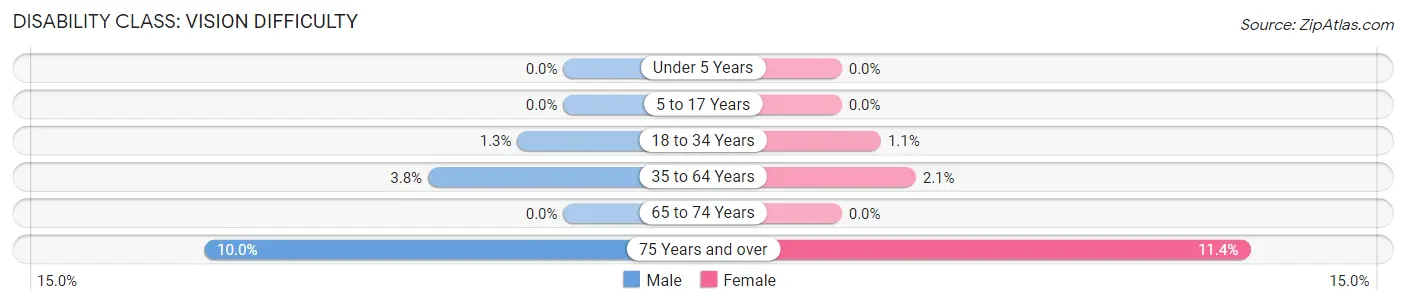
| Age Bracket | Male | Female |
| Under 5 Years | 0 (0.0%) | 0 (0.0%) |
| 5 to 17 Years | 0 (0.0%) | 0 (0.0%) |
| 18 to 34 Years | 18 (1.3%) | 19 (1.1%) |
| 35 to 64 Years | 65 (3.8%) | 26 (2.1%) |
| 65 to 74 Years | 0 (0.0%) | 0 (0.0%) |
| 75 Years and over | 15 (10.0%) | 48 (11.4%) |
Disability Class: Cognitive Difficulty
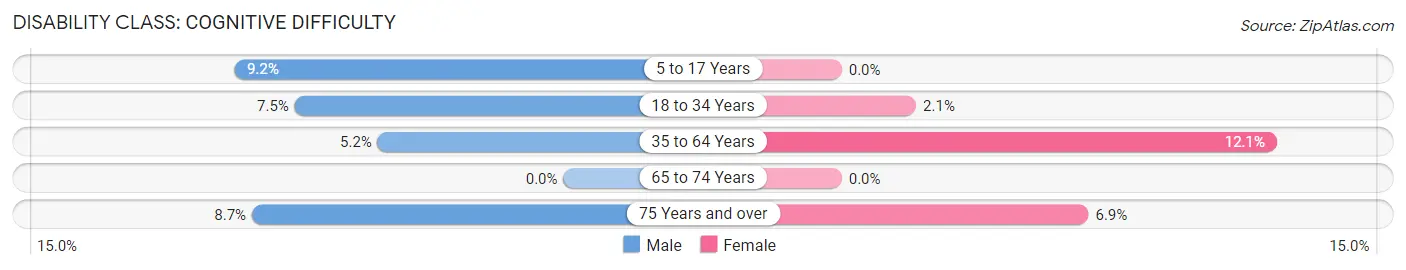
| Age Bracket | Male | Female |
| 5 to 17 Years | 52 (9.2%) | 0 (0.0%) |
| 18 to 34 Years | 105 (7.5%) | 36 (2.1%) |
| 35 to 64 Years | 89 (5.2%) | 153 (12.1%) |
| 65 to 74 Years | 0 (0.0%) | 0 (0.0%) |
| 75 Years and over | 13 (8.7%) | 29 (6.9%) |
Disability Class: Ambulatory Difficulty
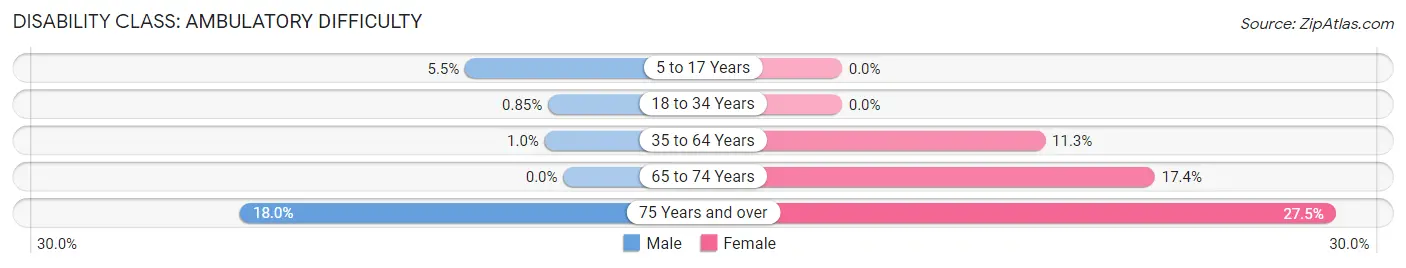
| Age Bracket | Male | Female |
| 5 to 17 Years | 31 (5.5%) | 0 (0.0%) |
| 18 to 34 Years | 12 (0.9%) | 0 (0.0%) |
| 35 to 64 Years | 18 (1.0%) | 143 (11.3%) |
| 65 to 74 Years | 0 (0.0%) | 103 (17.4%) |
| 75 Years and over | 27 (18.0%) | 116 (27.5%) |
Disability Class: Self-Care Difficulty
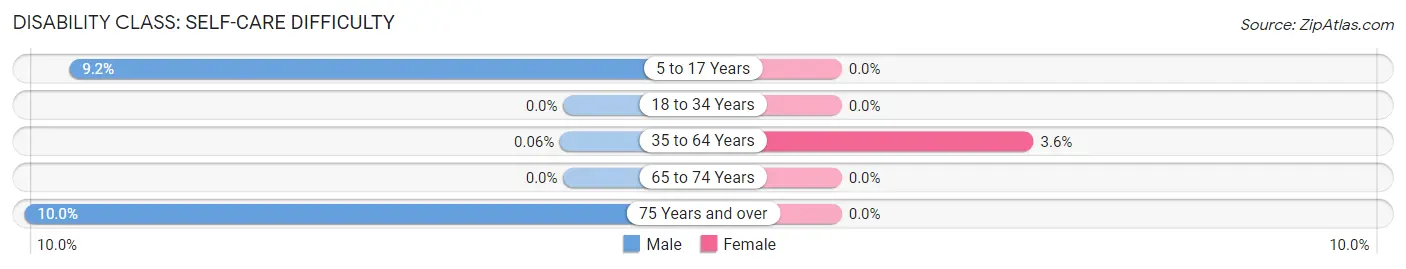
| Age Bracket | Male | Female |
| 5 to 17 Years | 52 (9.2%) | 0 (0.0%) |
| 18 to 34 Years | 0 (0.0%) | 0 (0.0%) |
| 35 to 64 Years | 1 (0.1%) | 45 (3.6%) |
| 65 to 74 Years | 0 (0.0%) | 0 (0.0%) |
| 75 Years and over | 15 (10.0%) | 0 (0.0%) |
Technology Access in Westwood
Computing Device Access in Westwood
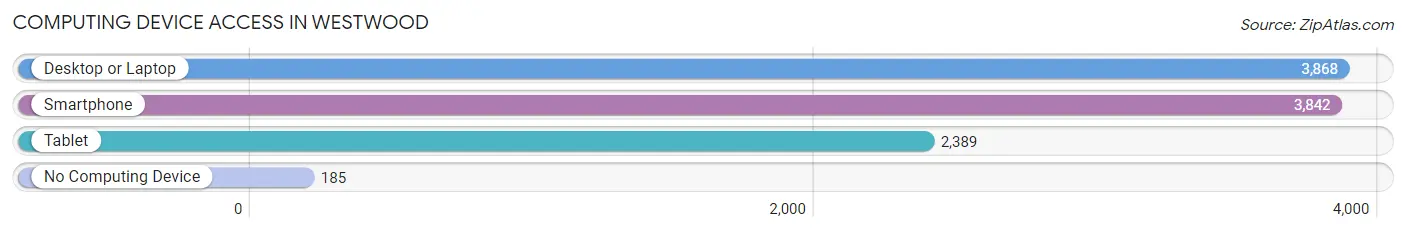
| Device Type | # Households | % Households |
| Desktop or Laptop | 3,868 | 87.6% |
| Smartphone | 3,842 | 87.1% |
| Tablet | 2,389 | 54.1% |
| No Computing Device | 185 | 4.2% |
| Total | 4,413 | 100.0% |
Internet Access in Westwood
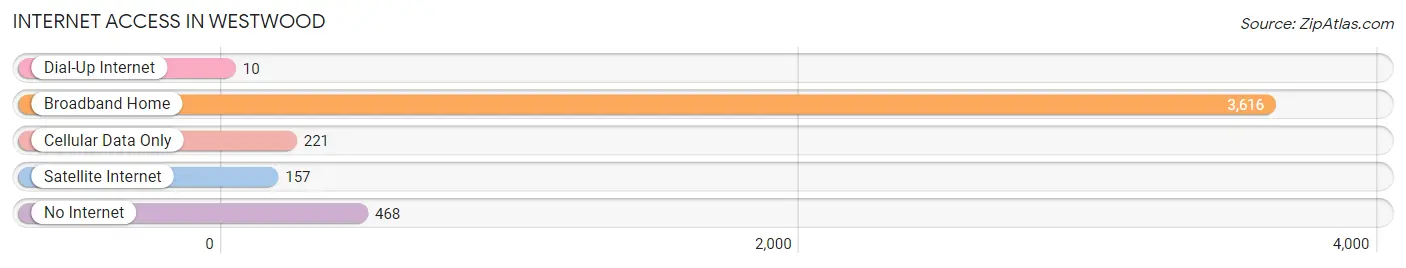
| Internet Type | # Households | % Households |
| Dial-Up Internet | 10 | 0.2% |
| Broadband Home | 3,616 | 81.9% |
| Cellular Data Only | 221 | 5.0% |
| Satellite Internet | 157 | 3.6% |
| No Internet | 468 | 10.6% |
| Total | 4,413 | 100.0% |
Westwood Summary
Westwood, Michigan is a small village located in the western part of the state, in the county of Houghton. It is situated on the shores of Lake Superior, and is part of the Keweenaw Peninsula. The village has a population of just over 500 people, and is a popular tourist destination due to its proximity to the lake and its many outdoor activities.
History
Westwood was first settled in the late 1800s by Finnish immigrants who were looking for a place to call home. The village was originally known as “Kivimaa”, which means “stone land” in Finnish. The village was officially incorporated in 1891, and the name was changed to Westwood in 1895.
The village was a popular destination for tourists in the early 1900s, and many of the original buildings still stand today. The village was also home to a number of businesses, including a sawmill, a general store, and a hotel.
Geography
Westwood is located in the western part of the state, in the county of Houghton. It is situated on the shores of Lake Superior, and is part of the Keweenaw Peninsula. The village is surrounded by forests and lakes, and is a popular destination for outdoor activities such as fishing, hunting, and camping.
The village is located approximately 25 miles from the city of Houghton, and is accessible by car or boat. The nearest airport is located in Houghton, and the nearest major city is Marquette, which is about an hour away.
Economy
The economy of Westwood is largely based on tourism. The village is a popular destination for outdoor activities, and many visitors come to the area to enjoy the natural beauty of the area. The village also has a number of businesses, including a general store, a sawmill, and a hotel.
The village is also home to a number of small businesses, including a bakery, a cafe, and a gift shop. The village also has a number of art galleries, which feature the work of local artists.
Demographics
As of the 2010 census, the population of Westwood was 514. The population is largely made up of Caucasian individuals, with a small percentage of African Americans, Native Americans, and other ethnicities. The median age of the population is 44.7 years, and the median household income is $37,500.
The village is served by the Westwood Public School District, which includes one elementary school and one high school. The village also has a number of churches, including the Westwood United Methodist Church and the Westwood Lutheran Church.
Conclusion
Westwood, Michigan is a small village located in the western part of the state, in the county of Houghton. It is situated on the shores of Lake Superior, and is part of the Keweenaw Peninsula. The village has a population of just over 500 people, and is a popular tourist destination due to its proximity to the lake and its many outdoor activities. The economy of Westwood is largely based on tourism, and the village is home to a number of businesses, including a general store, a sawmill, and a hotel. The population is largely made up of Caucasian individuals, with a small percentage of African Americans, Native Americans, and other ethnicities. The village is served by the Westwood Public School District, and has a number of churches.
Common Questions
What is the Total Population of Westwood?
Total Population of Westwood is 9,022.
What is the Total Male Population of Westwood?
Total Male Population of Westwood is 4,420.
What is the Total Female Population of Westwood?
Total Female Population of Westwood is 4,602.
What is the Ratio of Males per 100 Females in Westwood?
There are 96.05 Males per 100 Females in Westwood.
What is the Ratio of Females per 100 Males in Westwood?
There are 104.12 Females per 100 Males in Westwood.
What is the Median Population Age in Westwood?
Median Population Age in Westwood is 34.8 Years.
What is the Average Family Size in Westwood
Average Family Size in Westwood is 2.8 People.
What is the Average Household Size in Westwood
Average Household Size in Westwood is 2.0 People.
What is Per Capita Income in Westwood?
Per Capita income in Westwood is $43,640.
What is the Median Family Income in Westwood?
Median Family Income in Westwood is $82,257.
What is the Median Household income in Westwood?
Median Household Income in Westwood is $61,348.
What is Income or Wage Gap in Westwood?
Income or Wage Gap in Westwood is 33.4%.
Women in Westwood earn 66.6 cents for every dollar earned by a man.
What is Inequality or Gini Index in Westwood?
Inequality or Gini Index in Westwood is 0.51.
How Large is the Labor Force in Westwood?
There are 5,186 People in the Labor Forcein in Westwood.
What is the Percentage of People in the Labor Force in Westwood?
66.8% of People are in the Labor Force in Westwood.
What is the Unemployment Rate in Westwood?
Unemployment Rate in Westwood is 3.7%.