Shelby, MI
Shelby Map
Shelby Overview
2,520
TOTAL POPULATION
1,193
MALE POPULATION
1,327
FEMALE POPULATION
89.90
MALES / 100 FEMALES
111.23
FEMALES / 100 MALES
31.9
MEDIAN AGE
3.5
AVG FAMILY SIZE
3.0
AVG HOUSEHOLD SIZE
$22,673
PER CAPITA INCOME
$63,750
AVG FAMILY INCOME
$51,316
AVG HOUSEHOLD INCOME
31.6%
WAGE / INCOME GAP [ % ]
68.4¢/ $1
WAGE / INCOME GAP [ $ ]
0.39
INEQUALITY / GINI INDEX
1,172
LABOR FORCE [ PEOPLE ]
65.1%
PERCENT IN LABOR FORCE
4.2%
UNEMPLOYMENT RATE
Shelby Zip Codes
Shelby Area Codes
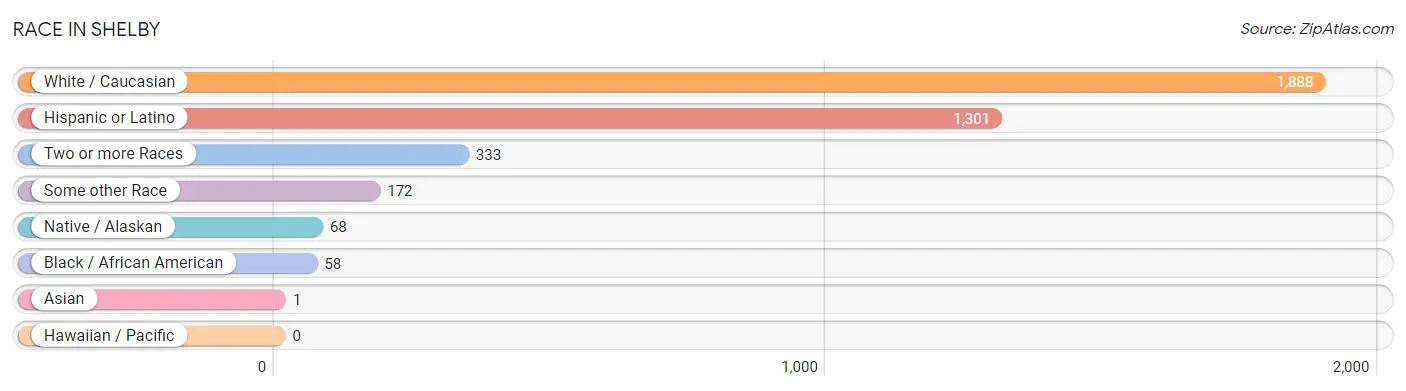
Race in Shelby
The most populous races in Shelby are White / Caucasian (1,888 | 74.9%), Hispanic or Latino (1,301 | 51.6%), and Two or more Races (333 | 13.2%).
| Race | # Population | % Population |
| Asian | 1 | 0.0% |
| Black / African American | 58 | 2.3% |
| Hawaiian / Pacific | 0 | 0.0% |
| Hispanic or Latino | 1,301 | 51.6% |
| Native / Alaskan | 68 | 2.7% |
| White / Caucasian | 1,888 | 74.9% |
| Two or more Races | 333 | 13.2% |
| Some other Race | 172 | 6.8% |
| Total | 2,520 | 100.0% |
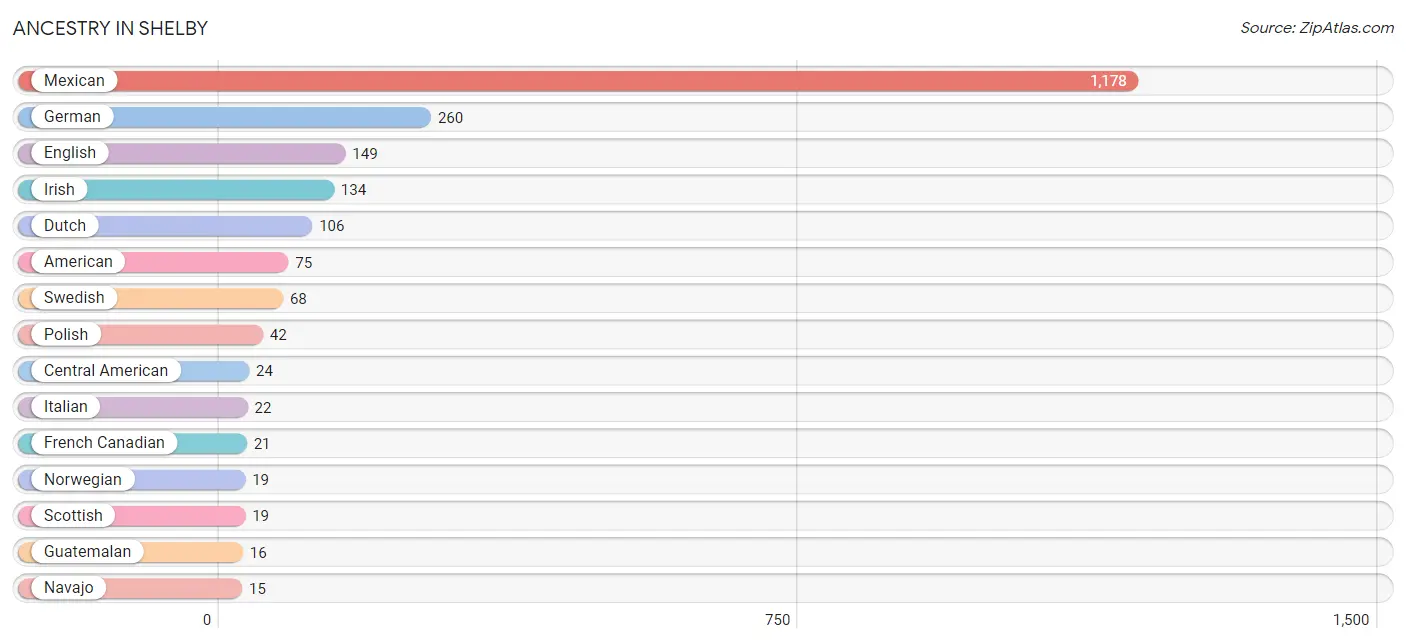
Ancestry in Shelby
The most populous ancestries reported in Shelby are Mexican (1,178 | 46.8%), German (260 | 10.3%), English (149 | 5.9%), Irish (134 | 5.3%), and Dutch (106 | 4.2%), together accounting for 72.5% of all Shelby residents.
| Ancestry | # Population | % Population |
| American | 75 | 3.0% |
| Austrian | 4 | 0.2% |
| Belgian | 4 | 0.2% |
| British | 3 | 0.1% |
| Central American | 24 | 0.9% |
| Central American Indian | 12 | 0.5% |
| Chippewa | 6 | 0.2% |
| Colombian | 3 | 0.1% |
| Czech | 6 | 0.2% |
| Danish | 4 | 0.2% |
| Dutch | 106 | 4.2% |
| English | 149 | 5.9% |
| European | 7 | 0.3% |
| French | 4 | 0.2% |
| French Canadian | 21 | 0.8% |
| German | 260 | 10.3% |
| Greek | 13 | 0.5% |
| Guatemalan | 16 | 0.6% |
| Hungarian | 14 | 0.6% |
| Irish | 134 | 5.3% |
| Italian | 22 | 0.9% |
| Korean | 9 | 0.4% |
| Lithuanian | 2 | 0.1% |
| Mexican | 1,178 | 46.8% |
| Mexican American Indian | 4 | 0.2% |
| Navajo | 15 | 0.6% |
| Norwegian | 19 | 0.7% |
| Ottawa | 2 | 0.1% |
| Polish | 42 | 1.7% |
| Salvadoran | 8 | 0.3% |
| Scotch-Irish | 6 | 0.2% |
| Scottish | 19 | 0.7% |
| South American | 3 | 0.1% |
| Spaniard | 7 | 0.3% |
| Swedish | 68 | 2.7% |
| Swiss | 3 | 0.1% |
| Welsh | 6 | 0.2% |
| Yugoslavian | 4 | 0.2% | View All 38 Rows |
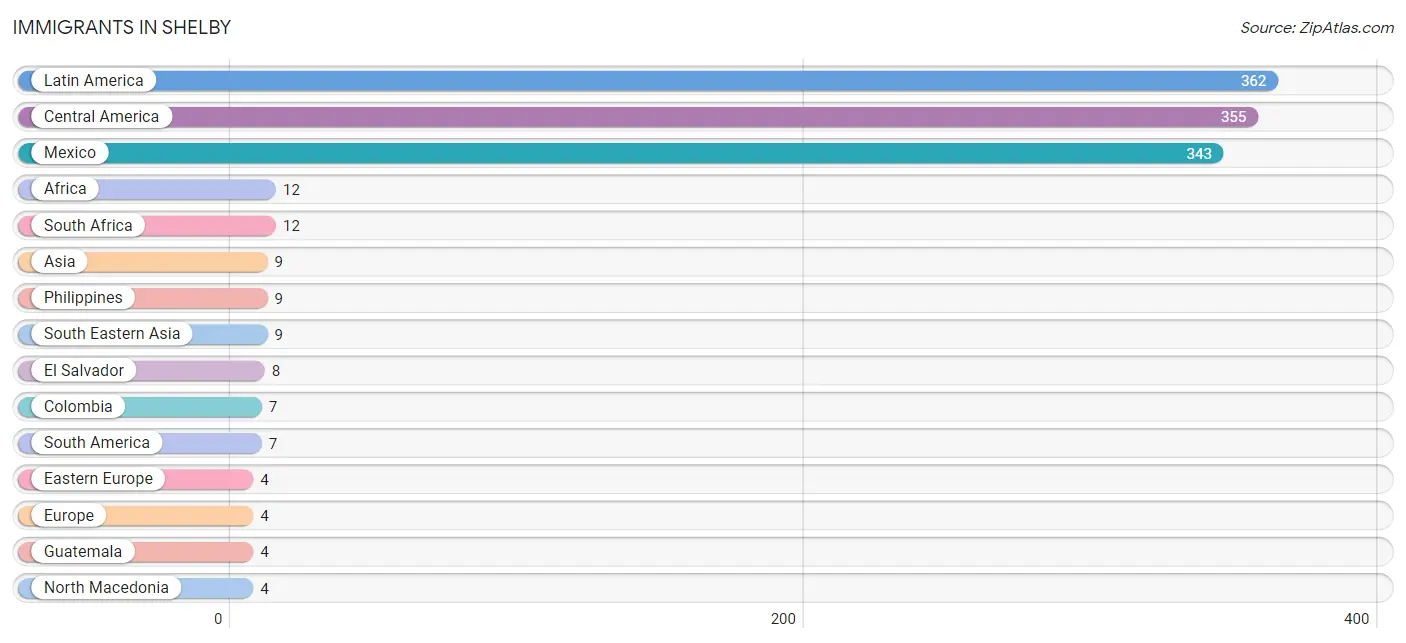
Immigrants in Shelby
The most numerous immigrant groups reported in Shelby came from Latin America (362 | 14.4%), Central America (355 | 14.1%), Mexico (343 | 13.6%), Africa (12 | 0.5%), and South Africa (12 | 0.5%), together accounting for 43.0% of all Shelby residents.
| Immigration Origin | # Population | % Population |
| Africa | 12 | 0.5% |
| Asia | 9 | 0.4% |
| Canada | 3 | 0.1% |
| Central America | 355 | 14.1% |
| Colombia | 7 | 0.3% |
| Eastern Europe | 4 | 0.2% |
| El Salvador | 8 | 0.3% |
| Europe | 4 | 0.2% |
| Guatemala | 4 | 0.2% |
| Latin America | 362 | 14.4% |
| Mexico | 343 | 13.6% |
| North Macedonia | 4 | 0.2% |
| Philippines | 9 | 0.4% |
| South Africa | 12 | 0.5% |
| South America | 7 | 0.3% |
| South Eastern Asia | 9 | 0.4% | View All 16 Rows |
Sex and Age in Shelby
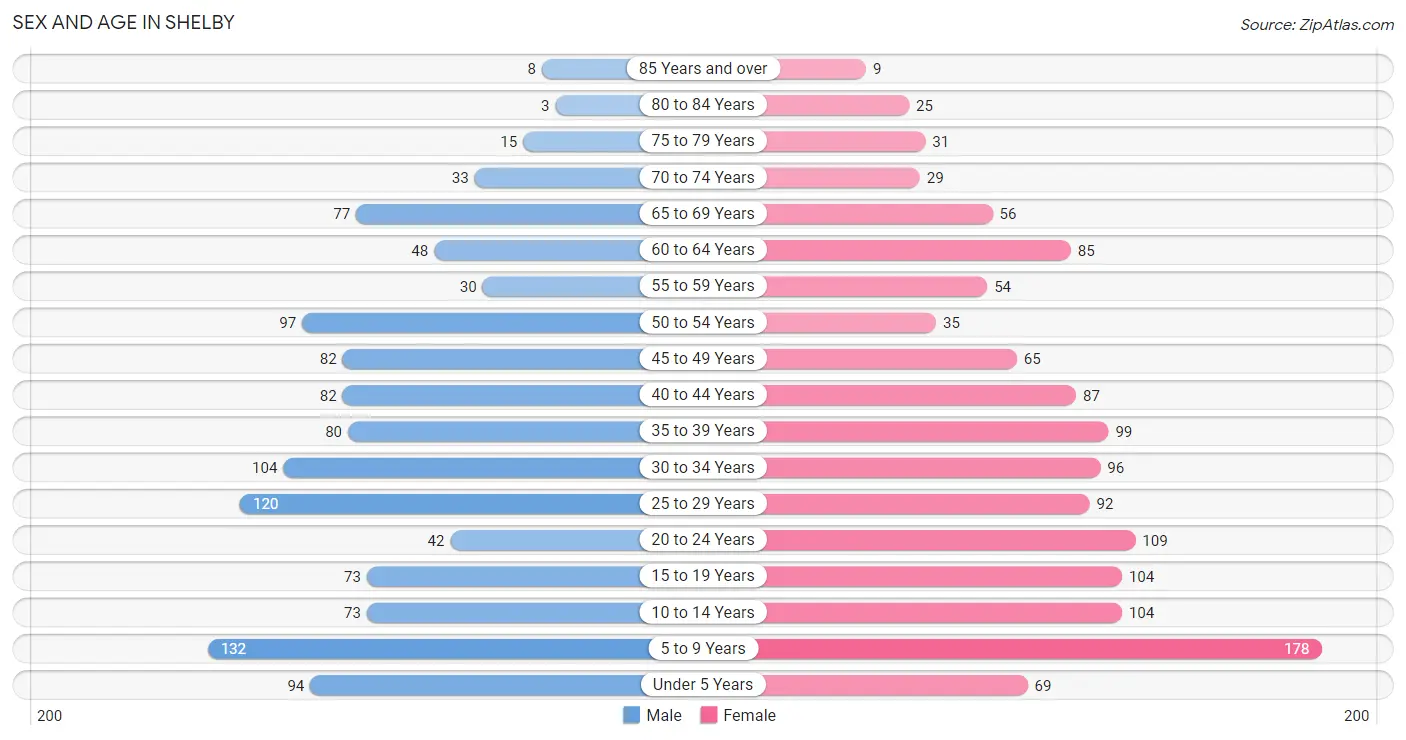
Sex and Age in Shelby
The most populous age groups in Shelby are 5 to 9 Years (132 | 11.1%) for men and 5 to 9 Years (178 | 13.4%) for women.
| Age Bracket | Male | Female |
| Under 5 Years | 94 (7.9%) | 69 (5.2%) |
| 5 to 9 Years | 132 (11.1%) | 178 (13.4%) |
| 10 to 14 Years | 73 (6.1%) | 104 (7.8%) |
| 15 to 19 Years | 73 (6.1%) | 104 (7.8%) |
| 20 to 24 Years | 42 (3.5%) | 109 (8.2%) |
| 25 to 29 Years | 120 (10.1%) | 92 (6.9%) |
| 30 to 34 Years | 104 (8.7%) | 96 (7.2%) |
| 35 to 39 Years | 80 (6.7%) | 99 (7.5%) |
| 40 to 44 Years | 82 (6.9%) | 87 (6.6%) |
| 45 to 49 Years | 82 (6.9%) | 65 (4.9%) |
| 50 to 54 Years | 97 (8.1%) | 35 (2.6%) |
| 55 to 59 Years | 30 (2.5%) | 54 (4.1%) |
| 60 to 64 Years | 48 (4.0%) | 85 (6.4%) |
| 65 to 69 Years | 77 (6.5%) | 56 (4.2%) |
| 70 to 74 Years | 33 (2.8%) | 29 (2.2%) |
| 75 to 79 Years | 15 (1.3%) | 31 (2.3%) |
| 80 to 84 Years | 3 (0.3%) | 25 (1.9%) |
| 85 Years and over | 8 (0.7%) | 9 (0.7%) |
| Total | 1,193 (100.0%) | 1,327 (100.0%) |
Families and Households in Shelby
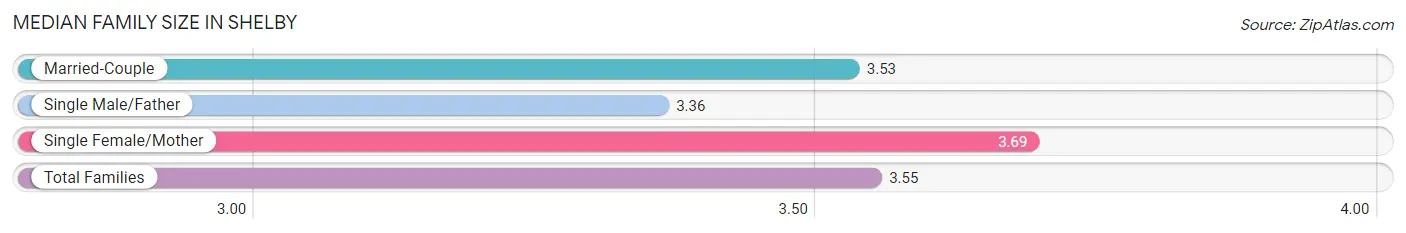
Median Family Size in Shelby
The median family size in Shelby is 3.55 persons per family, with single female/mother families (170 | 29.1%) accounting for the largest median family size of 3.69 persons per family. On the other hand, single male/father families (85 | 14.5%) represent the smallest median family size with 3.36 persons per family.
| Family Type | # Families | Family Size |
| Married-Couple | 329 (56.3%) | 3.53 |
| Single Male/Father | 85 (14.5%) | 3.36 |
| Single Female/Mother | 170 (29.1%) | 3.69 |
| Total Families | 584 (100.0%) | 3.55 |
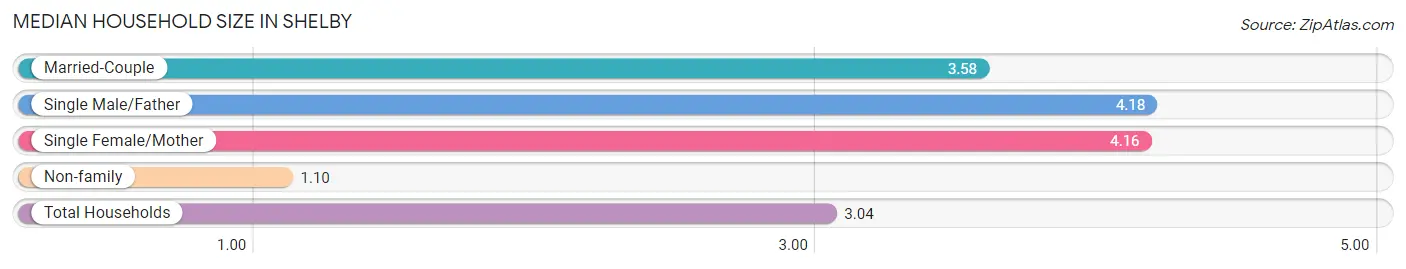
Median Household Size in Shelby
The median household size in Shelby is 3.04 persons per household, with single male/father households (85 | 10.3%) accounting for the largest median household size of 4.18 persons per household. non-family households (240 | 29.1%) represent the smallest median household size with 1.10 persons per household.
| Household Type | # Households | Household Size |
| Married-Couple | 329 (39.9%) | 3.58 |
| Single Male/Father | 85 (10.3%) | 4.18 |
| Single Female/Mother | 170 (20.6%) | 4.16 |
| Non-family | 240 (29.1%) | 1.10 |
| Total Households | 824 (100.0%) | 3.04 |
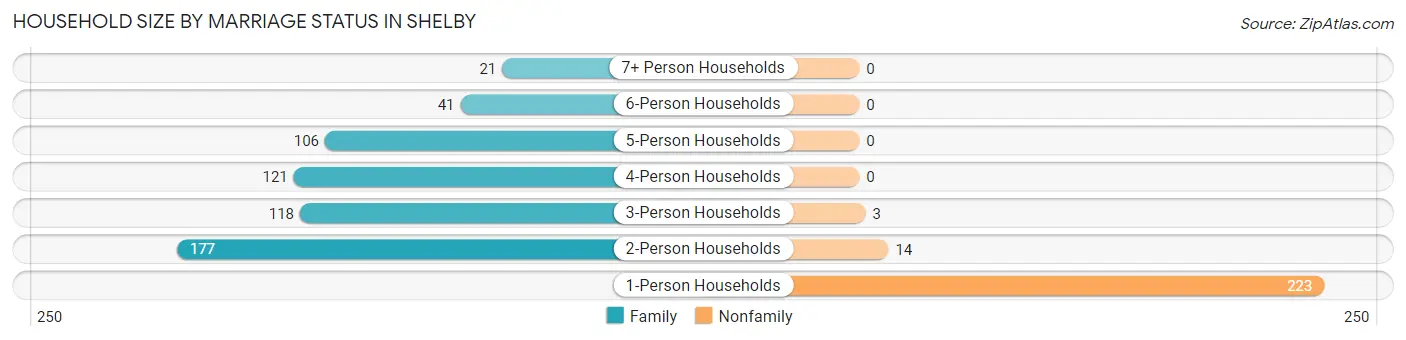
Household Size by Marriage Status in Shelby
Out of a total of 824 households in Shelby, 584 (70.9%) are family households, while 240 (29.1%) are nonfamily households. The most numerous type of family households are 2-person households, comprising 177, and the most common type of nonfamily households are 1-person households, comprising 223.
| Household Size | Family Households | Nonfamily Households |
| 1-Person Households | - | 223 (27.1%) |
| 2-Person Households | 177 (21.5%) | 14 (1.7%) |
| 3-Person Households | 118 (14.3%) | 3 (0.4%) |
| 4-Person Households | 121 (14.7%) | 0 (0.0%) |
| 5-Person Households | 106 (12.9%) | 0 (0.0%) |
| 6-Person Households | 41 (5.0%) | 0 (0.0%) |
| 7+ Person Households | 21 (2.5%) | 0 (0.0%) |
| Total | 584 (70.9%) | 240 (29.1%) |
Female Fertility in Shelby
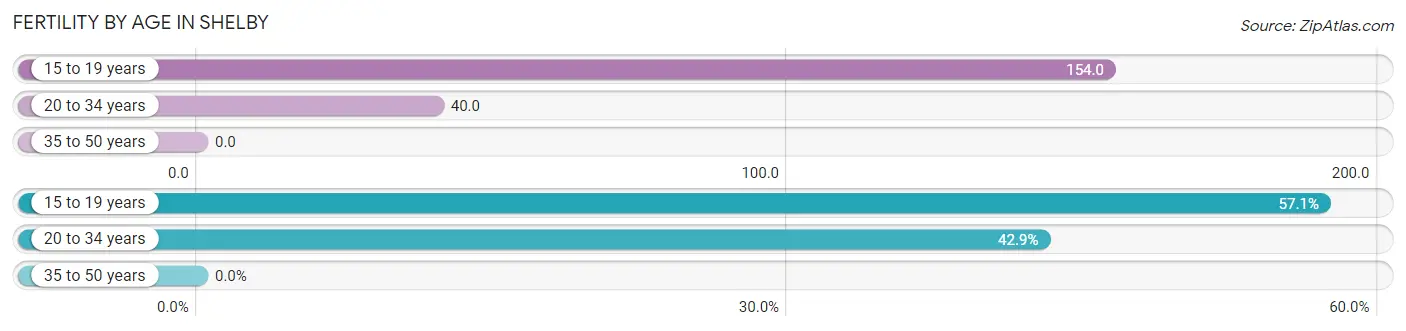
Fertility by Age in Shelby
Average fertility rate in Shelby is 42.0 births per 1,000 women. Women in the age bracket of 15 to 19 years have the highest fertility rate with 154.0 births per 1,000 women. Women in the age bracket of 15 to 19 years acount for 57.1% of all women with births.
| Age Bracket | Women with Births | Births / 1,000 Women |
| 15 to 19 years | 16 (57.1%) | 154.0 |
| 20 to 34 years | 12 (42.9%) | 40.0 |
| 35 to 50 years | 0 (0.0%) | 0.0 |
| Total | 28 (100.0%) | 42.0 |
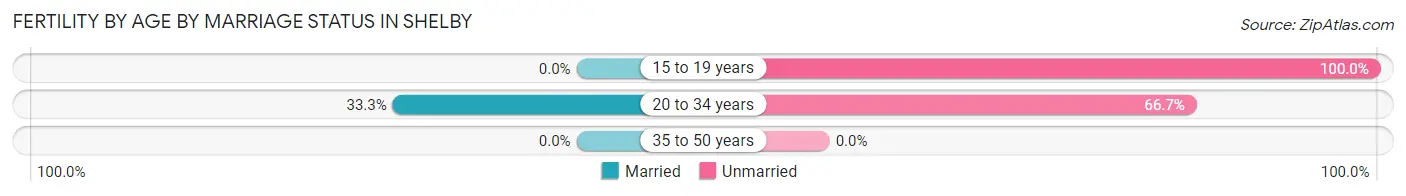
Fertility by Age by Marriage Status in Shelby
14.3% of women with births (28) in Shelby are married. The highest percentage of unmarried women with births falls into 15 to 19 years age bracket with 100.0% of them unmarried at the time of birth, while the lowest percentage of unmarried women with births belong to 20 to 34 years age bracket with 66.7% of them unmarried.
| Age Bracket | Married | Unmarried |
| 15 to 19 years | 0 (0.0%) | 16 (100.0%) |
| 20 to 34 years | 4 (33.3%) | 8 (66.7%) |
| 35 to 50 years | 0 (0.0%) | 0 (0.0%) |
| Total | 4 (14.3%) | 24 (85.7%) |
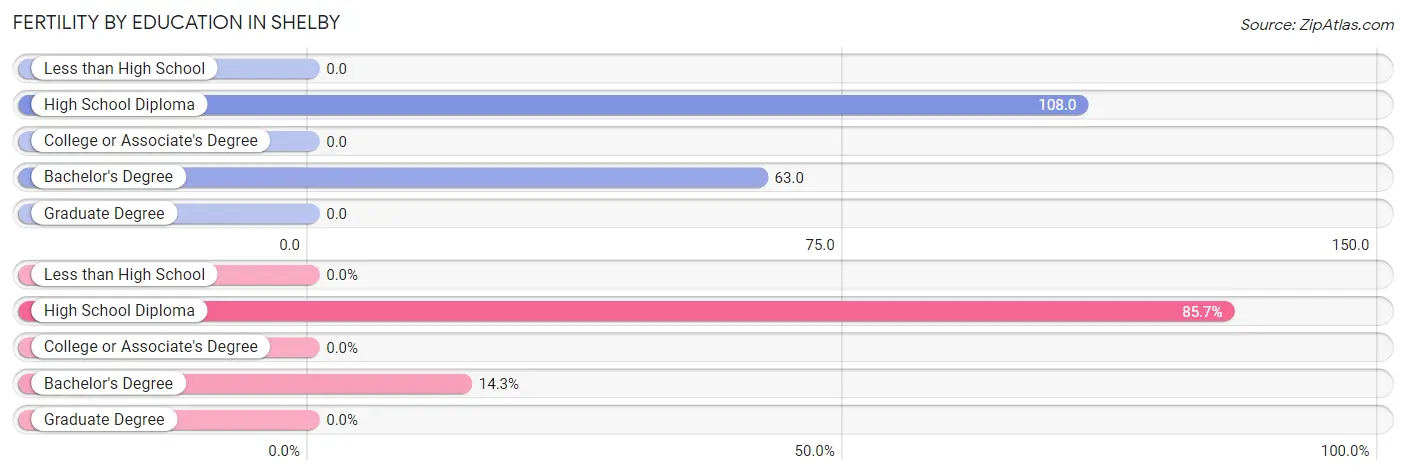
Fertility by Education in Shelby
| Educational Attainment | Women with Births | Births / 1,000 Women |
| Less than High School | 0 (0.0%) | 0.0 |
| High School Diploma | 24 (85.7%) | 108.0 |
| College or Associate's Degree | 0 (0.0%) | 0.0 |
| Bachelor's Degree | 4 (14.3%) | 63.0 |
| Graduate Degree | 0 (0.0%) | 0.0 |
| Total | 28 (100.0%) | 42.0 |
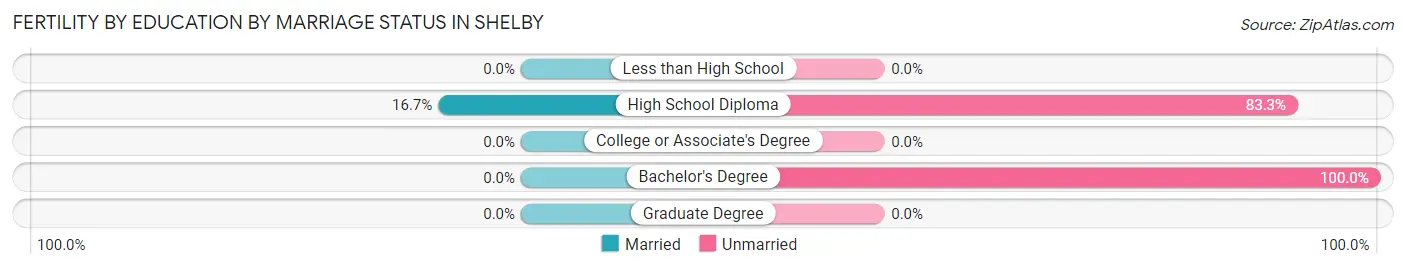
Fertility by Education by Marriage Status in Shelby
85.7% of women with births in Shelby are unmarried. Women with the educational attainment of high school diploma are most likely to be married with 16.7% of them married at childbirth, while women with the educational attainment of bachelor's degree are least likely to be married with 100.0% of them unmarried at childbirth.
| Educational Attainment | Married | Unmarried |
| Less than High School | 0 (0.0%) | 0 (0.0%) |
| High School Diploma | 4 (16.7%) | 20 (83.3%) |
| College or Associate's Degree | 0 (0.0%) | 0 (0.0%) |
| Bachelor's Degree | 0 (0.0%) | 4 (100.0%) |
| Graduate Degree | 0 (0.0%) | 0 (0.0%) |
| Total | 4 (14.3%) | 24 (85.7%) |
Income in Shelby
Income Overview in Shelby
Per Capita Income in Shelby is $22,673, while median incomes of families and households are $63,750 and $51,316 respectively.
| Characteristic | Number | Measure |
| Per Capita Income | 2,520 | $22,673 |
| Median Family Income | 584 | $63,750 |
| Mean Family Income | 584 | $71,775 |
| Median Household Income | 824 | $51,316 |
| Mean Household Income | 824 | $64,918 |
| Income Deficit | 584 | $0 |
| Wage / Income Gap (%) | 2,520 | 31.60% |
| Wage / Income Gap ($) | 2,520 | 68.40¢ per $1 |
| Gini / Inequality Index | 2,520 | 0.39 |
Earnings by Sex in Shelby
Average Earnings in Shelby are $33,361, $38,969 for men and $26,653 for women, a difference of 31.6%.
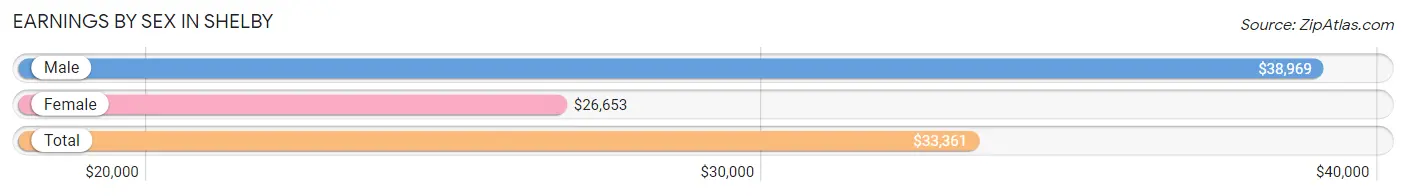
| Sex | Number | Average Earnings |
| Male | 651 (51.2%) | $38,969 |
| Female | 621 (48.8%) | $26,653 |
| Total | 1,272 (100.0%) | $33,361 |
Earnings by Sex by Income Bracket in Shelby
The most common earnings brackets in Shelby are $40,000 to $44,999 for men (81 | 12.4%) and $30,000 to $34,999 for women (78 | 12.6%).
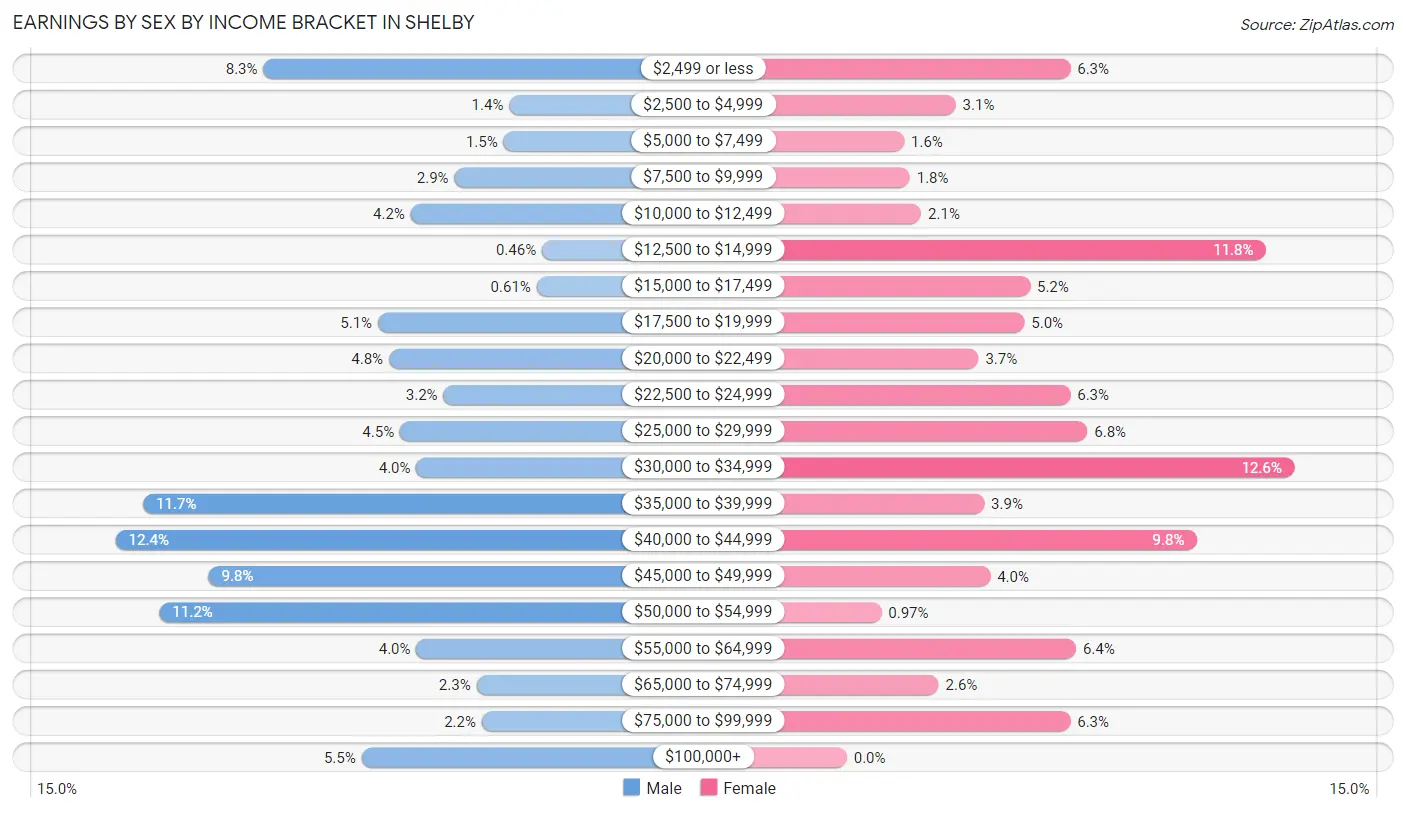
| Income | Male | Female |
| $2,499 or less | 54 (8.3%) | 39 (6.3%) |
| $2,500 to $4,999 | 9 (1.4%) | 19 (3.1%) |
| $5,000 to $7,499 | 10 (1.5%) | 10 (1.6%) |
| $7,500 to $9,999 | 19 (2.9%) | 11 (1.8%) |
| $10,000 to $12,499 | 27 (4.2%) | 13 (2.1%) |
| $12,500 to $14,999 | 3 (0.5%) | 73 (11.8%) |
| $15,000 to $17,499 | 4 (0.6%) | 32 (5.1%) |
| $17,500 to $19,999 | 33 (5.1%) | 31 (5.0%) |
| $20,000 to $22,499 | 31 (4.8%) | 23 (3.7%) |
| $22,500 to $24,999 | 21 (3.2%) | 39 (6.3%) |
| $25,000 to $29,999 | 29 (4.4%) | 42 (6.8%) |
| $30,000 to $34,999 | 26 (4.0%) | 78 (12.6%) |
| $35,000 to $39,999 | 76 (11.7%) | 24 (3.9%) |
| $40,000 to $44,999 | 81 (12.4%) | 61 (9.8%) |
| $45,000 to $49,999 | 64 (9.8%) | 25 (4.0%) |
| $50,000 to $54,999 | 73 (11.2%) | 6 (1.0%) |
| $55,000 to $64,999 | 26 (4.0%) | 40 (6.4%) |
| $65,000 to $74,999 | 15 (2.3%) | 16 (2.6%) |
| $75,000 to $99,999 | 14 (2.1%) | 39 (6.3%) |
| $100,000+ | 36 (5.5%) | 0 (0.0%) |
| Total | 651 (100.0%) | 621 (100.0%) |
Earnings by Sex by Educational Attainment in Shelby
Average earnings in Shelby are $41,216 for men and $28,977 for women, a difference of 29.7%. Men with an educational attainment of graduate degree enjoy the highest average annual earnings of $111,250, while those with bachelor's degree education earn the least with $23,750. Women with an educational attainment of college or associate's degree earn the most with the average annual earnings of $32,656, while those with high school diploma education have the smallest earnings of $24,732.
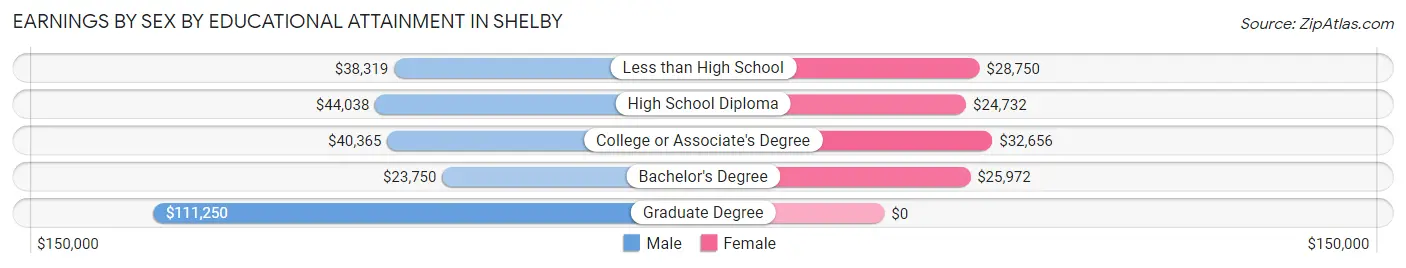
| Educational Attainment | Male Income | Female Income |
| Less than High School | $38,319 | $28,750 |
| High School Diploma | $44,038 | $24,732 |
| College or Associate's Degree | $40,365 | $32,656 |
| Bachelor's Degree | $23,750 | $25,972 |
| Graduate Degree | $111,250 | $0 |
| Total | $41,216 | $28,977 |
Family Income in Shelby
Family Income Brackets in Shelby
According to the Shelby family income data, there are 137 families falling into the $35,000 to $49,999 income range, which is the most common income bracket and makes up 23.5% of all families.
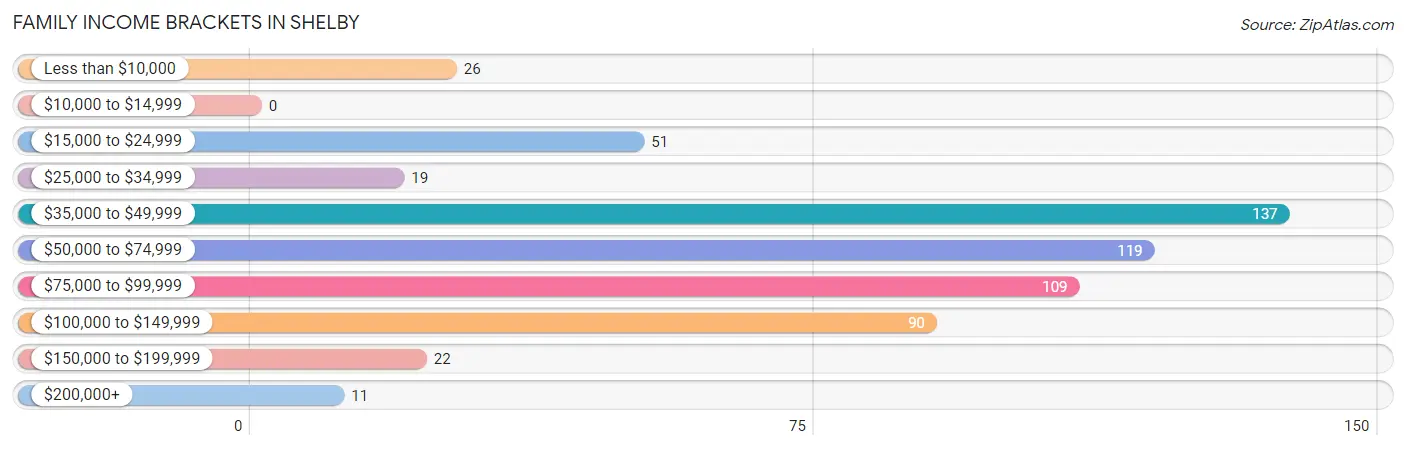
| Income Bracket | # Families | % Families |
| Less than $10,000 | 26 | 4.5% |
| $10,000 to $14,999 | 0 | 0.0% |
| $15,000 to $24,999 | 51 | 8.7% |
| $25,000 to $34,999 | 19 | 3.3% |
| $35,000 to $49,999 | 137 | 23.5% |
| $50,000 to $74,999 | 119 | 20.4% |
| $75,000 to $99,999 | 109 | 18.7% |
| $100,000 to $149,999 | 90 | 15.4% |
| $150,000 to $199,999 | 22 | 3.8% |
| $200,000+ | 11 | 1.9% |
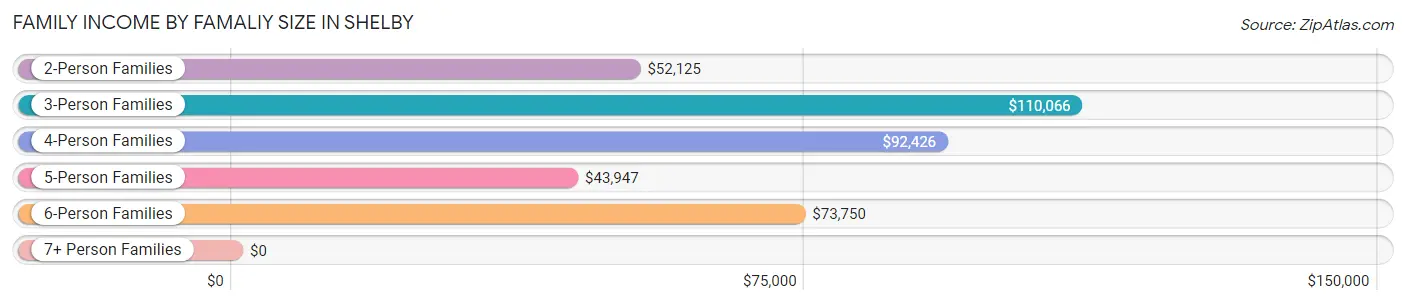
Family Income by Famaliy Size in Shelby
3-person families (101 | 17.3%) account for the highest median family income in Shelby with $110,066 per family, while 3-person families (101 | 17.3%) have the highest median income of $36,689 per family member.
| Income Bracket | # Families | Median Income |
| 2-Person Families | 217 (37.2%) | $52,125 |
| 3-Person Families | 101 (17.3%) | $110,066 |
| 4-Person Families | 143 (24.5%) | $92,426 |
| 5-Person Families | 92 (15.8%) | $43,947 |
| 6-Person Families | 10 (1.7%) | $73,750 |
| 7+ Person Families | 21 (3.6%) | $0 |
| Total | 584 (100.0%) | $63,750 |
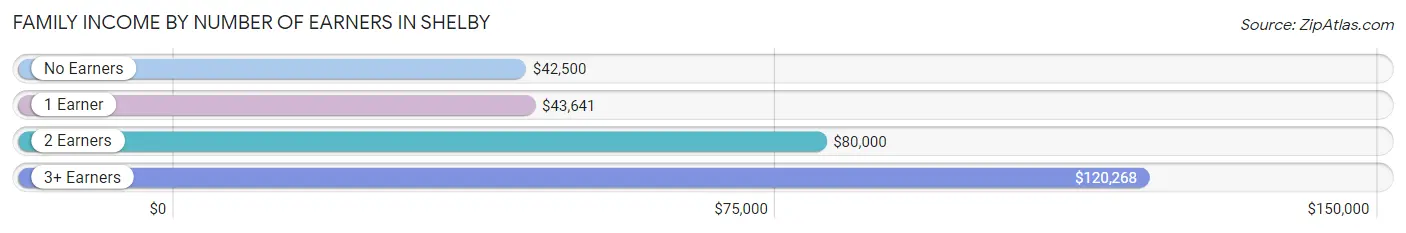
Family Income by Number of Earners in Shelby
The median family income in Shelby is $63,750, with families comprising 3+ earners (77) having the highest median family income of $120,268, while families with no earners (30) have the lowest median family income of $42,500, accounting for 13.2% and 5.1% of families, respectively.
| Number of Earners | # Families | Median Income |
| No Earners | 30 (5.1%) | $42,500 |
| 1 Earner | 221 (37.8%) | $43,641 |
| 2 Earners | 256 (43.8%) | $80,000 |
| 3+ Earners | 77 (13.2%) | $120,268 |
| Total | 584 (100.0%) | $63,750 |
Household Income in Shelby
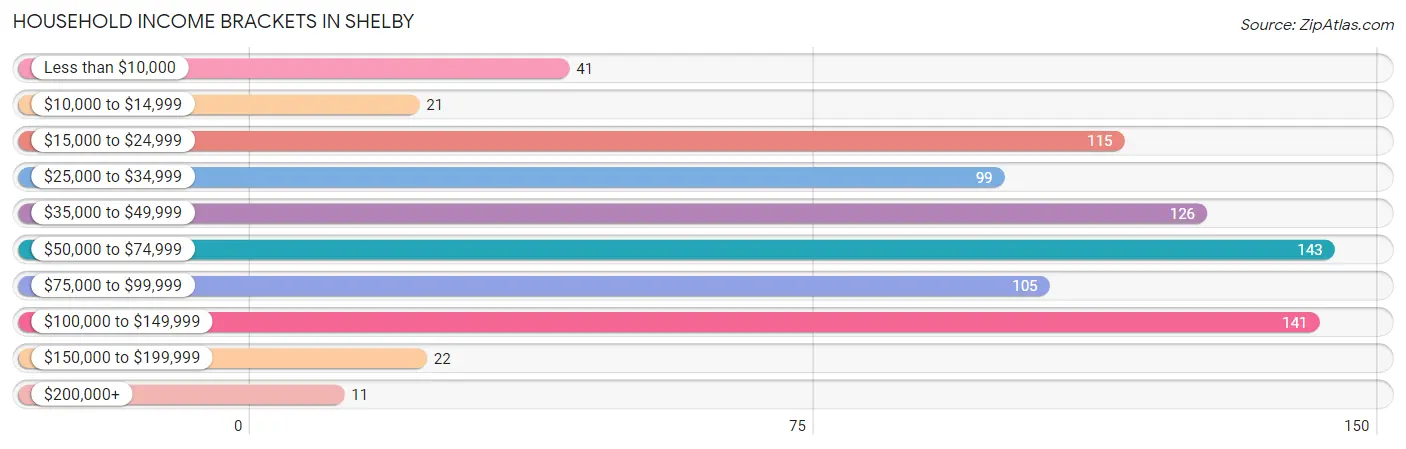
Household Income Brackets in Shelby
With 143 households falling in the category, the $50,000 to $74,999 income range is the most frequent in Shelby, accounting for 17.3% of all households. In contrast, only 11 households (1.3%) fall into the $200,000+ income bracket, making it the least populous group.
| Income Bracket | # Households | % Households |
| Less than $10,000 | 41 | 5.0% |
| $10,000 to $14,999 | 21 | 2.5% |
| $15,000 to $24,999 | 115 | 14.0% |
| $25,000 to $34,999 | 99 | 12.0% |
| $35,000 to $49,999 | 126 | 15.3% |
| $50,000 to $74,999 | 143 | 17.4% |
| $75,000 to $99,999 | 105 | 12.7% |
| $100,000 to $149,999 | 141 | 17.1% |
| $150,000 to $199,999 | 22 | 2.7% |
| $200,000+ | 11 | 1.3% |
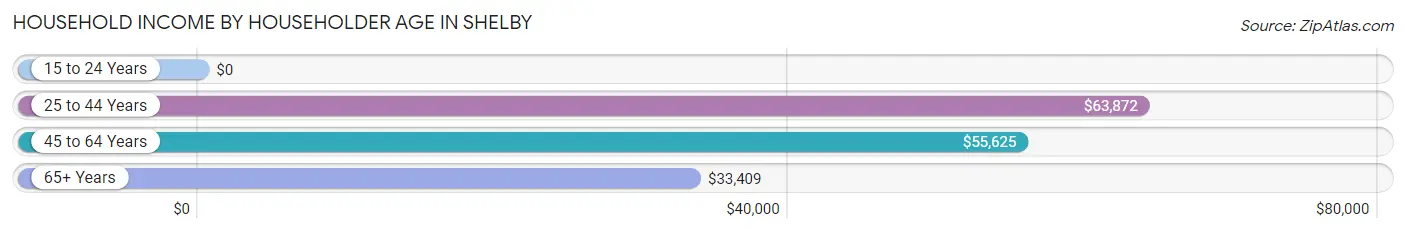
Household Income by Householder Age in Shelby
The median household income in Shelby is $51,316, with the highest median household income of $63,872 found in the 25 to 44 years age bracket for the primary householder. A total of 333 households (40.4%) fall into this category. Meanwhile, the 15 to 24 years age bracket for the primary householder has the lowest median household income of $0, with 37 households (4.5%) in this group.
| Income Bracket | # Households | Median Income |
| 15 to 24 Years | 37 (4.5%) | $0 |
| 25 to 44 Years | 333 (40.4%) | $63,872 |
| 45 to 64 Years | 254 (30.8%) | $55,625 |
| 65+ Years | 200 (24.3%) | $33,409 |
| Total | 824 (100.0%) | $51,316 |
Poverty in Shelby
Income Below Poverty by Sex and Age in Shelby
With 15.6% poverty level for males and 16.0% for females among the residents of Shelby, 16 and 17 year old males and 5 year old females are the most vulnerable to poverty, with 9 males (50.0%) and 5 females (100.0%) in their respective age groups living below the poverty level.
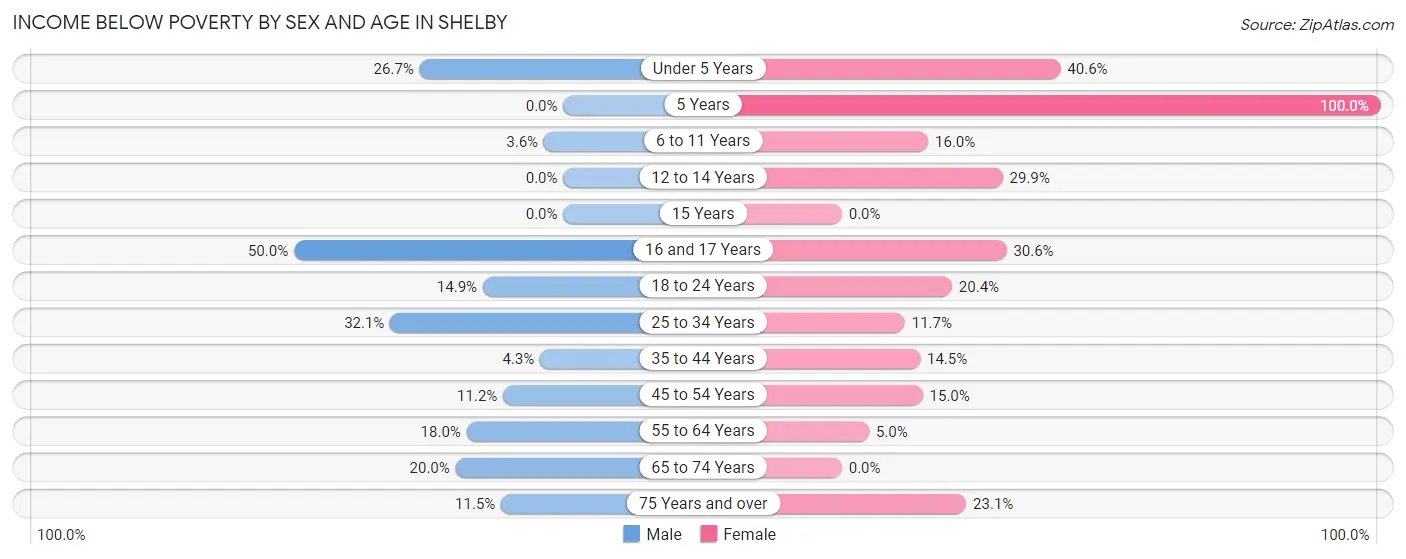
| Age Bracket | Male | Female |
| Under 5 Years | 24 (26.7%) | 28 (40.6%) |
| 5 Years | 0 (0.0%) | 5 (100.0%) |
| 6 to 11 Years | 5 (3.6%) | 33 (16.0%) |
| 12 to 14 Years | 0 (0.0%) | 20 (29.8%) |
| 15 Years | 0 (0.0%) | 0 (0.0%) |
| 16 and 17 Years | 9 (50.0%) | 11 (30.6%) |
| 18 to 24 Years | 10 (14.9%) | 28 (20.4%) |
| 25 to 34 Years | 72 (32.1%) | 22 (11.7%) |
| 35 to 44 Years | 7 (4.3%) | 27 (14.5%) |
| 45 to 54 Years | 20 (11.2%) | 15 (15.0%) |
| 55 to 64 Years | 14 (17.9%) | 7 (5.0%) |
| 65 to 74 Years | 22 (20.0%) | 0 (0.0%) |
| 75 Years and over | 3 (11.5%) | 15 (23.1%) |
| Total | 186 (15.6%) | 211 (16.0%) |
Income Above Poverty by Sex and Age in Shelby
According to the poverty statistics in Shelby, males aged 5 years and females aged 15 years are the age groups that are most secure financially, with 100.0% of males and 100.0% of females in these age groups living above the poverty line.
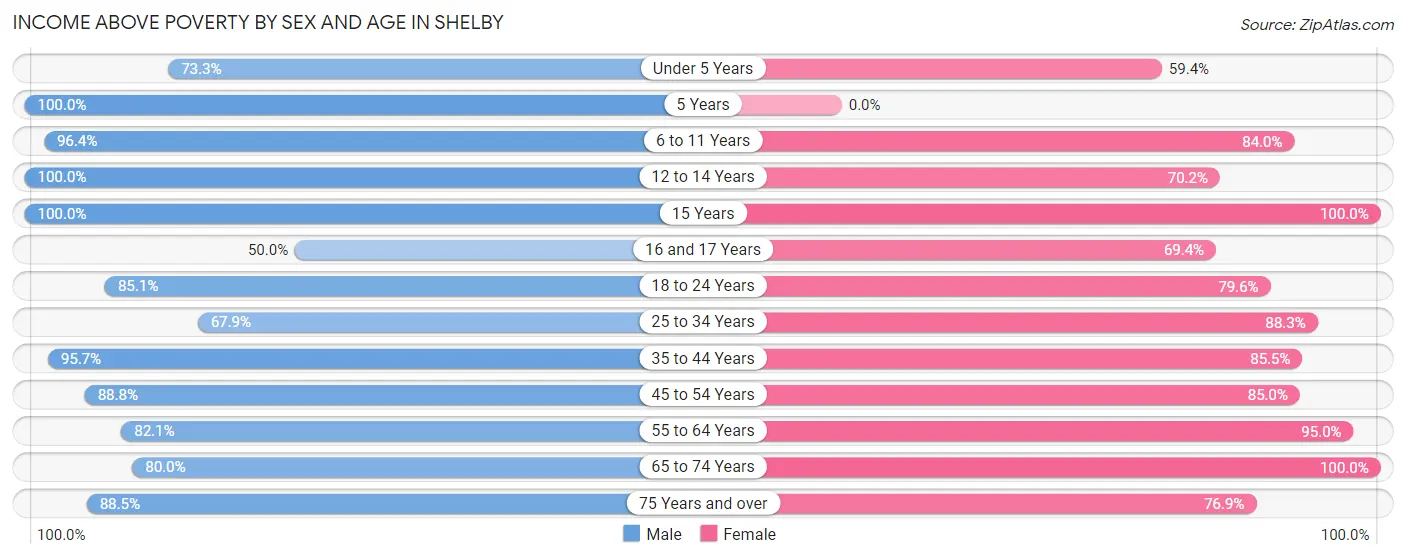
| Age Bracket | Male | Female |
| Under 5 Years | 66 (73.3%) | 41 (59.4%) |
| 5 Years | 27 (100.0%) | 0 (0.0%) |
| 6 to 11 Years | 134 (96.4%) | 173 (84.0%) |
| 12 to 14 Years | 39 (100.0%) | 47 (70.2%) |
| 15 Years | 30 (100.0%) | 40 (100.0%) |
| 16 and 17 Years | 9 (50.0%) | 25 (69.4%) |
| 18 to 24 Years | 57 (85.1%) | 109 (79.6%) |
| 25 to 34 Years | 152 (67.9%) | 166 (88.3%) |
| 35 to 44 Years | 155 (95.7%) | 159 (85.5%) |
| 45 to 54 Years | 159 (88.8%) | 85 (85.0%) |
| 55 to 64 Years | 64 (82.1%) | 132 (95.0%) |
| 65 to 74 Years | 88 (80.0%) | 85 (100.0%) |
| 75 Years and over | 23 (88.5%) | 50 (76.9%) |
| Total | 1,003 (84.4%) | 1,112 (84.1%) |
Income Below Poverty Among Married-Couple Families in Shelby
The poverty statistics for married-couple families in Shelby show that 8.2% or 27 of the total 329 families live below the poverty line. Families with 5 or more children have the highest poverty rate of 100.0%, comprising of 8 families. On the other hand, families with no children have the lowest poverty rate of 2.4%, which includes 4 families.
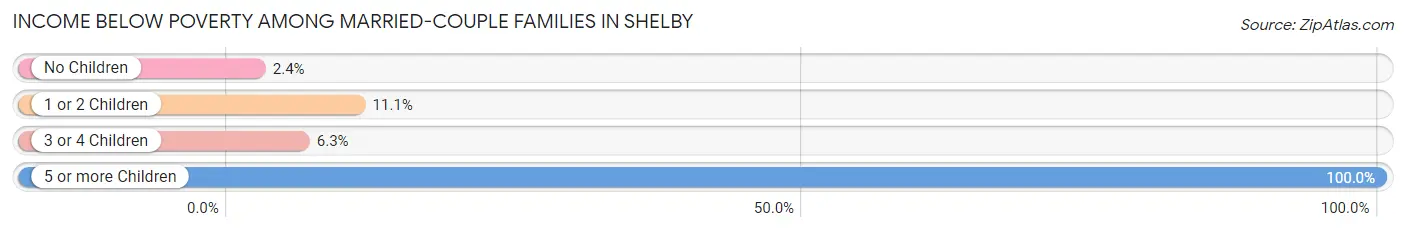
| Children | Above Poverty | Below Poverty |
| No Children | 161 (97.6%) | 4 (2.4%) |
| 1 or 2 Children | 96 (88.9%) | 12 (11.1%) |
| 3 or 4 Children | 45 (93.8%) | 3 (6.2%) |
| 5 or more Children | 0 (0.0%) | 8 (100.0%) |
| Total | 302 (91.8%) | 27 (8.2%) |
Income Below Poverty Among Single-Parent Households in Shelby
According to the poverty data in Shelby, 16.5% or 14 single-father households and 14.7% or 25 single-mother households are living below the poverty line. Among single-father households, those with no children have the highest poverty rate, with 14 households (51.8%) experiencing poverty. Likewise, among single-mother households, those with 3 or 4 children have the highest poverty rate, with 14 households (45.2%) falling below the poverty line.
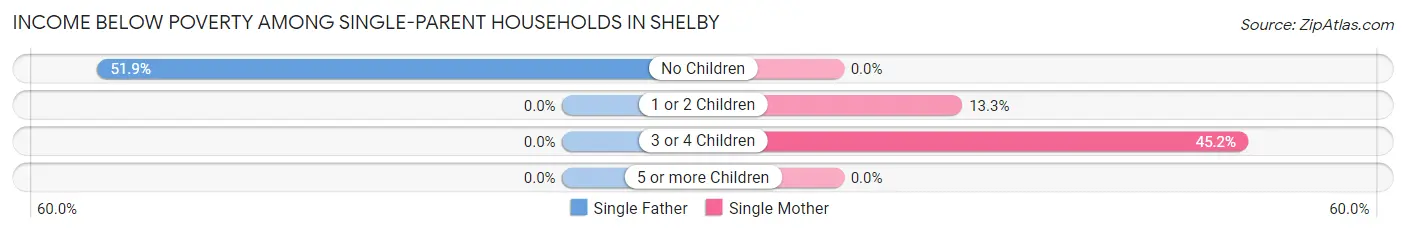
| Children | Single Father | Single Mother |
| No Children | 14 (51.8%) | 0 (0.0%) |
| 1 or 2 Children | 0 (0.0%) | 11 (13.3%) |
| 3 or 4 Children | 0 (0.0%) | 14 (45.2%) |
| 5 or more Children | 0 (0.0%) | 0 (0.0%) |
| Total | 14 (16.5%) | 25 (14.7%) |
Income Below Poverty Among Married-Couple vs Single-Parent Households in Shelby
The poverty data for Shelby shows that 27 of the married-couple family households (8.2%) and 39 of the single-parent households (15.3%) are living below the poverty level. Within the married-couple family households, those with 5 or more children have the highest poverty rate, with 8 households (100.0%) falling below the poverty line. Among the single-parent households, those with 3 or 4 children have the highest poverty rate, with 14 household (22.6%) living below poverty.
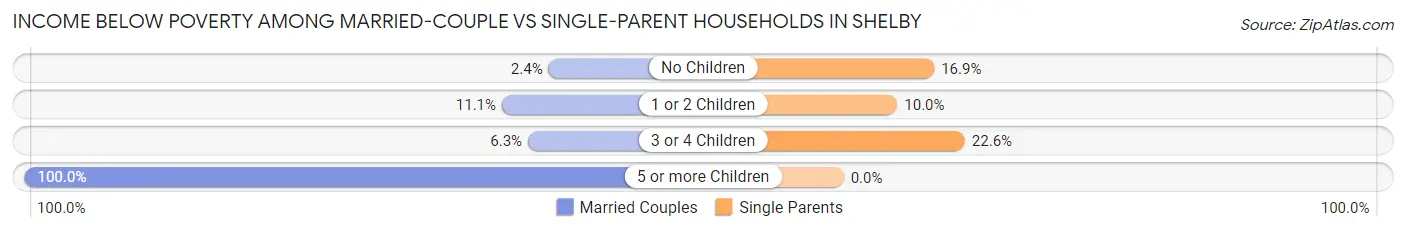
| Children | Married-Couple Families | Single-Parent Households |
| No Children | 4 (2.4%) | 14 (16.9%) |
| 1 or 2 Children | 12 (11.1%) | 11 (10.0%) |
| 3 or 4 Children | 3 (6.2%) | 14 (22.6%) |
| 5 or more Children | 8 (100.0%) | 0 (0.0%) |
| Total | 27 (8.2%) | 39 (15.3%) |
Employment Characteristics in Shelby
Employment by Class of Employer in Shelby
Among the 1,122 employed individuals in Shelby, private company employees (873 | 77.8%), self-employed (not incorporated) (58 | 5.2%), and local government employees (58 | 5.2%) make up the most common classes of employment.
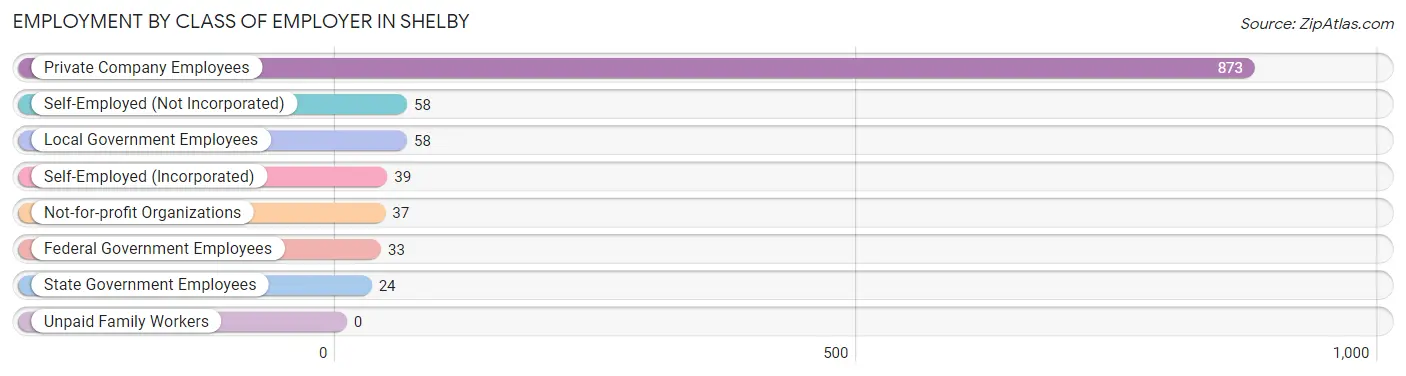
| Employer Class | # Employees | % Employees |
| Private Company Employees | 873 | 77.8% |
| Self-Employed (Incorporated) | 39 | 3.5% |
| Self-Employed (Not Incorporated) | 58 | 5.2% |
| Not-for-profit Organizations | 37 | 3.3% |
| Local Government Employees | 58 | 5.2% |
| State Government Employees | 24 | 2.1% |
| Federal Government Employees | 33 | 2.9% |
| Unpaid Family Workers | 0 | 0.0% |
| Total | 1,122 | 100.0% |
Employment Status by Age in Shelby
According to the labor force statistics for Shelby, out of the total population over 16 years of age (1,800), 65.1% or 1,172 individuals are in the labor force, with 4.2% or 49 of them unemployed. The age group with the highest labor force participation rate is 55 to 59 years, with 94.0% or 79 individuals in the labor force. Within the labor force, the 16 to 19 years age range has the highest percentage of unemployed individuals, with 18.0% or 9 of them being unemployed.
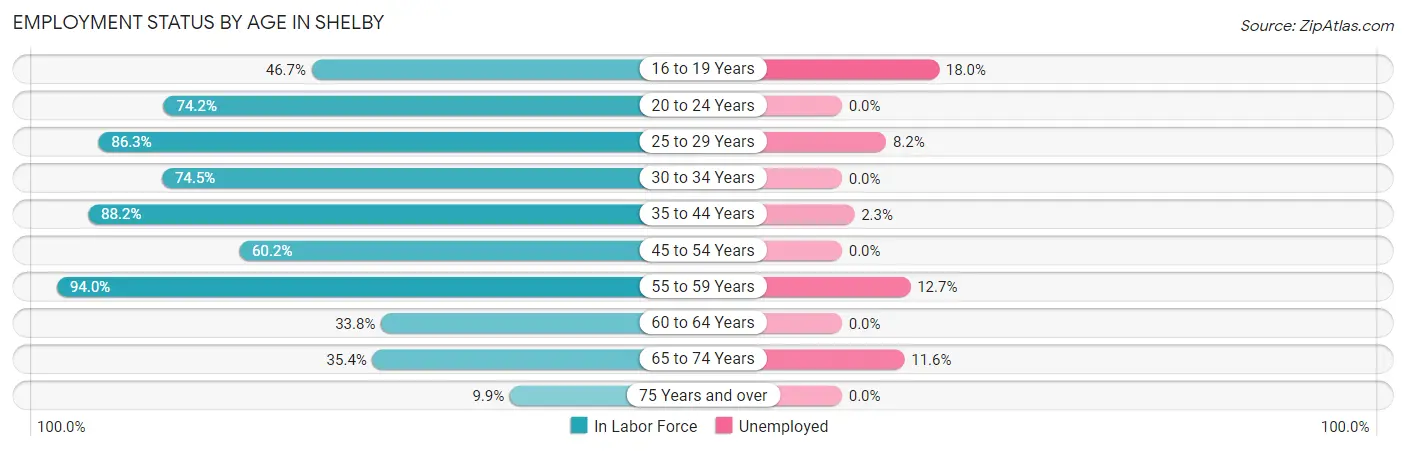
| Age Bracket | In Labor Force | Unemployed |
| 16 to 19 Years | 50 (46.7%) | 9 (18.0%) |
| 20 to 24 Years | 112 (74.2%) | 0 (0.0%) |
| 25 to 29 Years | 183 (86.3%) | 15 (8.2%) |
| 30 to 34 Years | 149 (74.5%) | 0 (0.0%) |
| 35 to 44 Years | 307 (88.2%) | 7 (2.3%) |
| 45 to 54 Years | 168 (60.2%) | 0 (0.0%) |
| 55 to 59 Years | 79 (94.0%) | 10 (12.7%) |
| 60 to 64 Years | 45 (33.8%) | 0 (0.0%) |
| 65 to 74 Years | 69 (35.4%) | 8 (11.6%) |
| 75 Years and over | 9 (9.9%) | 0 (0.0%) |
| Total | 1,172 (65.1%) | 49 (4.2%) |
Employment Status by Educational Attainment in Shelby
According to labor force statistics for Shelby, 74.1% of individuals (931) out of the total population between 25 and 64 years of age (1,256) are in the labor force, with 3.4% or 32 of them being unemployed. The group with the highest labor force participation rate are those with the educational attainment of bachelor's degree or higher, with 82.2% or 139 individuals in the labor force. Within the labor force, individuals with college / associate degree education have the highest percentage of unemployment, with 9.1% or 21 of them being unemployed.
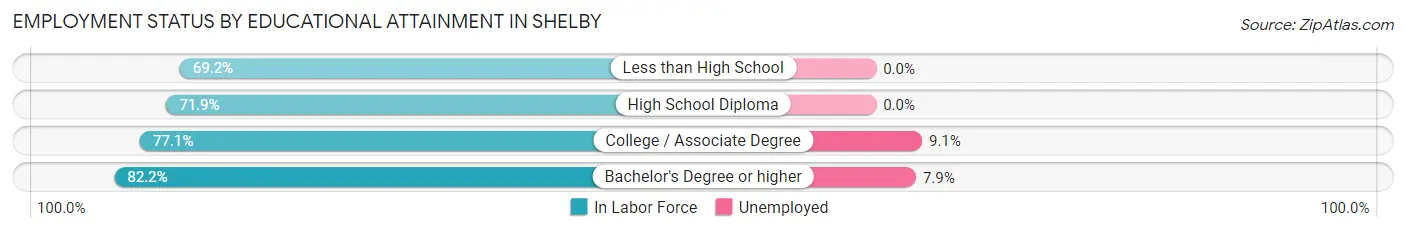
| Educational Attainment | In Labor Force | Unemployed |
| Less than High School | 128 (69.2%) | 0 (0.0%) |
| High School Diploma | 432 (71.9%) | 0 (0.0%) |
| College / Associate Degree | 232 (77.1%) | 27 (9.1%) |
| Bachelor's Degree or higher | 139 (82.2%) | 13 (7.9%) |
| Total | 931 (74.1%) | 43 (3.4%) |
Employment Occupations by Sex in Shelby
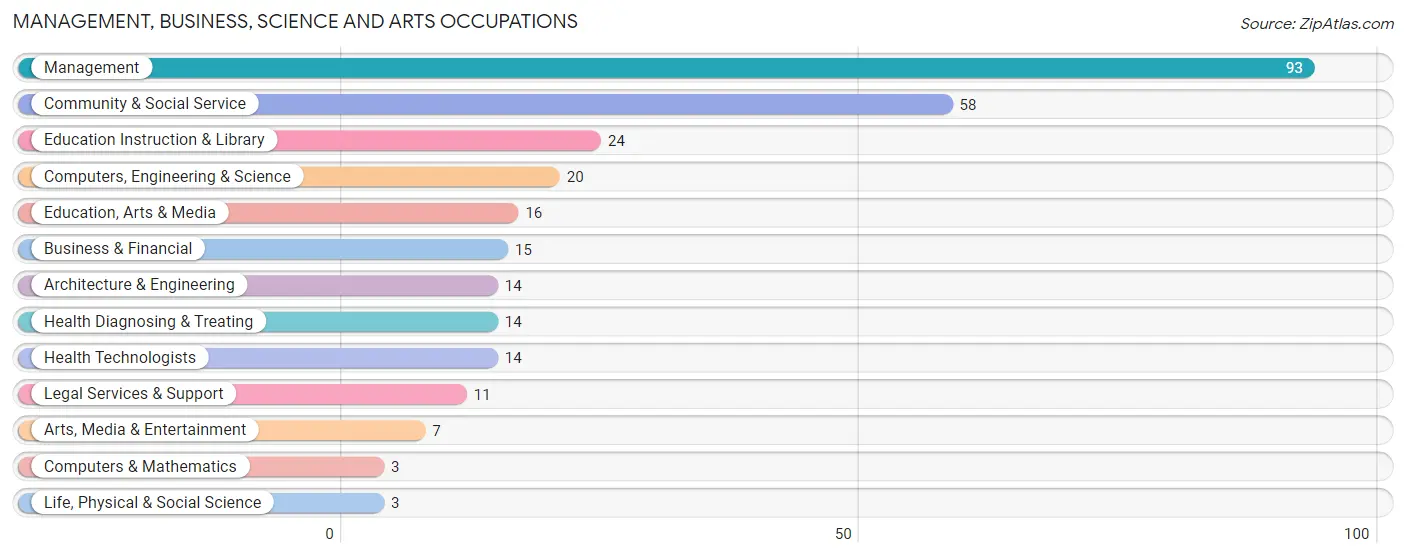
Management, Business, Science and Arts Occupations
The most common Management, Business, Science and Arts occupations in Shelby are Management (93 | 8.3%), Community & Social Service (58 | 5.2%), Education Instruction & Library (24 | 2.1%), Computers, Engineering & Science (20 | 1.8%), and Education, Arts & Media (16 | 1.4%).
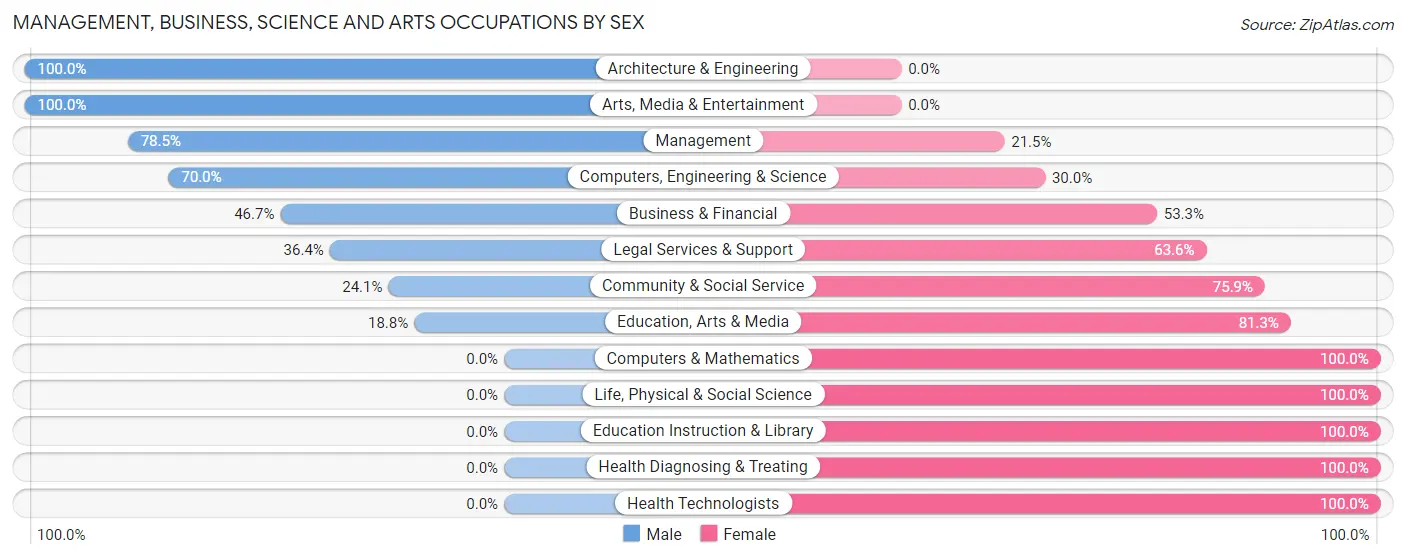
Management, Business, Science and Arts Occupations by Sex
Within the Management, Business, Science and Arts occupations in Shelby, the most male-oriented occupations are Architecture & Engineering (100.0%), Arts, Media & Entertainment (100.0%), and Management (78.5%), while the most female-oriented occupations are Computers & Mathematics (100.0%), Life, Physical & Social Science (100.0%), and Education Instruction & Library (100.0%).
| Occupation | Male | Female |
| Management | 73 (78.5%) | 20 (21.5%) |
| Business & Financial | 7 (46.7%) | 8 (53.3%) |
| Computers, Engineering & Science | 14 (70.0%) | 6 (30.0%) |
| Computers & Mathematics | 0 (0.0%) | 3 (100.0%) |
| Architecture & Engineering | 14 (100.0%) | 0 (0.0%) |
| Life, Physical & Social Science | 0 (0.0%) | 3 (100.0%) |
| Community & Social Service | 14 (24.1%) | 44 (75.9%) |
| Education, Arts & Media | 3 (18.8%) | 13 (81.2%) |
| Legal Services & Support | 4 (36.4%) | 7 (63.6%) |
| Education Instruction & Library | 0 (0.0%) | 24 (100.0%) |
| Arts, Media & Entertainment | 7 (100.0%) | 0 (0.0%) |
| Health Diagnosing & Treating | 0 (0.0%) | 14 (100.0%) |
| Health Technologists | 0 (0.0%) | 14 (100.0%) |
| Total (Category) | 108 (54.0%) | 92 (46.0%) |
| Total (Overall) | 580 (51.7%) | 542 (48.3%) |
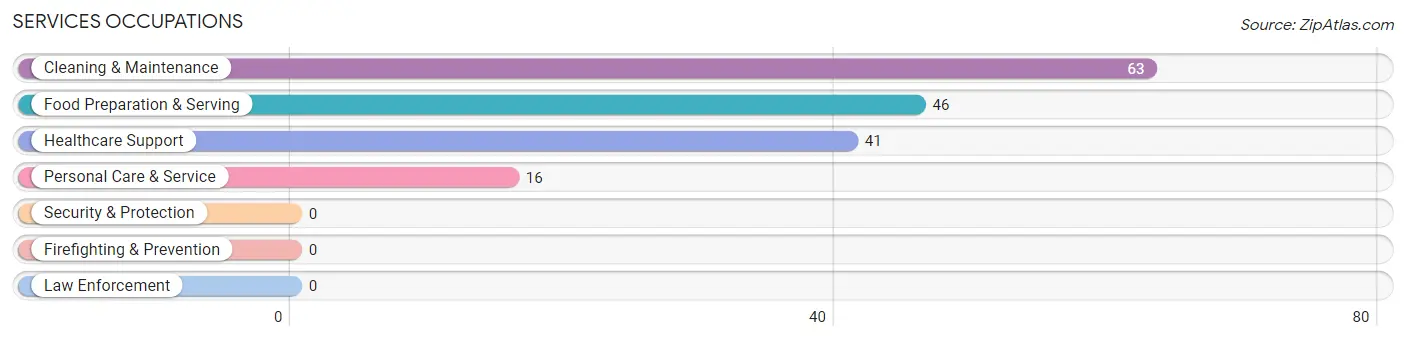
Services Occupations
The most common Services occupations in Shelby are Cleaning & Maintenance (63 | 5.6%), Food Preparation & Serving (46 | 4.1%), Healthcare Support (41 | 3.6%), and Personal Care & Service (16 | 1.4%).
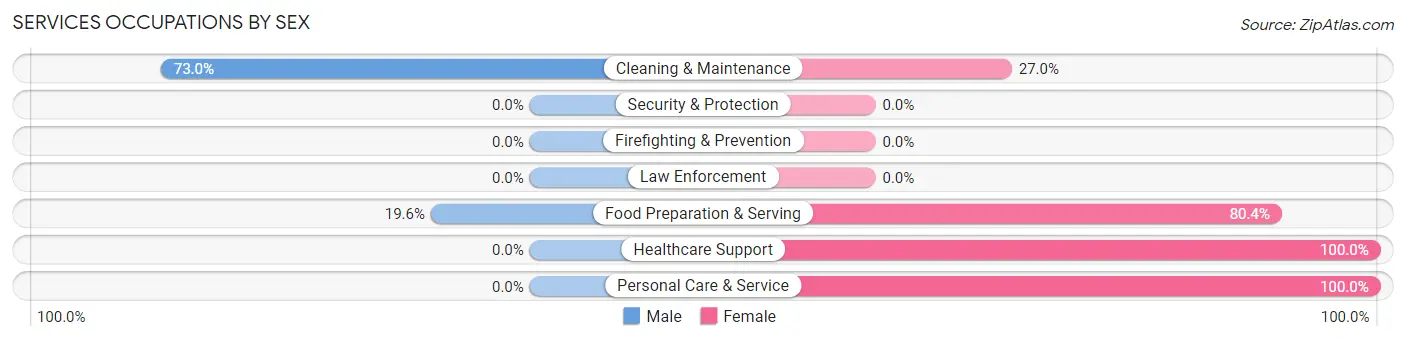
Services Occupations by Sex
Within the Services occupations in Shelby, the most male-oriented occupations are Cleaning & Maintenance (73.0%), and Food Preparation & Serving (19.6%), while the most female-oriented occupations are Healthcare Support (100.0%), Personal Care & Service (100.0%), and Food Preparation & Serving (80.4%).
| Occupation | Male | Female |
| Healthcare Support | 0 (0.0%) | 41 (100.0%) |
| Security & Protection | 0 (0.0%) | 0 (0.0%) |
| Firefighting & Prevention | 0 (0.0%) | 0 (0.0%) |
| Law Enforcement | 0 (0.0%) | 0 (0.0%) |
| Food Preparation & Serving | 9 (19.6%) | 37 (80.4%) |
| Cleaning & Maintenance | 46 (73.0%) | 17 (27.0%) |
| Personal Care & Service | 0 (0.0%) | 16 (100.0%) |
| Total (Category) | 55 (33.1%) | 111 (66.9%) |
| Total (Overall) | 580 (51.7%) | 542 (48.3%) |
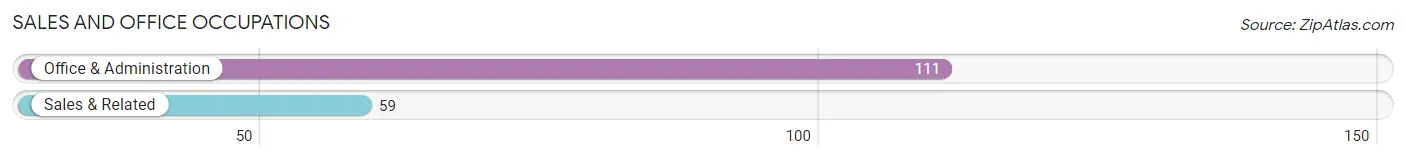
Sales and Office Occupations
The most common Sales and Office occupations in Shelby are Office & Administration (111 | 9.9%), and Sales & Related (59 | 5.3%).
Sales and Office Occupations by Sex
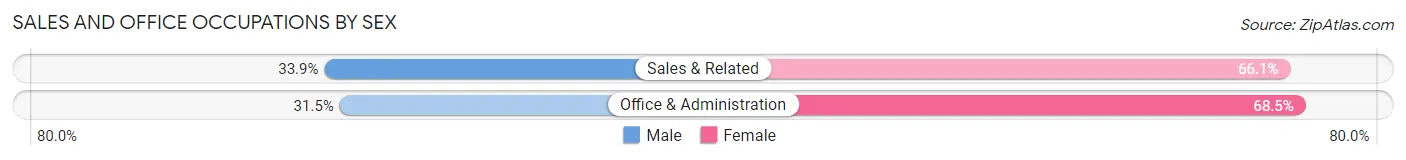
| Occupation | Male | Female |
| Sales & Related | 20 (33.9%) | 39 (66.1%) |
| Office & Administration | 35 (31.5%) | 76 (68.5%) |
| Total (Category) | 55 (32.4%) | 115 (67.6%) |
| Total (Overall) | 580 (51.7%) | 542 (48.3%) |
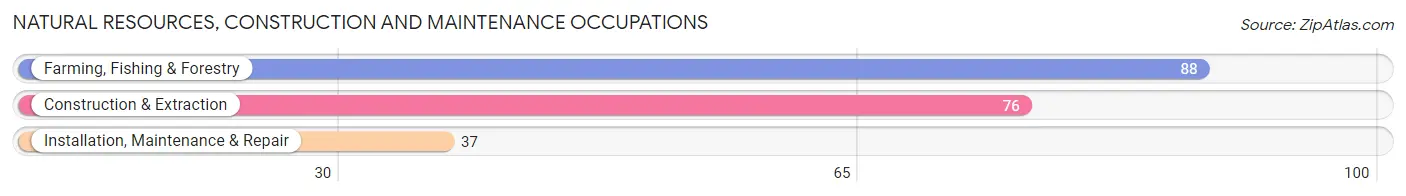
Natural Resources, Construction and Maintenance Occupations
The most common Natural Resources, Construction and Maintenance occupations in Shelby are Farming, Fishing & Forestry (88 | 7.8%), Construction & Extraction (76 | 6.8%), and Installation, Maintenance & Repair (37 | 3.3%).
Natural Resources, Construction and Maintenance Occupations by Sex
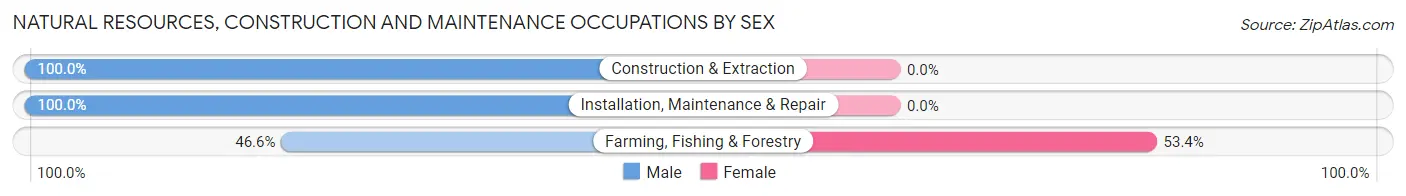
| Occupation | Male | Female |
| Farming, Fishing & Forestry | 41 (46.6%) | 47 (53.4%) |
| Construction & Extraction | 76 (100.0%) | 0 (0.0%) |
| Installation, Maintenance & Repair | 37 (100.0%) | 0 (0.0%) |
| Total (Category) | 154 (76.6%) | 47 (23.4%) |
| Total (Overall) | 580 (51.7%) | 542 (48.3%) |
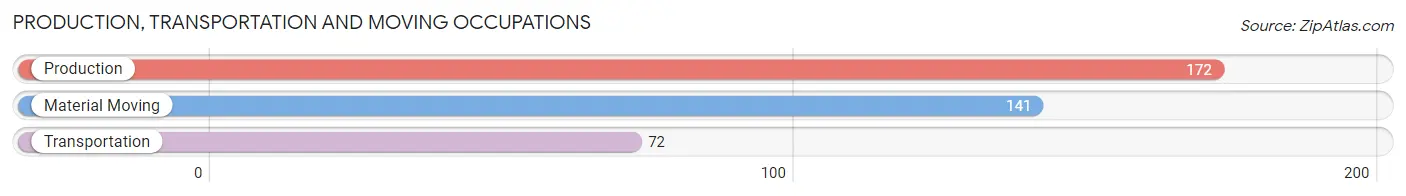
Production, Transportation and Moving Occupations
The most common Production, Transportation and Moving occupations in Shelby are Production (172 | 15.3%), Material Moving (141 | 12.6%), and Transportation (72 | 6.4%).
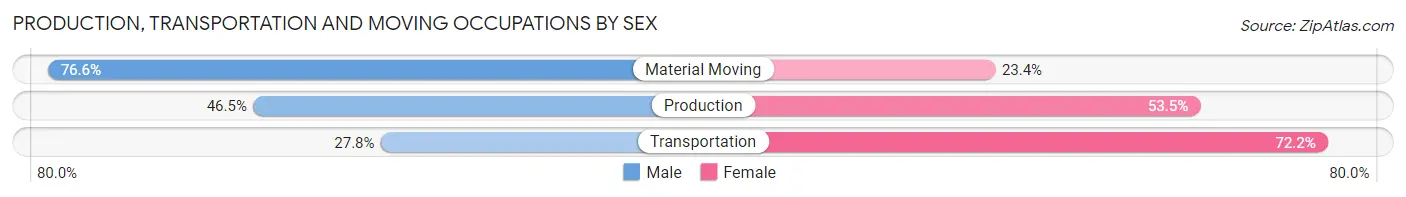
Production, Transportation and Moving Occupations by Sex
| Occupation | Male | Female |
| Production | 80 (46.5%) | 92 (53.5%) |
| Transportation | 20 (27.8%) | 52 (72.2%) |
| Material Moving | 108 (76.6%) | 33 (23.4%) |
| Total (Category) | 208 (54.0%) | 177 (46.0%) |
| Total (Overall) | 580 (51.7%) | 542 (48.3%) |
Employment Industries by Sex in Shelby
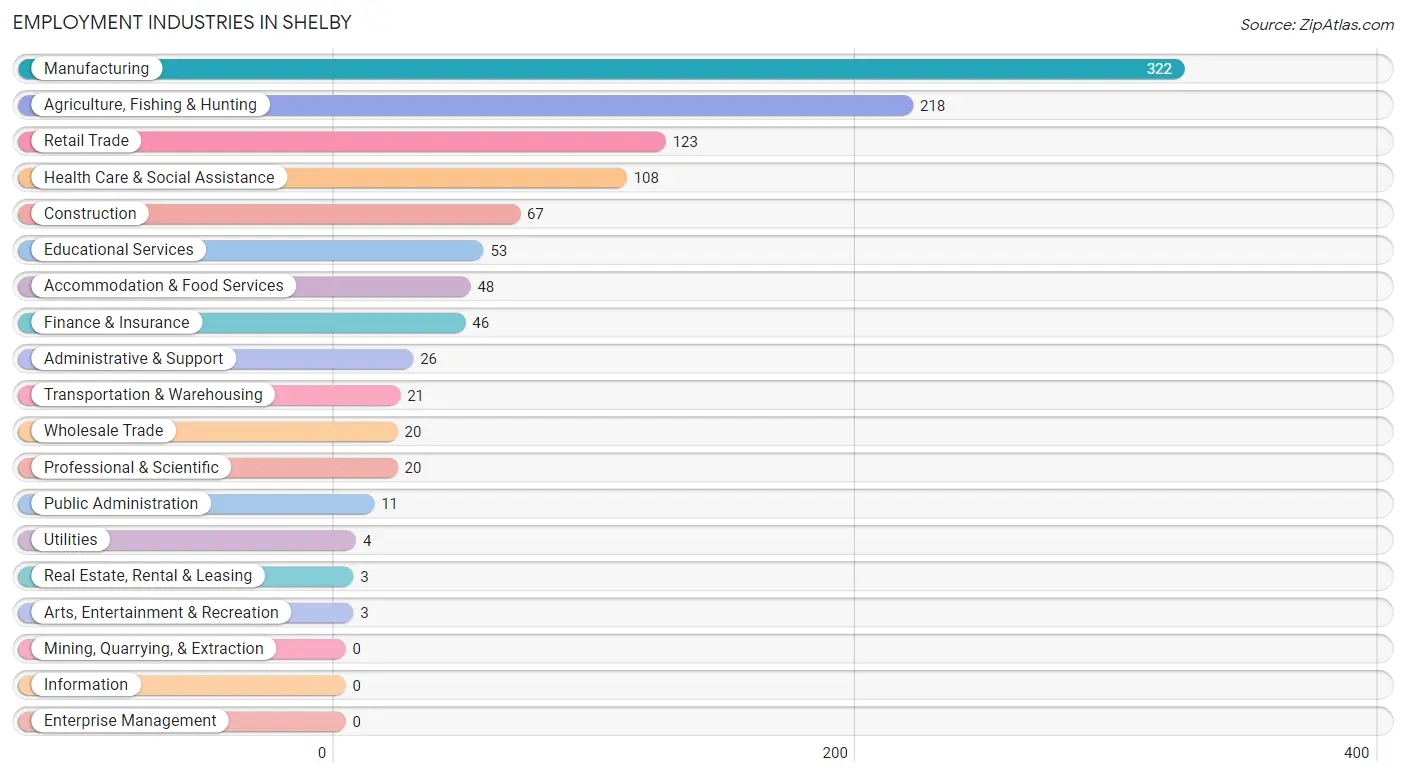
Employment Industries in Shelby
The major employment industries in Shelby include Manufacturing (322 | 28.7%), Agriculture, Fishing & Hunting (218 | 19.4%), Retail Trade (123 | 11.0%), Health Care & Social Assistance (108 | 9.6%), and Construction (67 | 6.0%).
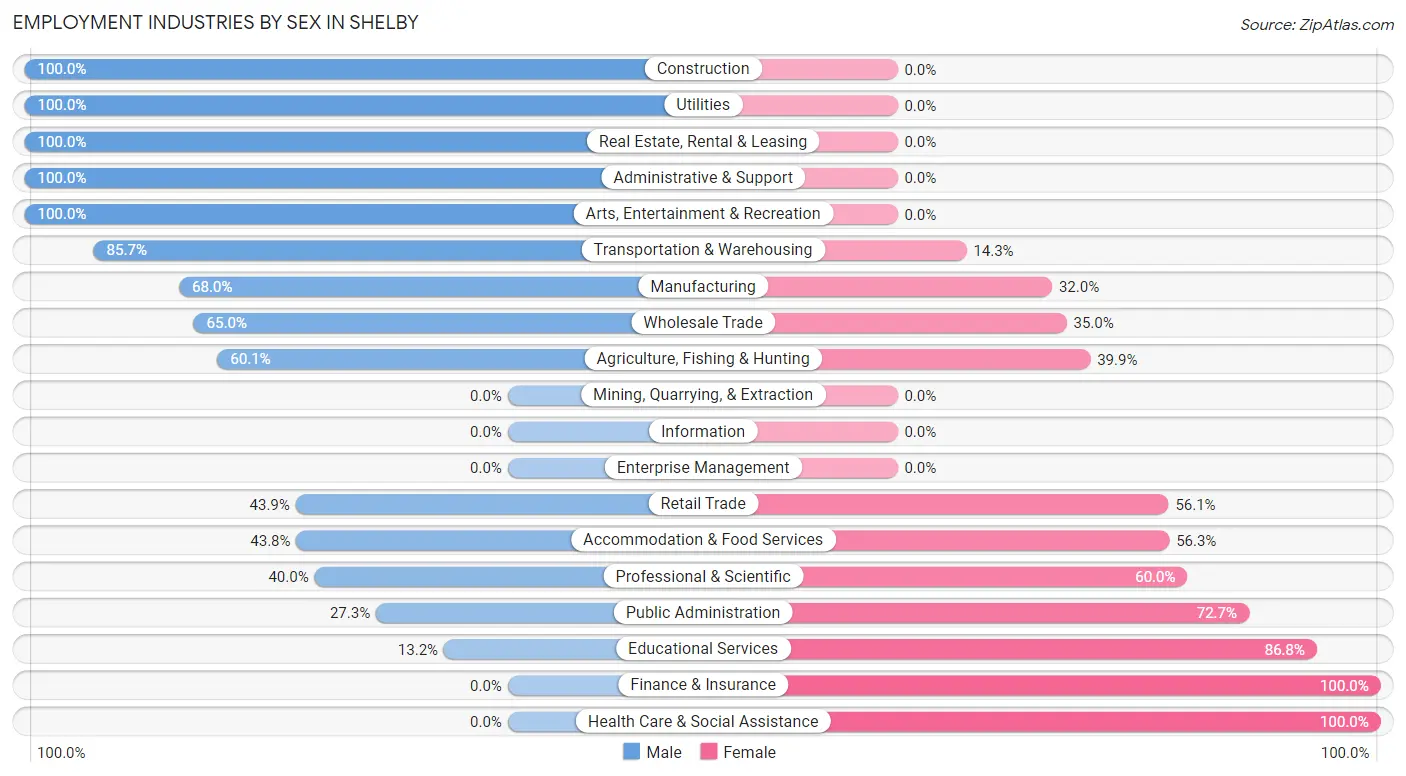
Employment Industries by Sex in Shelby
The Shelby industries that see more men than women are Construction (100.0%), Utilities (100.0%), and Real Estate, Rental & Leasing (100.0%), whereas the industries that tend to have a higher number of women are Finance & Insurance (100.0%), Health Care & Social Assistance (100.0%), and Educational Services (86.8%).
| Industry | Male | Female |
| Agriculture, Fishing & Hunting | 131 (60.1%) | 87 (39.9%) |
| Mining, Quarrying, & Extraction | 0 (0.0%) | 0 (0.0%) |
| Construction | 67 (100.0%) | 0 (0.0%) |
| Manufacturing | 219 (68.0%) | 103 (32.0%) |
| Wholesale Trade | 13 (65.0%) | 7 (35.0%) |
| Retail Trade | 54 (43.9%) | 69 (56.1%) |
| Transportation & Warehousing | 18 (85.7%) | 3 (14.3%) |
| Utilities | 4 (100.0%) | 0 (0.0%) |
| Information | 0 (0.0%) | 0 (0.0%) |
| Finance & Insurance | 0 (0.0%) | 46 (100.0%) |
| Real Estate, Rental & Leasing | 3 (100.0%) | 0 (0.0%) |
| Professional & Scientific | 8 (40.0%) | 12 (60.0%) |
| Enterprise Management | 0 (0.0%) | 0 (0.0%) |
| Administrative & Support | 26 (100.0%) | 0 (0.0%) |
| Educational Services | 7 (13.2%) | 46 (86.8%) |
| Health Care & Social Assistance | 0 (0.0%) | 108 (100.0%) |
| Arts, Entertainment & Recreation | 3 (100.0%) | 0 (0.0%) |
| Accommodation & Food Services | 21 (43.8%) | 27 (56.2%) |
| Public Administration | 3 (27.3%) | 8 (72.7%) |
| Total | 580 (51.7%) | 542 (48.3%) |
Education in Shelby
School Enrollment in Shelby
The most common levels of schooling among the 764 students in Shelby are elementary school (235 | 30.8%), high school (166 | 21.7%), and middle school (135 | 17.7%).
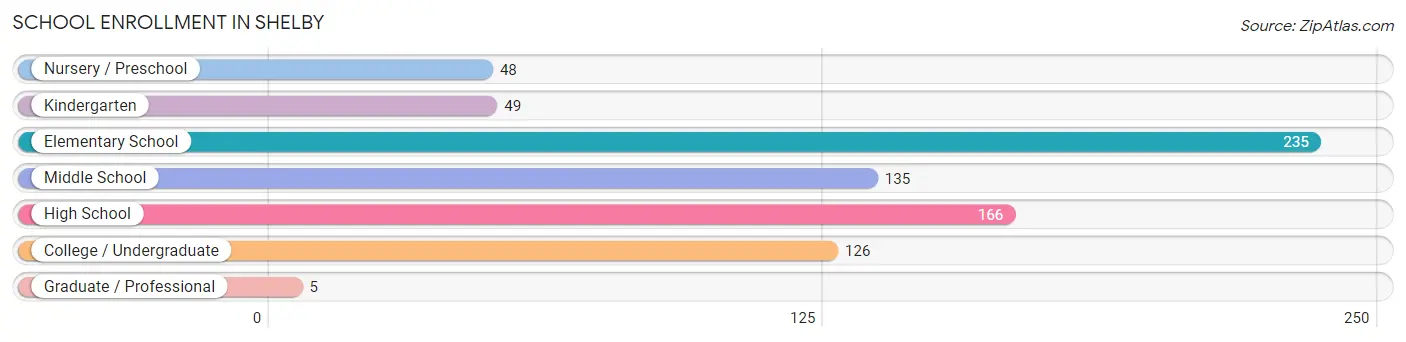
| School Level | # Students | % Students |
| Nursery / Preschool | 48 | 6.3% |
| Kindergarten | 49 | 6.4% |
| Elementary School | 235 | 30.8% |
| Middle School | 135 | 17.7% |
| High School | 166 | 21.7% |
| College / Undergraduate | 126 | 16.5% |
| Graduate / Professional | 5 | 0.6% |
| Total | 764 | 100.0% |
School Enrollment by Age by Funding Source in Shelby
Out of a total of 764 students who are enrolled in schools in Shelby, 31 (4.1%) attend a private institution, while the remaining 733 (95.9%) are enrolled in public schools. The age group of 25 to 34 year olds has the highest likelihood of being enrolled in private schools, with 16 (100.0% in the age bracket) enrolled. Conversely, the age group of 5 to 9 year old has the lowest likelihood of being enrolled in a private school, with 305 (100.0% in the age bracket) attending a public institution.
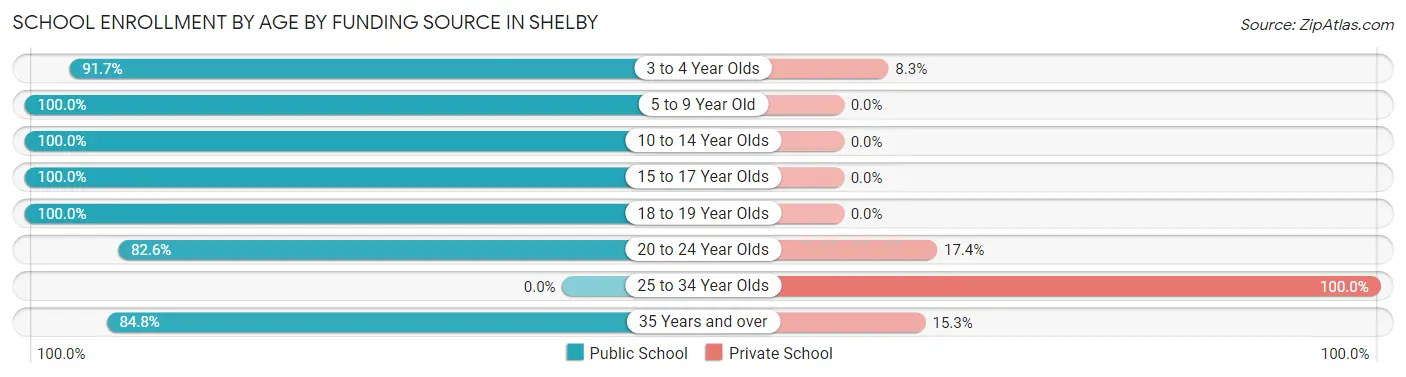
| Age Bracket | Public School | Private School |
| 3 to 4 Year Olds | 22 (91.7%) | 2 (8.3%) |
| 5 to 9 Year Old | 305 (100.0%) | 0 (0.0%) |
| 10 to 14 Year Olds | 177 (100.0%) | 0 (0.0%) |
| 15 to 17 Year Olds | 124 (100.0%) | 0 (0.0%) |
| 18 to 19 Year Olds | 36 (100.0%) | 0 (0.0%) |
| 20 to 24 Year Olds | 19 (82.6%) | 4 (17.4%) |
| 25 to 34 Year Olds | 0 (0.0%) | 16 (100.0%) |
| 35 Years and over | 50 (84.8%) | 9 (15.2%) |
| Total | 733 (95.9%) | 31 (4.1%) |
Educational Attainment by Field of Study in Shelby
Business (39 | 17.4%), computers & mathematics (30 | 13.4%), science & technology (26 | 11.6%), psychology (16 | 7.1%), and education (15 | 6.7%) are the most common fields of study among 224 individuals in Shelby who have obtained a bachelor's degree or higher.
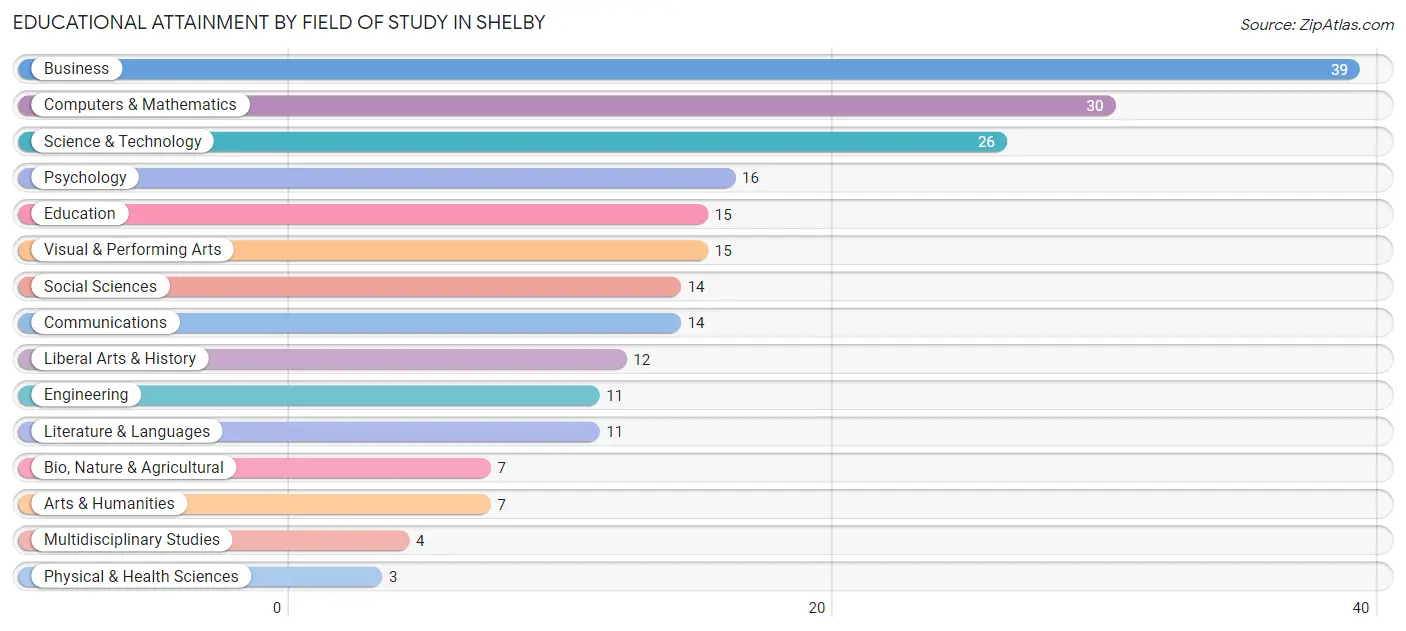
| Field of Study | # Graduates | % Graduates |
| Computers & Mathematics | 30 | 13.4% |
| Bio, Nature & Agricultural | 7 | 3.1% |
| Physical & Health Sciences | 3 | 1.3% |
| Psychology | 16 | 7.1% |
| Social Sciences | 14 | 6.2% |
| Engineering | 11 | 4.9% |
| Multidisciplinary Studies | 4 | 1.8% |
| Science & Technology | 26 | 11.6% |
| Business | 39 | 17.4% |
| Education | 15 | 6.7% |
| Literature & Languages | 11 | 4.9% |
| Liberal Arts & History | 12 | 5.4% |
| Visual & Performing Arts | 15 | 6.7% |
| Communications | 14 | 6.2% |
| Arts & Humanities | 7 | 3.1% |
| Total | 224 | 100.0% |
Transportation & Commute in Shelby
Vehicle Availability by Sex in Shelby
The most prevalent vehicle ownership categories in Shelby are males with 2 vehicles (287, accounting for 49.5%) and females with 2 vehicles (255, making up 52.9%).
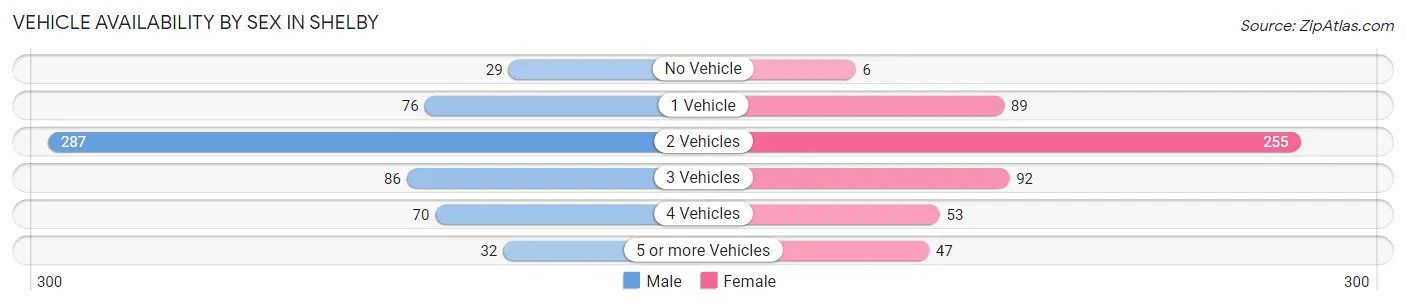
| Vehicles Available | Male | Female |
| No Vehicle | 29 (5.0%) | 6 (1.1%) |
| 1 Vehicle | 76 (13.1%) | 89 (16.4%) |
| 2 Vehicles | 287 (49.5%) | 255 (47.0%) |
| 3 Vehicles | 86 (14.8%) | 92 (17.0%) |
| 4 Vehicles | 70 (12.1%) | 53 (9.8%) |
| 5 or more Vehicles | 32 (5.5%) | 47 (8.7%) |
| Total | 580 (100.0%) | 542 (100.0%) |
Commute Time in Shelby
The most frequently occuring commute durations in Shelby are 5 to 9 minutes (360 commuters, 32.8%), 10 to 14 minutes (267 commuters, 24.3%), and 20 to 24 minutes (124 commuters, 11.3%).
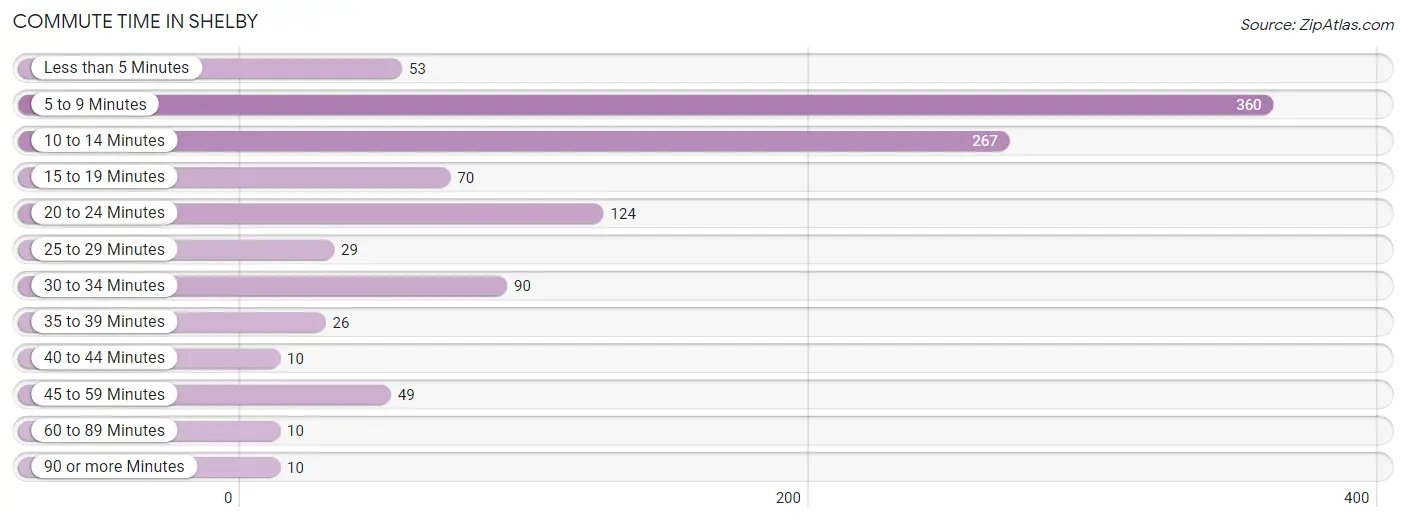
| Commute Time | # Commuters | % Commuters |
| Less than 5 Minutes | 53 | 4.8% |
| 5 to 9 Minutes | 360 | 32.8% |
| 10 to 14 Minutes | 267 | 24.3% |
| 15 to 19 Minutes | 70 | 6.4% |
| 20 to 24 Minutes | 124 | 11.3% |
| 25 to 29 Minutes | 29 | 2.6% |
| 30 to 34 Minutes | 90 | 8.2% |
| 35 to 39 Minutes | 26 | 2.4% |
| 40 to 44 Minutes | 10 | 0.9% |
| 45 to 59 Minutes | 49 | 4.5% |
| 60 to 89 Minutes | 10 | 0.9% |
| 90 or more Minutes | 10 | 0.9% |
Commute Time by Sex in Shelby
The most common commute times in Shelby are 5 to 9 minutes (177 commuters, 31.7%) for males and 5 to 9 minutes (183 commuters, 34.0%) for females.
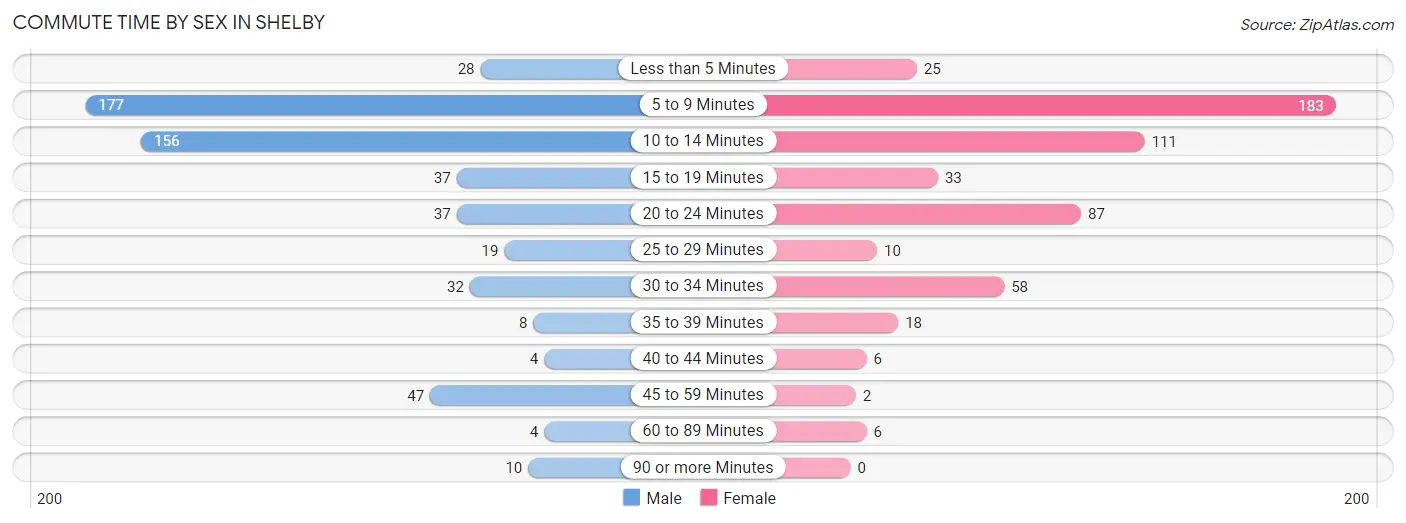
| Commute Time | Male | Female |
| Less than 5 Minutes | 28 (5.0%) | 25 (4.6%) |
| 5 to 9 Minutes | 177 (31.7%) | 183 (34.0%) |
| 10 to 14 Minutes | 156 (27.9%) | 111 (20.6%) |
| 15 to 19 Minutes | 37 (6.6%) | 33 (6.1%) |
| 20 to 24 Minutes | 37 (6.6%) | 87 (16.1%) |
| 25 to 29 Minutes | 19 (3.4%) | 10 (1.9%) |
| 30 to 34 Minutes | 32 (5.7%) | 58 (10.8%) |
| 35 to 39 Minutes | 8 (1.4%) | 18 (3.3%) |
| 40 to 44 Minutes | 4 (0.7%) | 6 (1.1%) |
| 45 to 59 Minutes | 47 (8.4%) | 2 (0.4%) |
| 60 to 89 Minutes | 4 (0.7%) | 6 (1.1%) |
| 90 or more Minutes | 10 (1.8%) | 0 (0.0%) |
Time of Departure to Work by Sex in Shelby
The most frequent times of departure to work in Shelby are 5:30 AM to 5:59 AM (94, 16.8%) for males and 5:30 AM to 5:59 AM (133, 24.7%) for females.
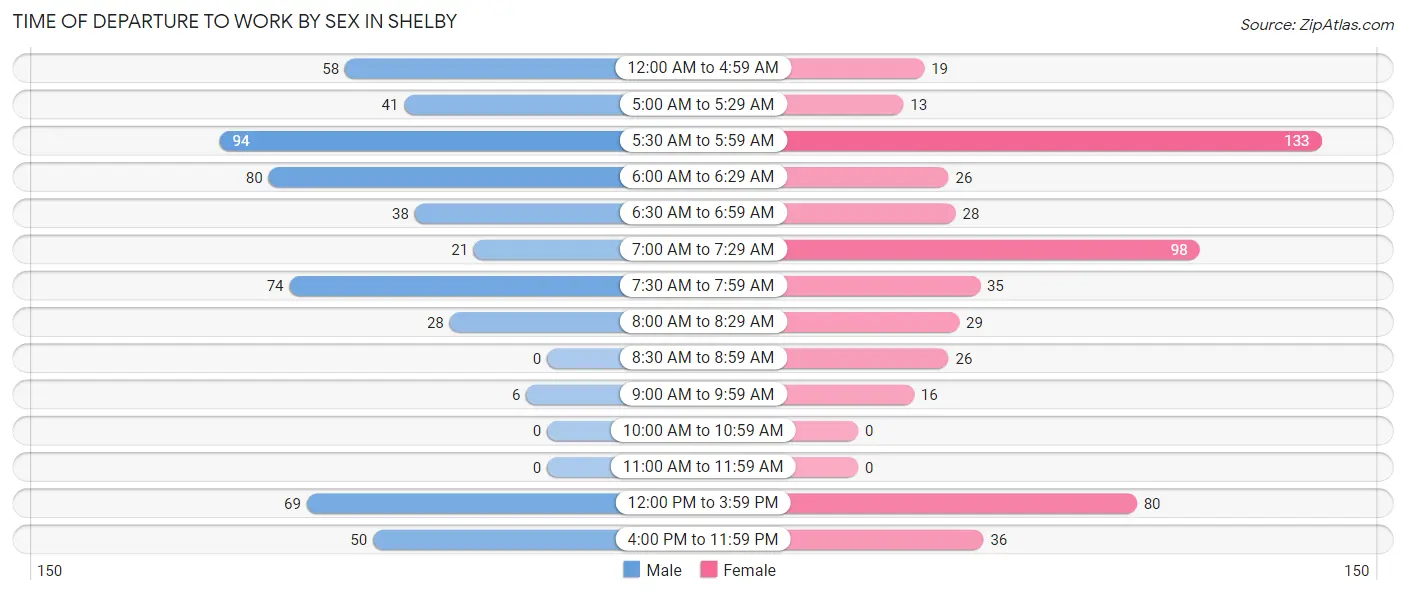
| Time of Departure | Male | Female |
| 12:00 AM to 4:59 AM | 58 (10.4%) | 19 (3.5%) |
| 5:00 AM to 5:29 AM | 41 (7.3%) | 13 (2.4%) |
| 5:30 AM to 5:59 AM | 94 (16.8%) | 133 (24.7%) |
| 6:00 AM to 6:29 AM | 80 (14.3%) | 26 (4.8%) |
| 6:30 AM to 6:59 AM | 38 (6.8%) | 28 (5.2%) |
| 7:00 AM to 7:29 AM | 21 (3.8%) | 98 (18.2%) |
| 7:30 AM to 7:59 AM | 74 (13.2%) | 35 (6.5%) |
| 8:00 AM to 8:29 AM | 28 (5.0%) | 29 (5.4%) |
| 8:30 AM to 8:59 AM | 0 (0.0%) | 26 (4.8%) |
| 9:00 AM to 9:59 AM | 6 (1.1%) | 16 (3.0%) |
| 10:00 AM to 10:59 AM | 0 (0.0%) | 0 (0.0%) |
| 11:00 AM to 11:59 AM | 0 (0.0%) | 0 (0.0%) |
| 12:00 PM to 3:59 PM | 69 (12.3%) | 80 (14.8%) |
| 4:00 PM to 11:59 PM | 50 (8.9%) | 36 (6.7%) |
| Total | 559 (100.0%) | 539 (100.0%) |
Housing Occupancy in Shelby
Occupancy by Ownership in Shelby
Of the total 824 dwellings in Shelby, owner-occupied units account for 562 (68.2%), while renter-occupied units make up 262 (31.8%).
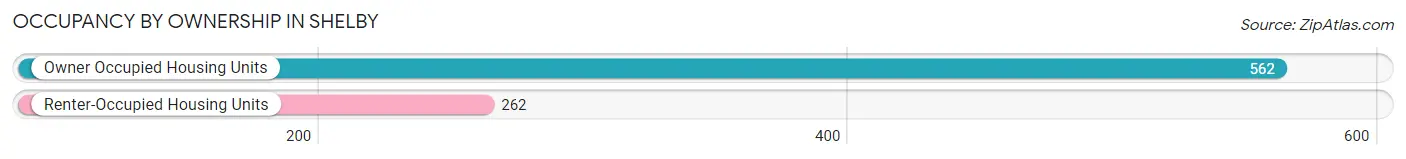
| Occupancy | # Housing Units | % Housing Units |
| Owner Occupied Housing Units | 562 | 68.2% |
| Renter-Occupied Housing Units | 262 | 31.8% |
| Total Occupied Housing Units | 824 | 100.0% |
Occupancy by Household Size in Shelby
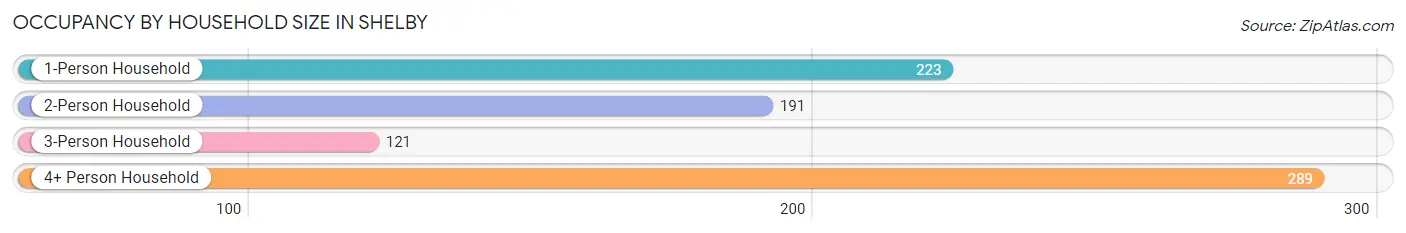
| Household Size | # Housing Units | % Housing Units |
| 1-Person Household | 223 | 27.1% |
| 2-Person Household | 191 | 23.2% |
| 3-Person Household | 121 | 14.7% |
| 4+ Person Household | 289 | 35.1% |
| Total Housing Units | 824 | 100.0% |
Occupancy by Ownership by Household Size in Shelby
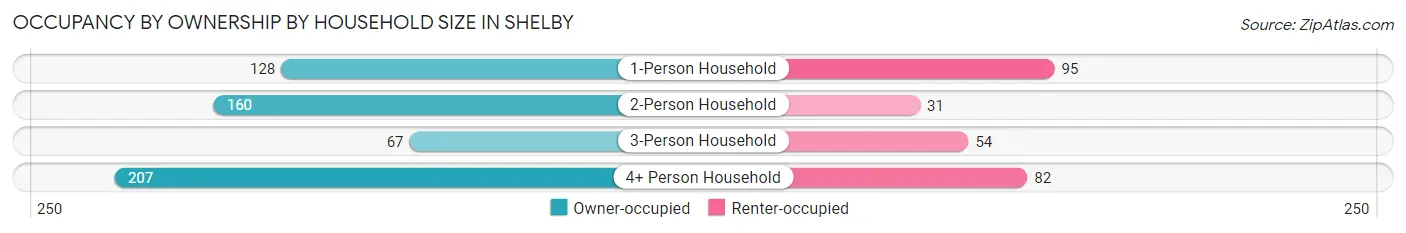
| Household Size | Owner-occupied | Renter-occupied |
| 1-Person Household | 128 (57.4%) | 95 (42.6%) |
| 2-Person Household | 160 (83.8%) | 31 (16.2%) |
| 3-Person Household | 67 (55.4%) | 54 (44.6%) |
| 4+ Person Household | 207 (71.6%) | 82 (28.4%) |
| Total Housing Units | 562 (68.2%) | 262 (31.8%) |
Occupancy by Educational Attainment in Shelby
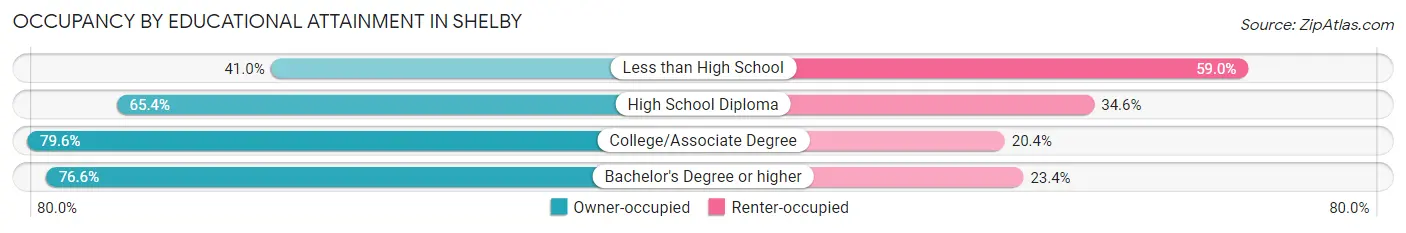
| Household Size | Owner-occupied | Renter-occupied |
| Less than High School | 41 (41.0%) | 59 (59.0%) |
| High School Diploma | 240 (65.4%) | 127 (34.6%) |
| College/Associate Degree | 199 (79.6%) | 51 (20.4%) |
| Bachelor's Degree or higher | 82 (76.6%) | 25 (23.4%) |
Occupancy by Age of Householder in Shelby
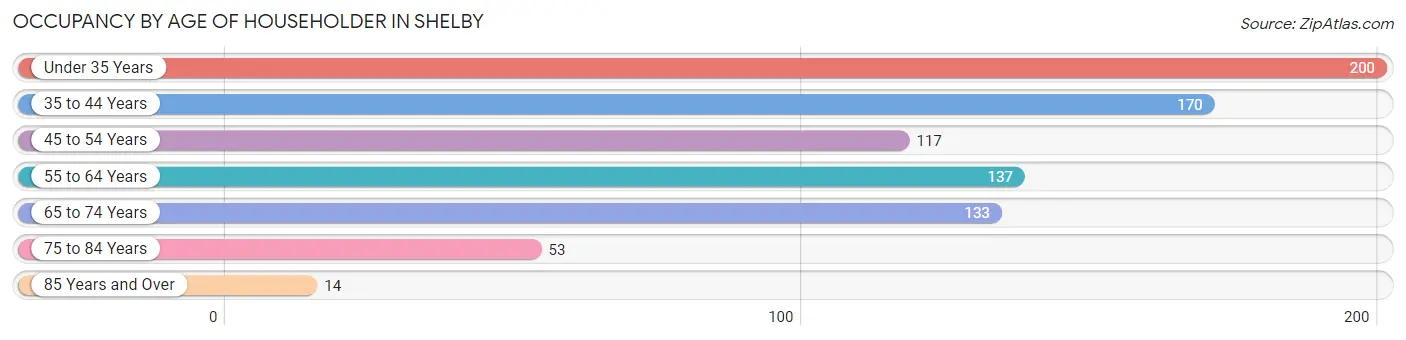
| Age Bracket | # Households | % Households |
| Under 35 Years | 200 | 24.3% |
| 35 to 44 Years | 170 | 20.6% |
| 45 to 54 Years | 117 | 14.2% |
| 55 to 64 Years | 137 | 16.6% |
| 65 to 74 Years | 133 | 16.1% |
| 75 to 84 Years | 53 | 6.4% |
| 85 Years and Over | 14 | 1.7% |
| Total | 824 | 100.0% |
Housing Finances in Shelby
Median Income by Occupancy in Shelby
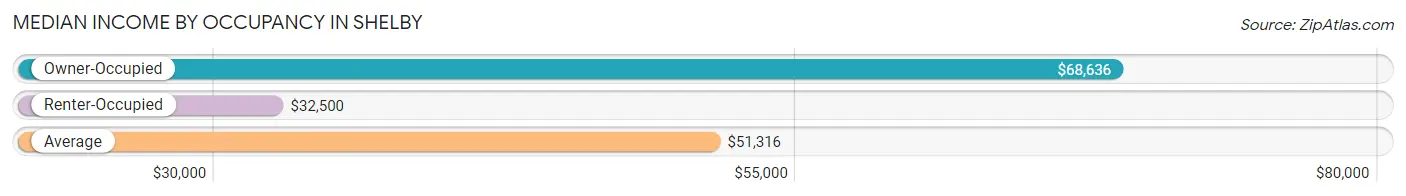
| Occupancy Type | # Households | Median Income |
| Owner-Occupied | 562 (68.2%) | $68,636 |
| Renter-Occupied | 262 (31.8%) | $32,500 |
| Average | 824 (100.0%) | $51,316 |
Occupancy by Householder Income Bracket in Shelby
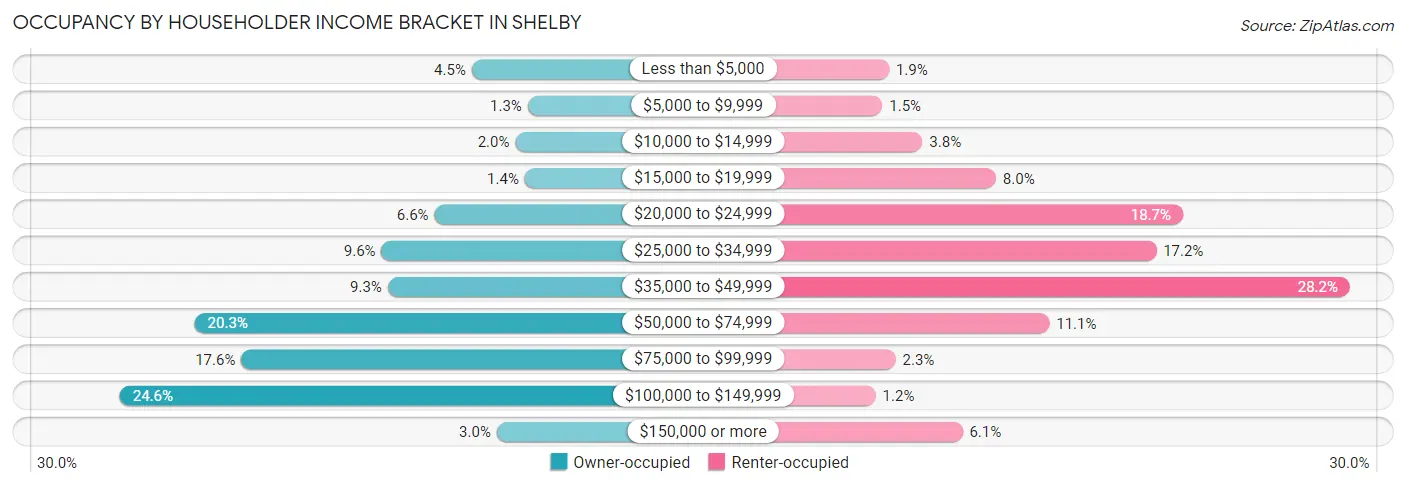
| Income Bracket | Owner-occupied | Renter-occupied |
| Less than $5,000 | 25 (4.4%) | 5 (1.9%) |
| $5,000 to $9,999 | 7 (1.3%) | 4 (1.5%) |
| $10,000 to $14,999 | 11 (2.0%) | 10 (3.8%) |
| $15,000 to $19,999 | 8 (1.4%) | 21 (8.0%) |
| $20,000 to $24,999 | 37 (6.6%) | 49 (18.7%) |
| $25,000 to $34,999 | 54 (9.6%) | 45 (17.2%) |
| $35,000 to $49,999 | 52 (9.2%) | 74 (28.2%) |
| $50,000 to $74,999 | 114 (20.3%) | 29 (11.1%) |
| $75,000 to $99,999 | 99 (17.6%) | 6 (2.3%) |
| $100,000 to $149,999 | 138 (24.6%) | 3 (1.1%) |
| $150,000 or more | 17 (3.0%) | 16 (6.1%) |
| Total | 562 (100.0%) | 262 (100.0%) |
Monthly Housing Cost Tiers in Shelby
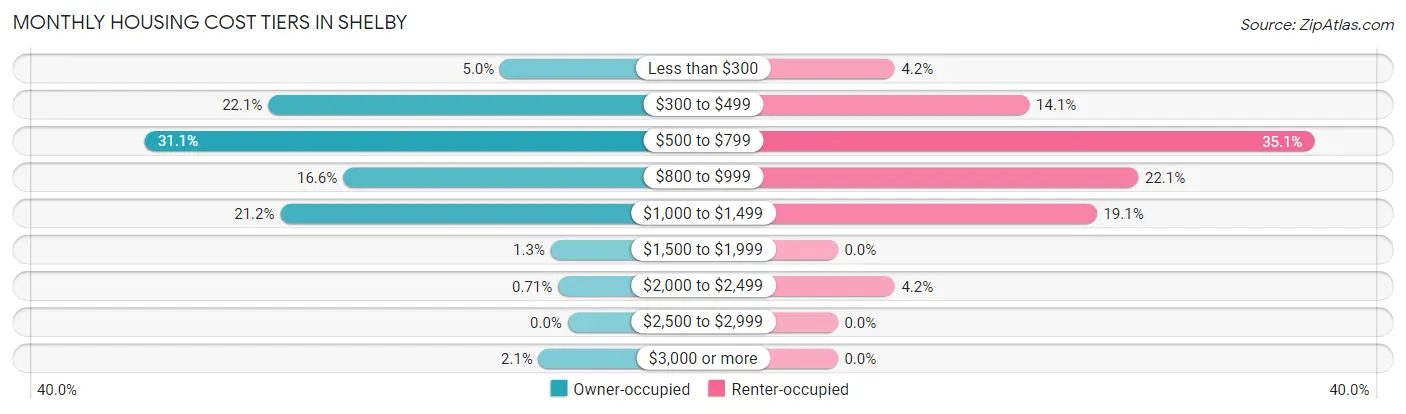
| Monthly Cost | Owner-occupied | Renter-occupied |
| Less than $300 | 28 (5.0%) | 11 (4.2%) |
| $300 to $499 | 124 (22.1%) | 37 (14.1%) |
| $500 to $799 | 175 (31.1%) | 92 (35.1%) |
| $800 to $999 | 93 (16.6%) | 58 (22.1%) |
| $1,000 to $1,499 | 119 (21.2%) | 50 (19.1%) |
| $1,500 to $1,999 | 7 (1.3%) | 0 (0.0%) |
| $2,000 to $2,499 | 4 (0.7%) | 11 (4.2%) |
| $2,500 to $2,999 | 0 (0.0%) | 0 (0.0%) |
| $3,000 or more | 12 (2.1%) | 0 (0.0%) |
| Total | 562 (100.0%) | 262 (100.0%) |
Physical Housing Characteristics in Shelby
Housing Structures in Shelby
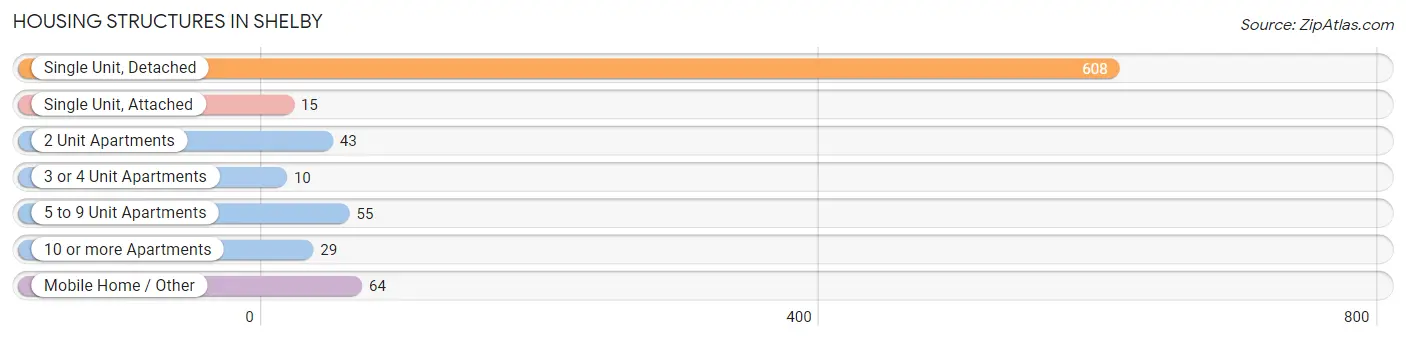
| Structure Type | # Housing Units | % Housing Units |
| Single Unit, Detached | 608 | 73.8% |
| Single Unit, Attached | 15 | 1.8% |
| 2 Unit Apartments | 43 | 5.2% |
| 3 or 4 Unit Apartments | 10 | 1.2% |
| 5 to 9 Unit Apartments | 55 | 6.7% |
| 10 or more Apartments | 29 | 3.5% |
| Mobile Home / Other | 64 | 7.8% |
| Total | 824 | 100.0% |
Housing Structures by Occupancy in Shelby
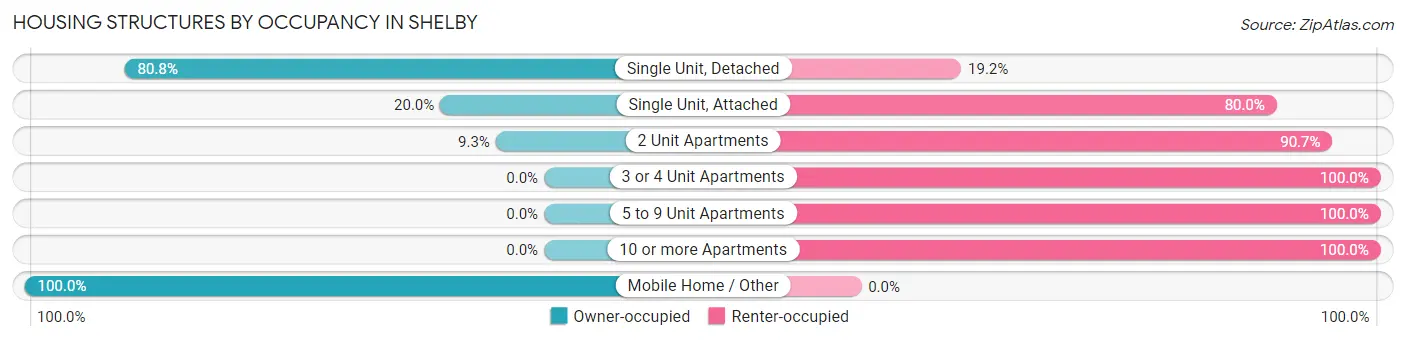
| Structure Type | Owner-occupied | Renter-occupied |
| Single Unit, Detached | 491 (80.8%) | 117 (19.2%) |
| Single Unit, Attached | 3 (20.0%) | 12 (80.0%) |
| 2 Unit Apartments | 4 (9.3%) | 39 (90.7%) |
| 3 or 4 Unit Apartments | 0 (0.0%) | 10 (100.0%) |
| 5 to 9 Unit Apartments | 0 (0.0%) | 55 (100.0%) |
| 10 or more Apartments | 0 (0.0%) | 29 (100.0%) |
| Mobile Home / Other | 64 (100.0%) | 0 (0.0%) |
| Total | 562 (68.2%) | 262 (31.8%) |
Housing Structures by Number of Rooms in Shelby
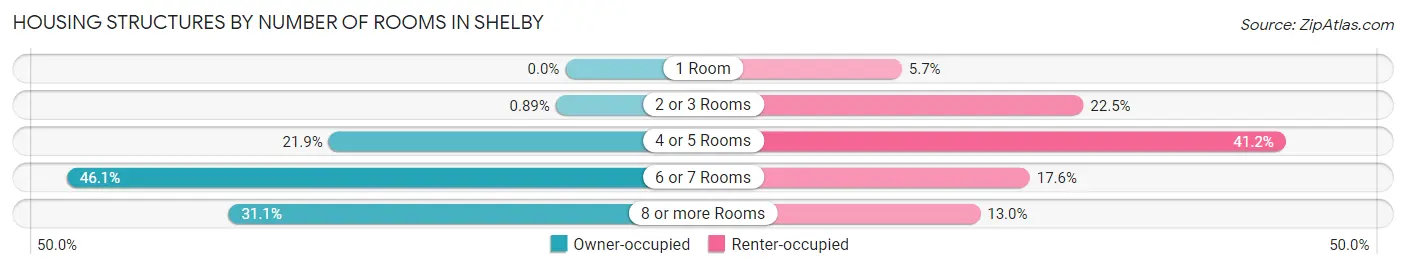
| Number of Rooms | Owner-occupied | Renter-occupied |
| 1 Room | 0 (0.0%) | 15 (5.7%) |
| 2 or 3 Rooms | 5 (0.9%) | 59 (22.5%) |
| 4 or 5 Rooms | 123 (21.9%) | 108 (41.2%) |
| 6 or 7 Rooms | 259 (46.1%) | 46 (17.6%) |
| 8 or more Rooms | 175 (31.1%) | 34 (13.0%) |
| Total | 562 (100.0%) | 262 (100.0%) |
Housing Structure by Heating Type in Shelby
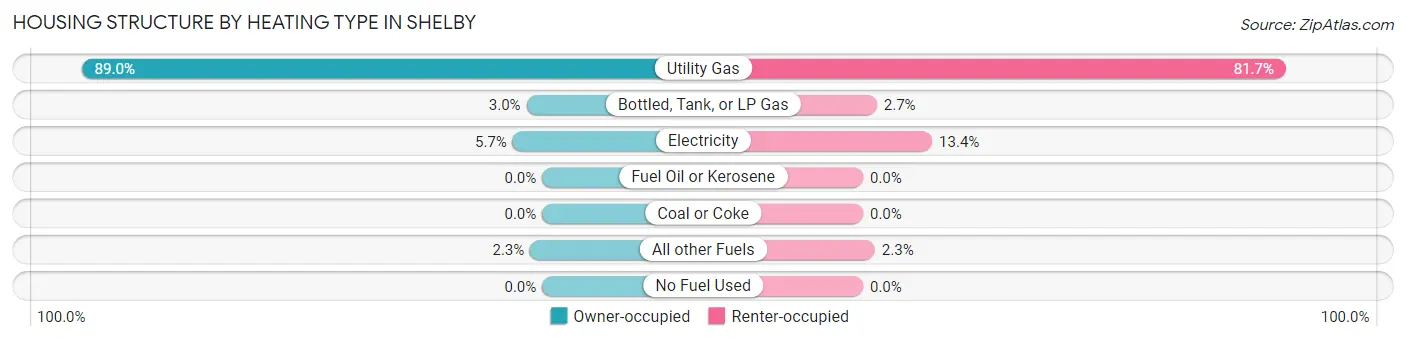
| Heating Type | Owner-occupied | Renter-occupied |
| Utility Gas | 500 (89.0%) | 214 (81.7%) |
| Bottled, Tank, or LP Gas | 17 (3.0%) | 7 (2.7%) |
| Electricity | 32 (5.7%) | 35 (13.4%) |
| Fuel Oil or Kerosene | 0 (0.0%) | 0 (0.0%) |
| Coal or Coke | 0 (0.0%) | 0 (0.0%) |
| All other Fuels | 13 (2.3%) | 6 (2.3%) |
| No Fuel Used | 0 (0.0%) | 0 (0.0%) |
| Total | 562 (100.0%) | 262 (100.0%) |
Household Vehicle Usage in Shelby
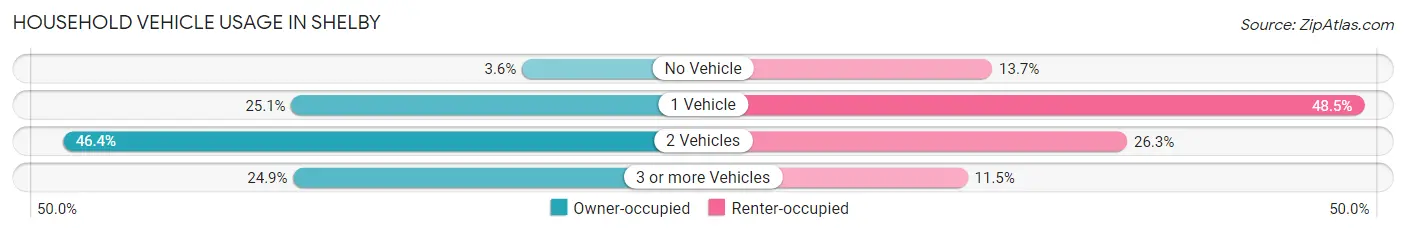
| Vehicles per Household | Owner-occupied | Renter-occupied |
| No Vehicle | 20 (3.6%) | 36 (13.7%) |
| 1 Vehicle | 141 (25.1%) | 127 (48.5%) |
| 2 Vehicles | 261 (46.4%) | 69 (26.3%) |
| 3 or more Vehicles | 140 (24.9%) | 30 (11.5%) |
| Total | 562 (100.0%) | 262 (100.0%) |
Real Estate & Mortgages in Shelby
Real Estate and Mortgage Overview in Shelby
| Characteristic | Without Mortgage | With Mortgage |
| Housing Units | 238 | 324 |
| Median Property Value | $130,600 | $112,000 |
| Median Household Income | $56,250 | $4 |
| Monthly Housing Costs | $453 | $12 |
| Real Estate Taxes | $1,283 | $12 |
Property Value by Mortgage Status in Shelby
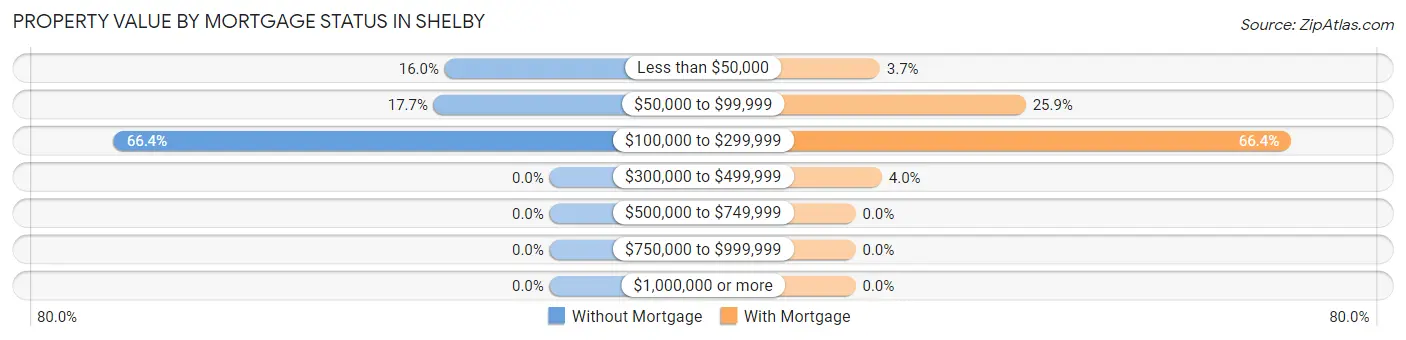
| Property Value | Without Mortgage | With Mortgage |
| Less than $50,000 | 38 (16.0%) | 12 (3.7%) |
| $50,000 to $99,999 | 42 (17.6%) | 84 (25.9%) |
| $100,000 to $299,999 | 158 (66.4%) | 215 (66.4%) |
| $300,000 to $499,999 | 0 (0.0%) | 13 (4.0%) |
| $500,000 to $749,999 | 0 (0.0%) | 0 (0.0%) |
| $750,000 to $999,999 | 0 (0.0%) | 0 (0.0%) |
| $1,000,000 or more | 0 (0.0%) | 0 (0.0%) |
| Total | 238 (100.0%) | 324 (100.0%) |
Household Income by Mortgage Status in Shelby
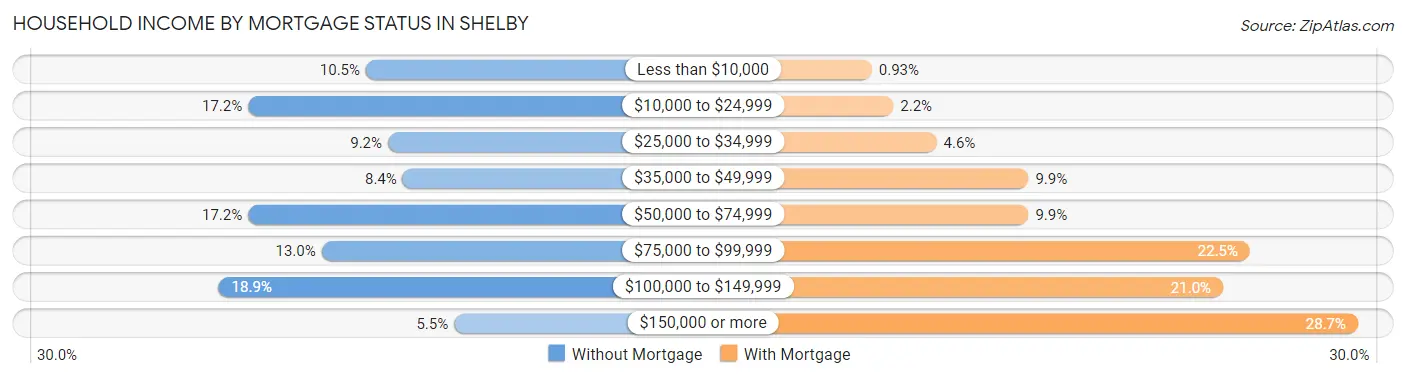
| Household Income | Without Mortgage | With Mortgage |
| Less than $10,000 | 25 (10.5%) | 3 (0.9%) |
| $10,000 to $24,999 | 41 (17.2%) | 7 (2.2%) |
| $25,000 to $34,999 | 22 (9.2%) | 15 (4.6%) |
| $35,000 to $49,999 | 20 (8.4%) | 32 (9.9%) |
| $50,000 to $74,999 | 41 (17.2%) | 32 (9.9%) |
| $75,000 to $99,999 | 31 (13.0%) | 73 (22.5%) |
| $100,000 to $149,999 | 45 (18.9%) | 68 (21.0%) |
| $150,000 or more | 13 (5.5%) | 93 (28.7%) |
| Total | 238 (100.0%) | 324 (100.0%) |
Property Value to Household Income Ratio in Shelby
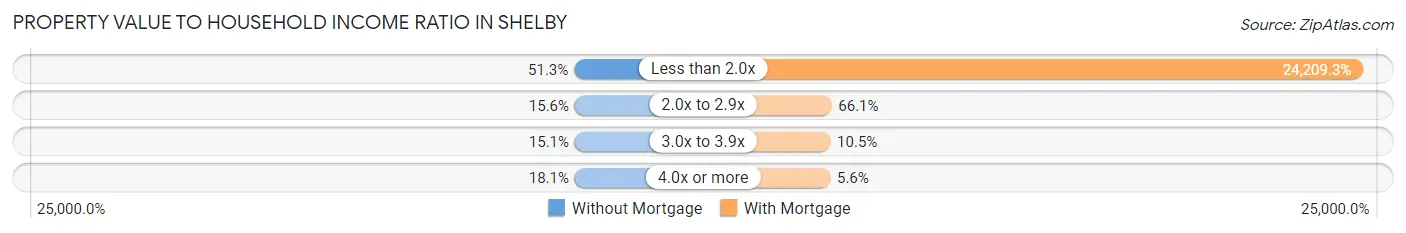
| Value-to-Income Ratio | Without Mortgage | With Mortgage |
| Less than 2.0x | 122 (51.3%) | 78,438 (24,209.3%) |
| 2.0x to 2.9x | 37 (15.5%) | 214 (66.0%) |
| 3.0x to 3.9x | 36 (15.1%) | 34 (10.5%) |
| 4.0x or more | 43 (18.1%) | 18 (5.6%) |
| Total | 238 (100.0%) | 324 (100.0%) |
Real Estate Taxes by Mortgage Status in Shelby
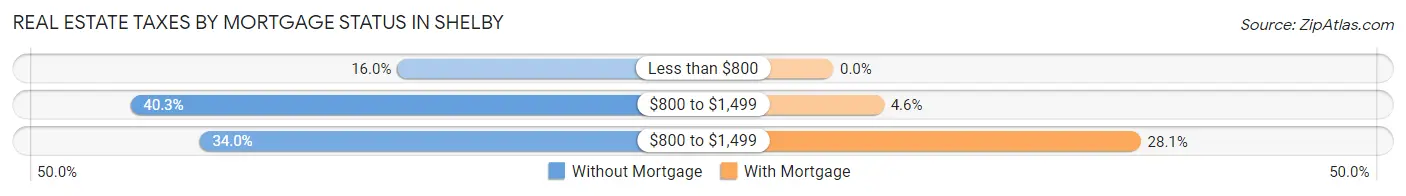
| Property Taxes | Without Mortgage | With Mortgage |
| Less than $800 | 38 (16.0%) | 0 (0.0%) |
| $800 to $1,499 | 96 (40.3%) | 15 (4.6%) |
| $800 to $1,499 | 81 (34.0%) | 91 (28.1%) |
| Total | 238 (100.0%) | 324 (100.0%) |
Health & Disability in Shelby
Health Insurance Coverage by Age in Shelby
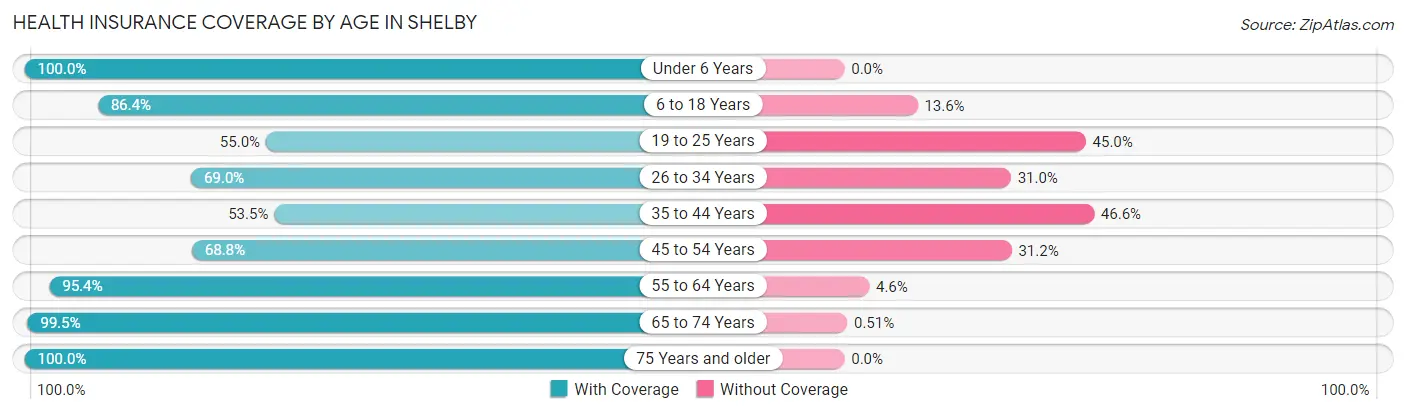
| Age Bracket | With Coverage | Without Coverage |
| Under 6 Years | 199 (100.0%) | 0 (0.0%) |
| 6 to 18 Years | 513 (86.4%) | 81 (13.6%) |
| 19 to 25 Years | 121 (55.0%) | 99 (45.0%) |
| 26 to 34 Years | 260 (69.0%) | 117 (31.0%) |
| 35 to 44 Years | 186 (53.4%) | 162 (46.6%) |
| 45 to 54 Years | 192 (68.8%) | 87 (31.2%) |
| 55 to 64 Years | 207 (95.4%) | 10 (4.6%) |
| 65 to 74 Years | 194 (99.5%) | 1 (0.5%) |
| 75 Years and older | 91 (100.0%) | 0 (0.0%) |
| Total | 1,963 (77.9%) | 557 (22.1%) |
Health Insurance Coverage by Citizenship Status in Shelby
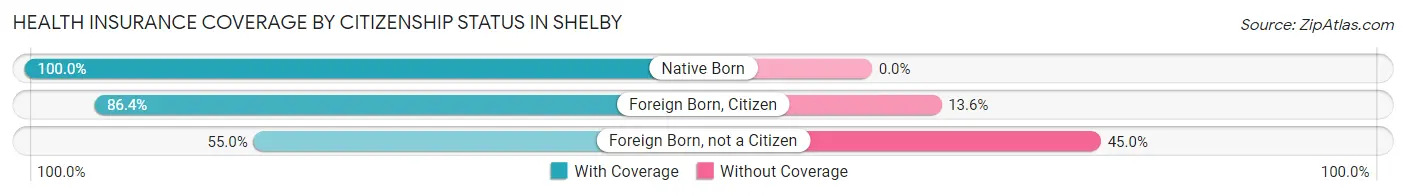
| Citizenship Status | With Coverage | Without Coverage |
| Native Born | 199 (100.0%) | 0 (0.0%) |
| Foreign Born, Citizen | 513 (86.4%) | 81 (13.6%) |
| Foreign Born, not a Citizen | 121 (55.0%) | 99 (45.0%) |
Health Insurance Coverage by Household Income in Shelby
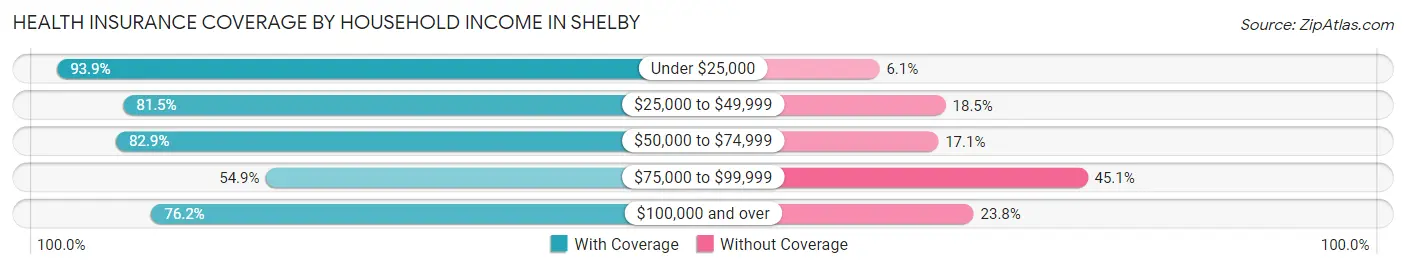
| Household Income | With Coverage | Without Coverage |
| Under $25,000 | 322 (93.9%) | 21 (6.1%) |
| $25,000 to $49,999 | 458 (81.5%) | 104 (18.5%) |
| $50,000 to $74,999 | 387 (82.9%) | 80 (17.1%) |
| $75,000 to $99,999 | 213 (54.9%) | 175 (45.1%) |
| $100,000 and over | 568 (76.2%) | 177 (23.8%) |
Public vs Private Health Insurance Coverage by Age in Shelby
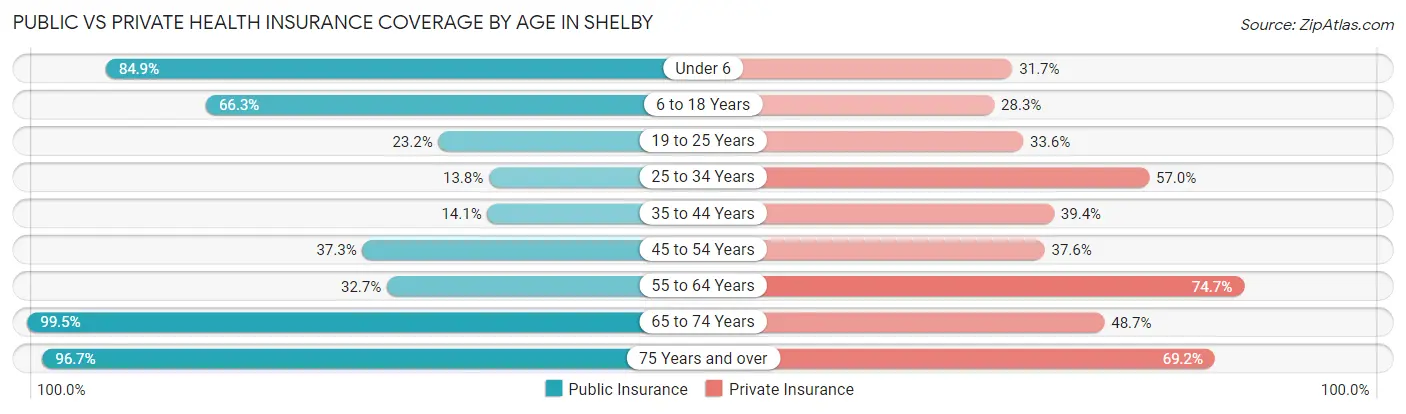
| Age Bracket | Public Insurance | Private Insurance |
| Under 6 | 169 (84.9%) | 63 (31.7%) |
| 6 to 18 Years | 394 (66.3%) | 168 (28.3%) |
| 19 to 25 Years | 51 (23.2%) | 74 (33.6%) |
| 25 to 34 Years | 52 (13.8%) | 215 (57.0%) |
| 35 to 44 Years | 49 (14.1%) | 137 (39.4%) |
| 45 to 54 Years | 104 (37.3%) | 105 (37.6%) |
| 55 to 64 Years | 71 (32.7%) | 162 (74.7%) |
| 65 to 74 Years | 194 (99.5%) | 95 (48.7%) |
| 75 Years and over | 88 (96.7%) | 63 (69.2%) |
| Total | 1,172 (46.5%) | 1,082 (42.9%) |
Disability Status by Sex by Age in Shelby
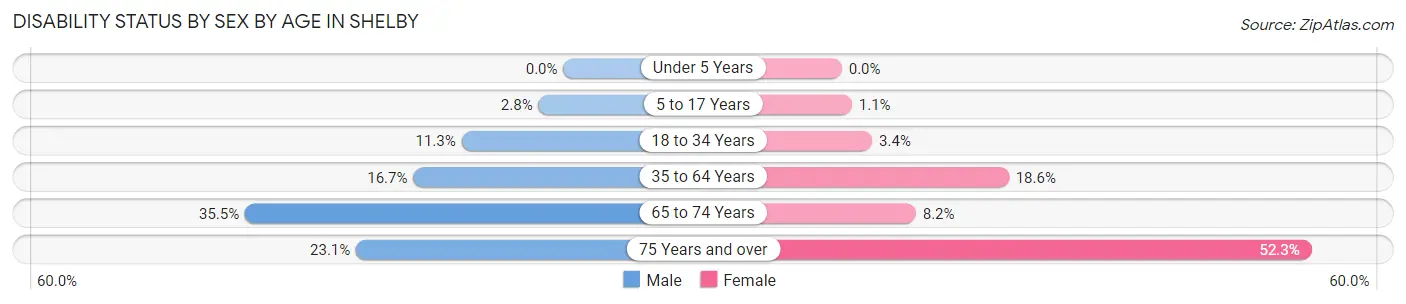
| Age Bracket | Male | Female |
| Under 5 Years | 0 (0.0%) | 0 (0.0%) |
| 5 to 17 Years | 7 (2.8%) | 4 (1.1%) |
| 18 to 34 Years | 33 (11.3%) | 11 (3.4%) |
| 35 to 64 Years | 70 (16.7%) | 79 (18.6%) |
| 65 to 74 Years | 39 (35.4%) | 7 (8.2%) |
| 75 Years and over | 6 (23.1%) | 34 (52.3%) |
Disability Class by Sex by Age in Shelby
Disability Class: Hearing Difficulty
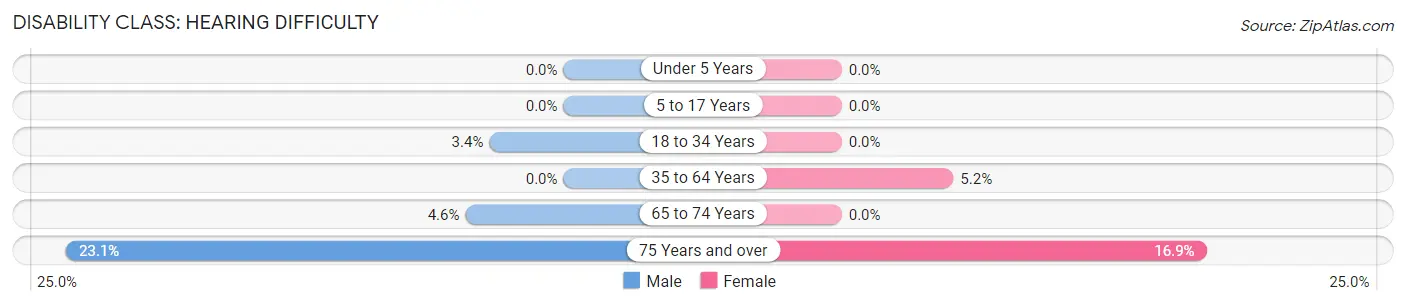
| Age Bracket | Male | Female |
| Under 5 Years | 0 (0.0%) | 0 (0.0%) |
| 5 to 17 Years | 0 (0.0%) | 0 (0.0%) |
| 18 to 34 Years | 10 (3.4%) | 0 (0.0%) |
| 35 to 64 Years | 0 (0.0%) | 22 (5.2%) |
| 65 to 74 Years | 5 (4.5%) | 0 (0.0%) |
| 75 Years and over | 6 (23.1%) | 11 (16.9%) |
Disability Class: Vision Difficulty
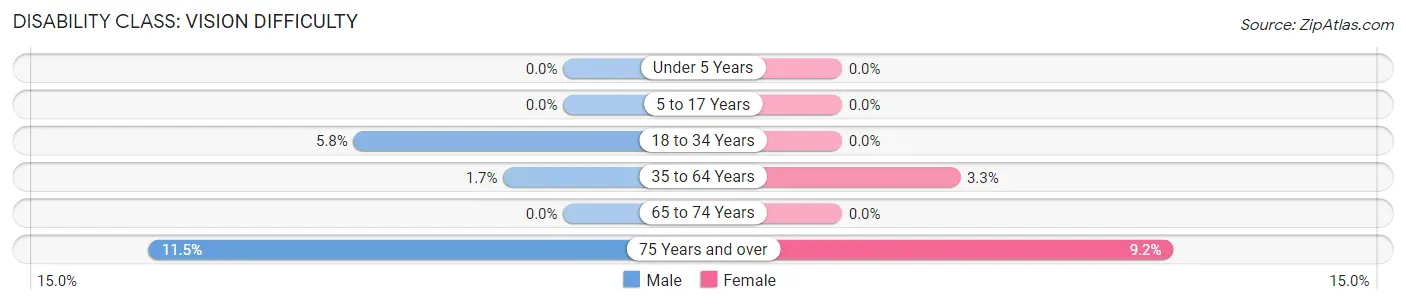
| Age Bracket | Male | Female |
| Under 5 Years | 0 (0.0%) | 0 (0.0%) |
| 5 to 17 Years | 0 (0.0%) | 0 (0.0%) |
| 18 to 34 Years | 17 (5.8%) | 0 (0.0%) |
| 35 to 64 Years | 7 (1.7%) | 14 (3.3%) |
| 65 to 74 Years | 0 (0.0%) | 0 (0.0%) |
| 75 Years and over | 3 (11.5%) | 6 (9.2%) |
Disability Class: Cognitive Difficulty
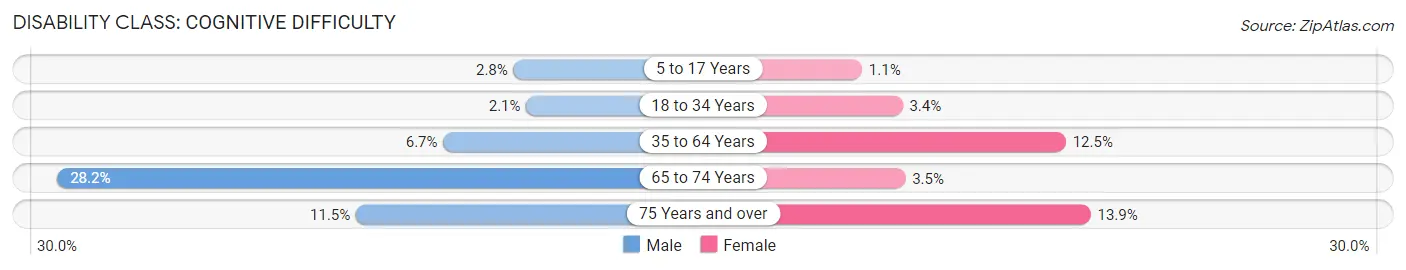
| Age Bracket | Male | Female |
| 5 to 17 Years | 7 (2.8%) | 4 (1.1%) |
| 18 to 34 Years | 6 (2.1%) | 11 (3.4%) |
| 35 to 64 Years | 28 (6.7%) | 53 (12.5%) |
| 65 to 74 Years | 31 (28.2%) | 3 (3.5%) |
| 75 Years and over | 3 (11.5%) | 9 (13.9%) |
Disability Class: Ambulatory Difficulty
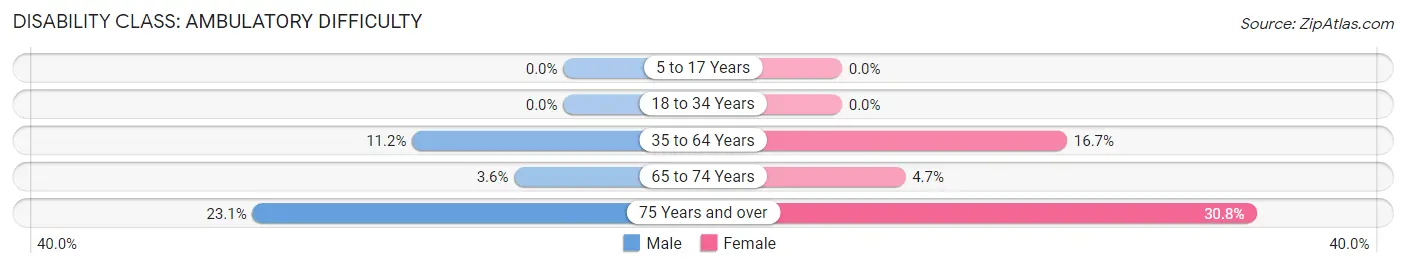
| Age Bracket | Male | Female |
| 5 to 17 Years | 0 (0.0%) | 0 (0.0%) |
| 18 to 34 Years | 0 (0.0%) | 0 (0.0%) |
| 35 to 64 Years | 47 (11.2%) | 71 (16.7%) |
| 65 to 74 Years | 4 (3.6%) | 4 (4.7%) |
| 75 Years and over | 6 (23.1%) | 20 (30.8%) |
Disability Class: Self-Care Difficulty
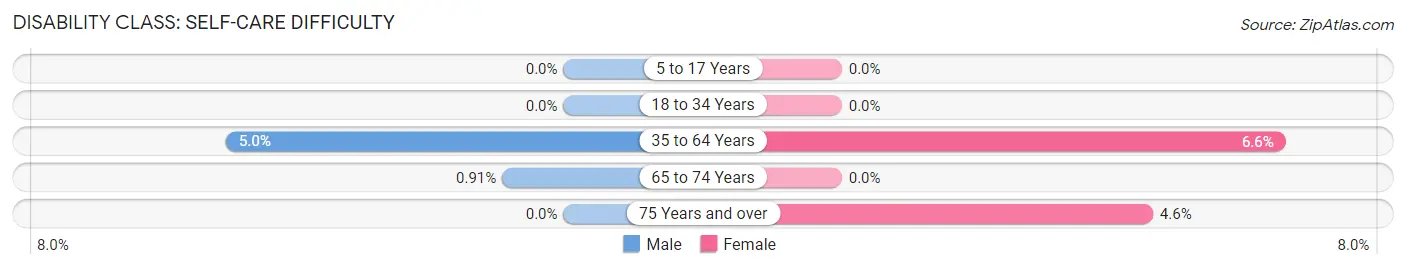
| Age Bracket | Male | Female |
| 5 to 17 Years | 0 (0.0%) | 0 (0.0%) |
| 18 to 34 Years | 0 (0.0%) | 0 (0.0%) |
| 35 to 64 Years | 21 (5.0%) | 28 (6.6%) |
| 65 to 74 Years | 1 (0.9%) | 0 (0.0%) |
| 75 Years and over | 0 (0.0%) | 3 (4.6%) |
Technology Access in Shelby
Computing Device Access in Shelby
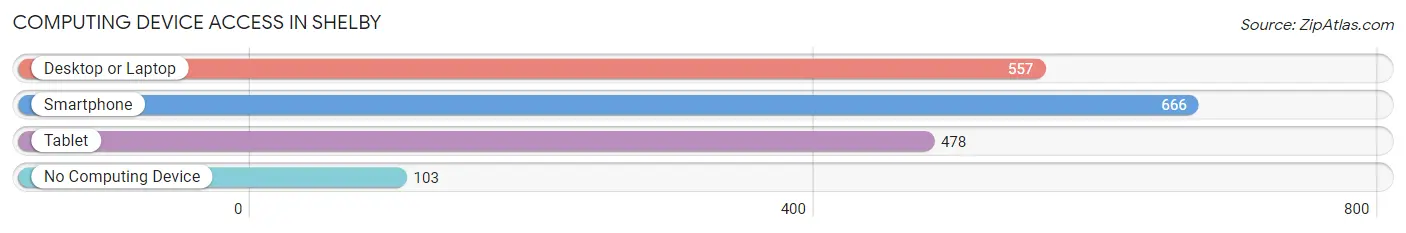
| Device Type | # Households | % Households |
| Desktop or Laptop | 557 | 67.6% |
| Smartphone | 666 | 80.8% |
| Tablet | 478 | 58.0% |
| No Computing Device | 103 | 12.5% |
| Total | 824 | 100.0% |
Internet Access in Shelby
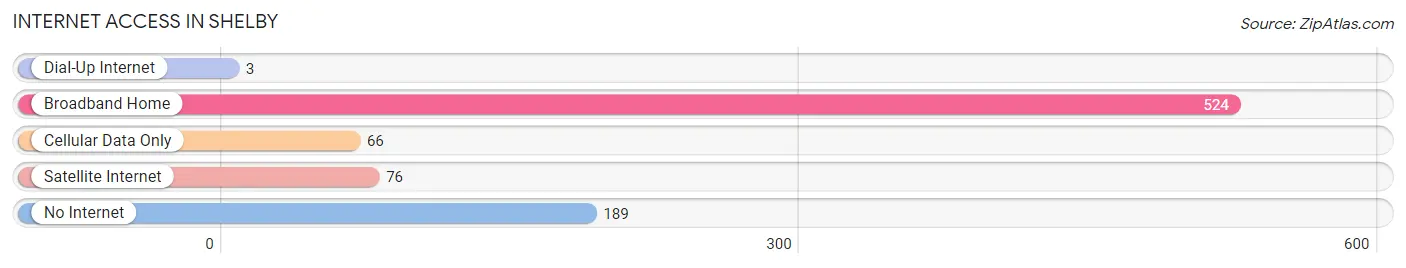
| Internet Type | # Households | % Households |
| Dial-Up Internet | 3 | 0.4% |
| Broadband Home | 524 | 63.6% |
| Cellular Data Only | 66 | 8.0% |
| Satellite Internet | 76 | 9.2% |
| No Internet | 189 | 22.9% |
| Total | 824 | 100.0% |
Shelby Summary
Shelby, Michigan is a small city located in Oceana County in the western part of the state. It is situated on the shores of Lake Michigan and is home to a population of approximately 2,000 people. The city is known for its beautiful beaches, its historic downtown, and its vibrant economy.
History
Shelby was first settled in 1854 by a group of settlers from New York. The city was named after the nearby Shelby Creek, which was named after a local Native American chief. The city was incorporated in 1871 and quickly grew to become a popular summer destination for tourists. In the late 19th century, the city was home to a number of resorts and hotels, as well as a thriving lumber industry.
In the early 20th century, Shelby experienced a period of growth and prosperity. The city was home to a number of factories, including a paper mill, a canning factory, and a furniture factory. The city also had a thriving commercial fishing industry, which provided employment for many of the city’s residents.
Geography
Shelby is located in Oceana County in the western part of Michigan. The city is situated on the shores of Lake Michigan and is bordered by the cities of Hart and Pentwater to the north, and the towns of Rothbury and New Era to the south. The city is located approximately 30 miles from the state capital of Lansing.
The city has a total area of 2.2 square miles, all of which is land. The city is located at an elevation of 645 feet above sea level. The city is home to a number of parks and recreational areas, including the Shelby City Park, the Shelby Beach Park, and the Shelby Nature Preserve.
Economy
Shelby’s economy is largely based on tourism and manufacturing. The city is home to a number of resorts and hotels, as well as a number of restaurants and shops. The city is also home to a number of manufacturing companies, including a paper mill, a canning factory, and a furniture factory. The city also has a thriving commercial fishing industry, which provides employment for many of the city’s residents.
Demographics
As of the 2010 census, the population of Shelby was 2,000. The racial makeup of the city was 95.2% White, 0.7% African American, 0.3% Native American, 0.3% Asian, 0.1% Pacific Islander, 0.7% from other races, and 2.0% from two or more races. Hispanic or Latino of any race were 2.3% of the population.
The median income for a household in the city was $37,500, and the median income for a family was $45,000. The per capita income for the city was $19,000. About 11.2% of families and 14.2% of the population were below the poverty line, including 18.2% of those under age 18 and 8.3% of those age 65 or over.
Common Questions
What is the Total Population of Shelby?
Total Population of Shelby is 2,520.
What is the Total Male Population of Shelby?
Total Male Population of Shelby is 1,193.
What is the Total Female Population of Shelby?
Total Female Population of Shelby is 1,327.
What is the Ratio of Males per 100 Females in Shelby?
There are 89.90 Males per 100 Females in Shelby.
What is the Ratio of Females per 100 Males in Shelby?
There are 111.23 Females per 100 Males in Shelby.
What is the Median Population Age in Shelby?
Median Population Age in Shelby is 31.9 Years.
What is the Average Family Size in Shelby
Average Family Size in Shelby is 3.5 People.
What is the Average Household Size in Shelby
Average Household Size in Shelby is 3.0 People.
What is Per Capita Income in Shelby?
Per Capita income in Shelby is $22,673.
What is the Median Family Income in Shelby?
Median Family Income in Shelby is $63,750.
What is the Median Household income in Shelby?
Median Household Income in Shelby is $51,316.
What is Income or Wage Gap in Shelby?
Income or Wage Gap in Shelby is 31.6%.
Women in Shelby earn 68.4 cents for every dollar earned by a man.
What is Inequality or Gini Index in Shelby?
Inequality or Gini Index in Shelby is 0.39.
How Large is the Labor Force in Shelby?
There are 1,172 People in the Labor Forcein in Shelby.
What is the Percentage of People in the Labor Force in Shelby?
65.1% of People are in the Labor Force in Shelby.
What is the Unemployment Rate in Shelby?
Unemployment Rate in Shelby is 4.2%.