Cities with the Most Immigrants from Malaysia in Virginia
RELATED REPORTS & OPTIONS
Malaysia
Virginia
Compare Cities
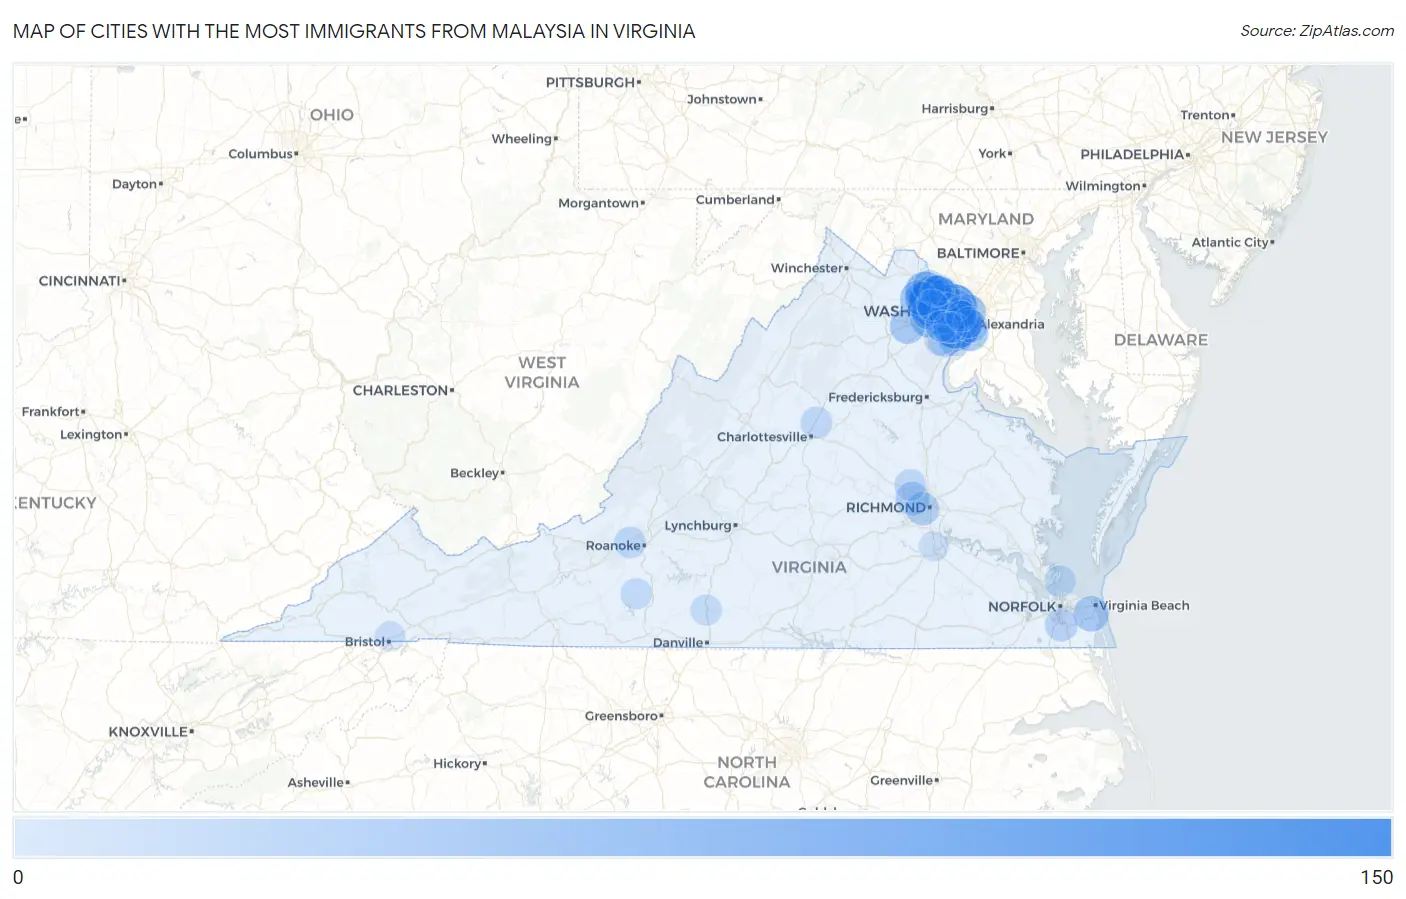
Map of Cities with the Most Immigrants from Malaysia in Virginia
0
150
Cities with the Most Immigrants from Malaysia in Virginia
| City | Malaysia | vs State | vs National | |
| 1. | North Springfield | 140 | 1,776(7.88%)#1 | 82,574(0.17%)#90 |
| 2. | Herndon | 139 | 1,776(7.83%)#2 | 82,574(0.17%)#92 |
| 3. | Mcnair | 124 | 1,776(6.98%)#3 | 82,574(0.15%)#107 |
| 4. | Tysons | 118 | 1,776(6.64%)#4 | 82,574(0.14%)#113 |
| 5. | Ashburn | 65 | 1,776(3.66%)#5 | 82,574(0.08%)#218 |
| 6. | Fair Oaks | 60 | 1,776(3.38%)#6 | 82,574(0.07%)#246 |
| 7. | Centreville | 49 | 1,776(2.76%)#7 | 82,574(0.06%)#295 |
| 8. | Reston | 49 | 1,776(2.76%)#8 | 82,574(0.06%)#297 |
| 9. | Brambleton | 49 | 1,776(2.76%)#9 | 82,574(0.06%)#299 |
| 10. | Hybla Valley | 47 | 1,776(2.65%)#10 | 82,574(0.06%)#312 |
| 11. | Arlington | 46 | 1,776(2.59%)#11 | 82,574(0.06%)#315 |
| 12. | Virginia Beach | 38 | 1,776(2.14%)#12 | 82,574(0.05%)#368 |
| 13. | Gainesville | 35 | 1,776(1.97%)#13 | 82,574(0.04%)#406 |
| 14. | Oakton | 34 | 1,776(1.91%)#14 | 82,574(0.04%)#413 |
| 15. | Lincolnia | 34 | 1,776(1.91%)#15 | 82,574(0.04%)#418 |
| 16. | Chantilly | 31 | 1,776(1.75%)#16 | 82,574(0.04%)#460 |
| 17. | Vienna | 28 | 1,776(1.58%)#17 | 82,574(0.03%)#489 |
| 18. | Tuckahoe | 26 | 1,776(1.46%)#18 | 82,574(0.03%)#506 |
| 19. | Loudoun Valley Estates | 25 | 1,776(1.41%)#19 | 82,574(0.03%)#524 |
| 20. | West Falls Church | 24 | 1,776(1.35%)#20 | 82,574(0.03%)#534 |
| 21. | Richmond | 23 | 1,776(1.30%)#21 | 82,574(0.03%)#545 |
| 22. | Difficult Run | 23 | 1,776(1.30%)#22 | 82,574(0.03%)#558 |
| 23. | Chesapeake | 19 | 1,776(1.07%)#23 | 82,574(0.02%)#611 |
| 24. | Lorton | 18 | 1,776(1.01%)#24 | 82,574(0.02%)#644 |
| 25. | Falls Church | 18 | 1,776(1.01%)#25 | 82,574(0.02%)#647 |
| 26. | Huntington | 18 | 1,776(1.01%)#26 | 82,574(0.02%)#648 |
| 27. | University Center | 17 | 1,776(0.96%)#27 | 82,574(0.02%)#682 |
| 28. | Midlothian | 15 | 1,776(0.84%)#28 | 82,574(0.02%)#741 |
| 29. | Goose Creek | 15 | 1,776(0.84%)#29 | 82,574(0.02%)#750 |
| 30. | Franklin Farm | 14 | 1,776(0.79%)#30 | 82,574(0.02%)#777 |
| 31. | Lake Ridge | 12 | 1,776(0.68%)#31 | 82,574(0.01%)#841 |
| 32. | Wyndham | 12 | 1,776(0.68%)#32 | 82,574(0.01%)#869 |
| 33. | Hollymead | 12 | 1,776(0.68%)#33 | 82,574(0.01%)#871 |
| 34. | Mclean | 11 | 1,776(0.62%)#34 | 82,574(0.01%)#888 |
| 35. | Salem | 11 | 1,776(0.62%)#35 | 82,574(0.01%)#900 |
| 36. | Fairfax | 11 | 1,776(0.62%)#36 | 82,574(0.01%)#901 |
| 37. | Hampton | 10 | 1,776(0.56%)#37 | 82,574(0.01%)#922 |
| 38. | Great Falls | 10 | 1,776(0.56%)#38 | 82,574(0.01%)#947 |
| 39. | Lowes Island | 10 | 1,776(0.56%)#39 | 82,574(0.01%)#952 |
| 40. | County Center | 10 | 1,776(0.56%)#40 | 82,574(0.01%)#959 |
| 41. | Ferrum | 9 | 1,776(0.51%)#41 | 82,574(0.01%)#1,009 |
| 42. | Sugarland Run | 8 | 1,776(0.45%)#42 | 82,574(0.01%)#1,040 |
| 43. | Floris | 8 | 1,776(0.45%)#43 | 82,574(0.01%)#1,042 |
| 44. | Chatham | 8 | 1,776(0.45%)#44 | 82,574(0.01%)#1,049 |
| 45. | West Springfield | 7 | 1,776(0.39%)#45 | 82,574(0.01%)#1,074 |
| 46. | Fairfax Station | 7 | 1,776(0.39%)#46 | 82,574(0.01%)#1,079 |
| 47. | Alexandria | 6 | 1,776(0.34%)#47 | 82,574(0.01%)#1,097 |
| 48. | Lake Barcroft | 6 | 1,776(0.34%)#48 | 82,574(0.01%)#1,117 |
| 49. | Burke | 3 | 1,776(0.17%)#49 | 82,574(0.00%)#1,222 |
| 50. | Bristol | 2 | 1,776(0.11%)#50 | 82,574(0.00%)#1,263 |
| 51. | Colonial Heights | 1 | 1,776(0.06%)#51 | 82,574(0.00%)#1,285 |
| 52. | Woodlawn Cdp Carroll County | 1 | 1,776(0.06%)#52 | 82,574(0.00%)#1,289 |
Common Questions
What are the Top 10 Cities with the Most Immigrants from Malaysia in Virginia?
Top 10 Cities with the Most Immigrants from Malaysia in Virginia are:
#1
140
#2
139
#3
124
#4
118
#5
65
#6
60
#7
49
#8
49
#9
49
#10
47
What city has the Most Immigrants from Malaysia in Virginia?
North Springfield has the Most Immigrants from Malaysia in Virginia with 140.
What is the Total Immigrants from Malaysia in the State of Virginia?
Total Immigrants from Malaysia in Virginia is 1,776.
What is the Total Immigrants from Malaysia in the United States?
Total Immigrants from Malaysia in the United States is 82,574.