Cities with the Most Immigrants from Ghana in Virginia
RELATED REPORTS & OPTIONS
Ghana
Virginia
Compare Cities
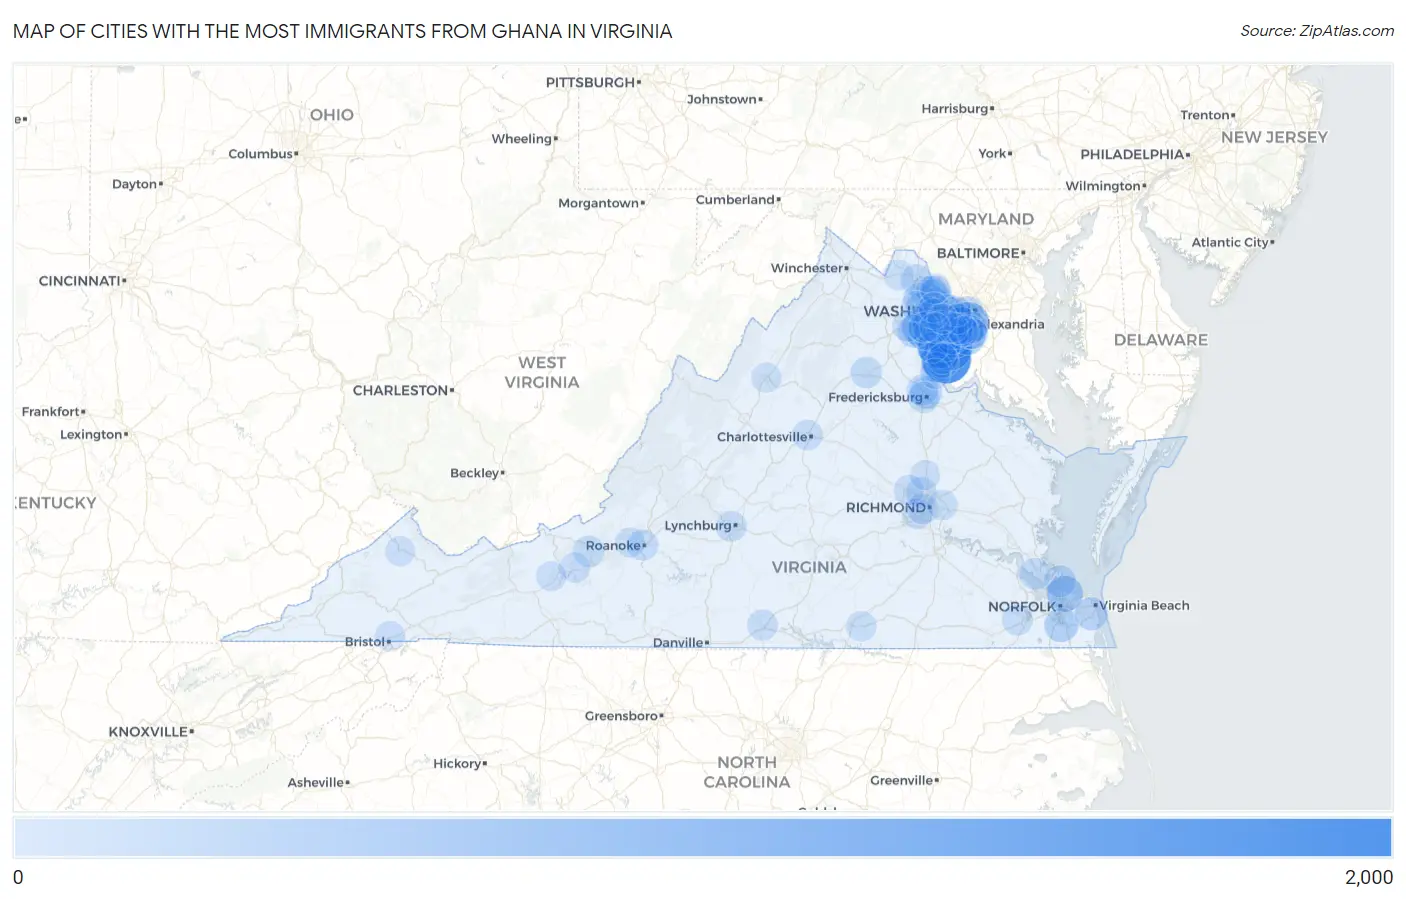
Map of Cities with the Most Immigrants from Ghana in Virginia
0
2,000
Cities with the Most Immigrants from Ghana in Virginia
| City | Ghana | vs State | vs National | |
| 1. | Cherry Hill | 1,669 | 17,346(9.62%)#1 | 201,796(0.83%)#10 |
| 2. | Leesylvania | 1,557 | 17,346(8.98%)#2 | 201,796(0.77%)#12 |
| 3. | Dale City | 1,187 | 17,346(6.84%)#3 | 201,796(0.59%)#13 |
| 4. | Woodbridge | 1,145 | 17,346(6.60%)#4 | 201,796(0.57%)#15 |
| 5. | Alexandria | 870 | 17,346(5.02%)#5 | 201,796(0.43%)#19 |
| 6. | Woodlawn Cdp Fairfax County | 585 | 17,346(3.37%)#6 | 201,796(0.29%)#36 |
| 7. | Lorton | 495 | 17,346(2.85%)#7 | 201,796(0.25%)#49 |
| 8. | Norfolk | 491 | 17,346(2.83%)#8 | 201,796(0.24%)#50 |
| 9. | Bull Run | 476 | 17,346(2.74%)#9 | 201,796(0.24%)#57 |
| 10. | Mount Vernon | 387 | 17,346(2.23%)#10 | 201,796(0.19%)#67 |
| 11. | Manassas | 383 | 17,346(2.21%)#11 | 201,796(0.19%)#68 |
| 12. | Lake Ridge | 381 | 17,346(2.20%)#12 | 201,796(0.19%)#69 |
| 13. | Chesapeake | 309 | 17,346(1.78%)#13 | 201,796(0.15%)#81 |
| 14. | Centreville | 295 | 17,346(1.70%)#14 | 201,796(0.15%)#86 |
| 15. | Hybla Valley | 249 | 17,346(1.44%)#15 | 201,796(0.12%)#106 |
| 16. | Virginia Beach | 232 | 17,346(1.34%)#16 | 201,796(0.11%)#120 |
| 17. | Triangle | 222 | 17,346(1.28%)#17 | 201,796(0.11%)#132 |
| 18. | Linton Hall | 189 | 17,346(1.09%)#18 | 201,796(0.09%)#160 |
| 19. | County Center | 174 | 17,346(1.00%)#19 | 201,796(0.09%)#177 |
| 20. | Arlington | 164 | 17,346(0.95%)#20 | 201,796(0.08%)#185 |
| 21. | Fair Oaks | 162 | 17,346(0.93%)#21 | 201,796(0.08%)#188 |
| 22. | Falmouth | 156 | 17,346(0.90%)#22 | 201,796(0.08%)#200 |
| 23. | Hampton | 142 | 17,346(0.82%)#23 | 201,796(0.07%)#221 |
| 24. | Montclair | 132 | 17,346(0.76%)#24 | 201,796(0.07%)#243 |
| 25. | Newport News | 119 | 17,346(0.69%)#25 | 201,796(0.06%)#271 |
| 26. | Leesburg | 115 | 17,346(0.66%)#26 | 201,796(0.06%)#278 |
| 27. | Sudley | 109 | 17,346(0.63%)#27 | 201,796(0.05%)#291 |
| 28. | Southern Gateway | 108 | 17,346(0.62%)#28 | 201,796(0.05%)#297 |
| 29. | Culpeper | 107 | 17,346(0.62%)#29 | 201,796(0.05%)#299 |
| 30. | Bailey S Crossroads | 102 | 17,346(0.59%)#30 | 201,796(0.05%)#311 |
| 31. | Sterling | 100 | 17,346(0.58%)#31 | 201,796(0.05%)#319 |
| 32. | Burke Centre | 100 | 17,346(0.58%)#32 | 201,796(0.05%)#321 |
| 33. | Blacksburg | 93 | 17,346(0.54%)#33 | 201,796(0.05%)#337 |
| 34. | Buckhall | 93 | 17,346(0.54%)#34 | 201,796(0.05%)#341 |
| 35. | Fredericksburg | 92 | 17,346(0.53%)#35 | 201,796(0.05%)#343 |
| 36. | Brambleton | 86 | 17,346(0.50%)#36 | 201,796(0.04%)#364 |
| 37. | Roanoke | 83 | 17,346(0.48%)#37 | 201,796(0.04%)#376 |
| 38. | Reston | 82 | 17,346(0.47%)#38 | 201,796(0.04%)#385 |
| 39. | Ashburn | 78 | 17,346(0.45%)#39 | 201,796(0.04%)#398 |
| 40. | Kingstowne | 70 | 17,346(0.40%)#40 | 201,796(0.03%)#432 |
| 41. | Oakton | 68 | 17,346(0.39%)#41 | 201,796(0.03%)#448 |
| 42. | Dulles Town Center | 67 | 17,346(0.39%)#42 | 201,796(0.03%)#457 |
| 43. | Lincolnia | 62 | 17,346(0.36%)#43 | 201,796(0.03%)#493 |
| 44. | Vienna | 62 | 17,346(0.36%)#44 | 201,796(0.03%)#495 |
| 45. | Belle Haven | 62 | 17,346(0.36%)#45 | 201,796(0.03%)#496 |
| 46. | Groveton | 59 | 17,346(0.34%)#46 | 201,796(0.03%)#509 |
| 47. | Suffolk | 56 | 17,346(0.32%)#47 | 201,796(0.03%)#527 |
| 48. | Laurel | 55 | 17,346(0.32%)#48 | 201,796(0.03%)#540 |
| 49. | South Boston | 55 | 17,346(0.32%)#49 | 201,796(0.03%)#543 |
| 50. | Manchester | 53 | 17,346(0.31%)#50 | 201,796(0.03%)#554 |
| 51. | Lynchburg | 51 | 17,346(0.29%)#51 | 201,796(0.03%)#560 |
| 52. | Rose Hill Cdp Fairfax County | 51 | 17,346(0.29%)#52 | 201,796(0.03%)#564 |
| 53. | Newington | 50 | 17,346(0.29%)#53 | 201,796(0.02%)#567 |
| 54. | University Of Virginia | 49 | 17,346(0.28%)#54 | 201,796(0.02%)#577 |
| 55. | Newington Forest | 48 | 17,346(0.28%)#55 | 201,796(0.02%)#589 |
| 56. | South Riding | 47 | 17,346(0.27%)#56 | 201,796(0.02%)#593 |
| 57. | Laurel Hill | 47 | 17,346(0.27%)#57 | 201,796(0.02%)#594 |
| 58. | Gainesville | 43 | 17,346(0.25%)#58 | 201,796(0.02%)#627 |
| 59. | Franconia | 42 | 17,346(0.24%)#59 | 201,796(0.02%)#634 |
| 60. | Springfield | 41 | 17,346(0.24%)#60 | 201,796(0.02%)#647 |
| 61. | Richmond | 40 | 17,346(0.23%)#61 | 201,796(0.02%)#652 |
| 62. | Sugarland Run | 40 | 17,346(0.23%)#62 | 201,796(0.02%)#662 |
| 63. | Burke | 39 | 17,346(0.22%)#63 | 201,796(0.02%)#668 |
| 64. | Chantilly | 39 | 17,346(0.22%)#64 | 201,796(0.02%)#674 |
| 65. | Fairfax Station | 39 | 17,346(0.22%)#65 | 201,796(0.02%)#677 |
| 66. | Fort Hunt | 36 | 17,346(0.21%)#66 | 201,796(0.02%)#706 |
| 67. | Annandale | 35 | 17,346(0.20%)#67 | 201,796(0.02%)#712 |
| 68. | Potomac Mills | 35 | 17,346(0.20%)#68 | 201,796(0.02%)#723 |
| 69. | Radford | 34 | 17,346(0.20%)#69 | 201,796(0.02%)#733 |
| 70. | Highland Springs | 30 | 17,346(0.17%)#70 | 201,796(0.01%)#796 |
| 71. | Boswell S Corner | 30 | 17,346(0.17%)#71 | 201,796(0.01%)#799 |
| 72. | Independent Hill | 27 | 17,346(0.16%)#72 | 201,796(0.01%)#833 |
| 73. | Short Pump | 25 | 17,346(0.14%)#73 | 201,796(0.01%)#854 |
| 74. | Yorkshire | 25 | 17,346(0.14%)#74 | 201,796(0.01%)#859 |
| 75. | Idylwood | 24 | 17,346(0.14%)#75 | 201,796(0.01%)#877 |
| 76. | Stone Ridge | 23 | 17,346(0.13%)#76 | 201,796(0.01%)#899 |
| 77. | West Springfield | 19 | 17,346(0.11%)#77 | 201,796(0.01%)#963 |
| 78. | Greenbriar | 19 | 17,346(0.11%)#78 | 201,796(0.01%)#968 |
| 79. | Bristol | 18 | 17,346(0.10%)#79 | 201,796(0.01%)#982 |
| 80. | Loch Lomond | 18 | 17,346(0.10%)#80 | 201,796(0.01%)#994 |
| 81. | Dumfries | 17 | 17,346(0.10%)#81 | 201,796(0.01%)#1,017 |
| 82. | Brodnax | 17 | 17,346(0.10%)#82 | 201,796(0.01%)#1,021 |
| 83. | Hutchison | 14 | 17,346(0.08%)#83 | 201,796(0.01%)#1,090 |
| 84. | Cascades | 13 | 17,346(0.07%)#84 | 201,796(0.01%)#1,109 |
| 85. | Purcellville | 13 | 17,346(0.07%)#85 | 201,796(0.01%)#1,111 |
| 86. | Navy | 13 | 17,346(0.07%)#86 | 201,796(0.01%)#1,115 |
| 87. | Harrisonburg | 10 | 17,346(0.06%)#87 | 201,796(0.00%)#1,177 |
| 88. | Vansant | 10 | 17,346(0.06%)#88 | 201,796(0.00%)#1,189 |
| 89. | Franklin Farm | 9 | 17,346(0.05%)#89 | 201,796(0.00%)#1,208 |
| 90. | Pulaski | 8 | 17,346(0.05%)#90 | 201,796(0.00%)#1,234 |
| 91. | Salem | 7 | 17,346(0.04%)#91 | 201,796(0.00%)#1,256 |
| 92. | Aquia Harbour | 4 | 17,346(0.02%)#92 | 201,796(0.00%)#1,352 |
| 93. | Hayfield | 4 | 17,346(0.02%)#93 | 201,796(0.00%)#1,353 |
| 94. | Ashland | 3 | 17,346(0.02%)#94 | 201,796(0.00%)#1,377 |
| 95. | George Mason | 1 | 17,346(0.01%)#95 | 201,796(0.00%)#1,427 |
| 96. | Clifton | 1 | 17,346(0.01%)#96 | 201,796(0.00%)#1,438 |
Common Questions
What are the Top 10 Cities with the Most Immigrants from Ghana in Virginia?
Top 10 Cities with the Most Immigrants from Ghana in Virginia are:
#1
1,669
#2
1,187
#3
1,145
#4
870
#5
495
#6
491
#7
476
#8
387
#9
383
#10
381
What city has the Most Immigrants from Ghana in Virginia?
Cherry Hill has the Most Immigrants from Ghana in Virginia with 1,669.
What is the Total Immigrants from Ghana in the State of Virginia?
Total Immigrants from Ghana in Virginia is 17,346.
What is the Total Immigrants from Ghana in the United States?
Total Immigrants from Ghana in the United States is 201,796.