Cities with the Most Immigrants from Brazil in Missouri
RELATED REPORTS & OPTIONS
Brazil
Missouri
Compare Cities
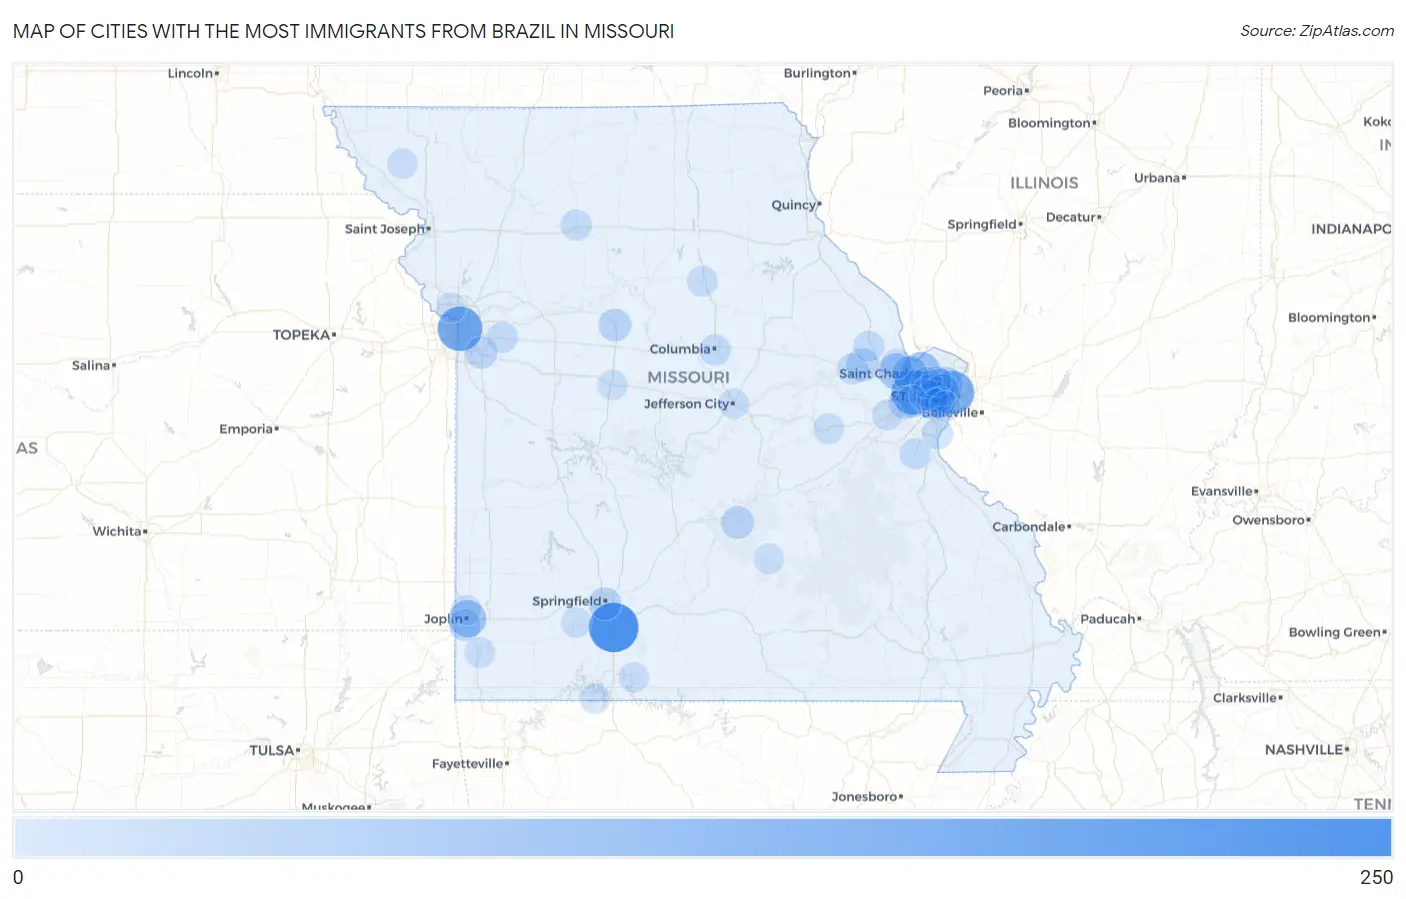
Map of Cities with the Most Immigrants from Brazil in Missouri
0
250
Cities with the Most Immigrants from Brazil in Missouri
| City | Brazil | vs State | vs National | |
| 1. | Ozark | 210 | 1,861(11.28%)#1 | 552,373(0.04%)#381 |
| 2. | Kansas City | 155 | 1,861(8.33%)#2 | 552,373(0.03%)#476 |
| 3. | Chesterfield | 153 | 1,861(8.22%)#3 | 552,373(0.03%)#482 |
| 4. | St Louis | 142 | 1,861(7.63%)#4 | 552,373(0.03%)#522 |
| 5. | St Charles | 85 | 1,861(4.57%)#5 | 552,373(0.02%)#790 |
| 6. | Joplin | 75 | 1,861(4.03%)#6 | 552,373(0.01%)#874 |
| 7. | O Fallon | 62 | 1,861(3.33%)#7 | 552,373(0.01%)#1,001 |
| 8. | St Peters | 61 | 1,861(3.28%)#8 | 552,373(0.01%)#1,017 |
| 9. | Overland | 58 | 1,861(3.12%)#9 | 552,373(0.01%)#1,060 |
| 10. | Ladue | 58 | 1,861(3.12%)#10 | 552,373(0.01%)#1,061 |
| 11. | Creve Coeur | 42 | 1,861(2.26%)#11 | 552,373(0.01%)#1,305 |
| 12. | Normandy | 37 | 1,861(1.99%)#12 | 552,373(0.01%)#1,416 |
| 13. | Wright City | 32 | 1,861(1.72%)#13 | 552,373(0.01%)#1,571 |
| 14. | Fort Leonard Wood | 28 | 1,861(1.50%)#14 | 552,373(0.01%)#1,674 |
| 15. | Marshall | 28 | 1,861(1.50%)#15 | 552,373(0.01%)#1,675 |
| 16. | Springfield | 27 | 1,861(1.45%)#16 | 552,373(0.00%)#1,698 |
| 17. | Wildwood | 27 | 1,861(1.45%)#17 | 552,373(0.00%)#1,709 |
| 18. | Ellisville | 26 | 1,861(1.40%)#18 | 552,373(0.00%)#1,764 |
| 19. | Kirkwood | 24 | 1,861(1.29%)#19 | 552,373(0.00%)#1,823 |
| 20. | Lee S Summit | 23 | 1,861(1.24%)#20 | 552,373(0.00%)#1,852 |
| 21. | University City | 20 | 1,861(1.07%)#21 | 552,373(0.00%)#2,008 |
| 22. | Shoal Creek Drive | 19 | 1,861(1.02%)#22 | 552,373(0.00%)#2,097 |
| 23. | Frontenac | 16 | 1,861(0.86%)#23 | 552,373(0.00%)#2,257 |
| 24. | Town And Country | 15 | 1,861(0.81%)#24 | 552,373(0.00%)#2,300 |
| 25. | Columbia | 13 | 1,861(0.70%)#25 | 552,373(0.00%)#2,423 |
| 26. | Maryland Heights | 13 | 1,861(0.70%)#26 | 552,373(0.00%)#2,434 |
| 27. | Chillicothe | 11 | 1,861(0.59%)#27 | 552,373(0.00%)#2,607 |
| 28. | Truesdale | 11 | 1,861(0.59%)#28 | 552,373(0.00%)#2,644 |
| 29. | Troy | 10 | 1,861(0.54%)#29 | 552,373(0.00%)#2,692 |
| 30. | Hillsboro | 10 | 1,861(0.54%)#30 | 552,373(0.00%)#2,727 |
| 31. | Webster Groves | 9 | 1,861(0.48%)#31 | 552,373(0.00%)#2,766 |
| 32. | Grain Valley | 9 | 1,861(0.48%)#32 | 552,373(0.00%)#2,778 |
| 33. | Imperial | 9 | 1,861(0.48%)#33 | 552,373(0.00%)#2,809 |
| 34. | Gerald | 8 | 1,861(0.43%)#34 | 552,373(0.00%)#2,921 |
| 35. | Moberly | 7 | 1,861(0.38%)#35 | 552,373(0.00%)#2,955 |
| 36. | Gray Summit | 7 | 1,861(0.38%)#36 | 552,373(0.00%)#2,990 |
| 37. | Sedalia | 5 | 1,861(0.27%)#37 | 552,373(0.00%)#3,120 |
| 38. | Licking | 5 | 1,861(0.27%)#38 | 552,373(0.00%)#3,145 |
| 39. | St Ann | 4 | 1,861(0.21%)#39 | 552,373(0.00%)#3,198 |
| 40. | Neosho | 4 | 1,861(0.21%)#40 | 552,373(0.00%)#3,199 |
| 41. | St Paul | 4 | 1,861(0.21%)#41 | 552,373(0.00%)#3,223 |
| 42. | Oakland | 4 | 1,861(0.21%)#42 | 552,373(0.00%)#3,247 |
| 43. | Kissee Mills | 4 | 1,861(0.21%)#43 | 552,373(0.00%)#3,258 |
| 44. | Jefferson City | 3 | 1,861(0.16%)#44 | 552,373(0.00%)#3,286 |
| 45. | Billings | 3 | 1,861(0.16%)#45 | 552,373(0.00%)#3,340 |
| 46. | Maitland | 3 | 1,861(0.16%)#46 | 552,373(0.00%)#3,359 |
| 47. | Airport Drive | 2 | 1,861(0.11%)#47 | 552,373(0.00%)#3,413 |
| 48. | Blue Eye | 2 | 1,861(0.11%)#48 | 552,373(0.00%)#3,427 |
| 49. | Wilbur Park | 2 | 1,861(0.11%)#49 | 552,373(0.00%)#3,428 |
| 50. | Platte Woods | 1 | 1,861(0.05%)#50 | 552,373(0.00%)#3,482 |
Common Questions
What are the Top 10 Cities with the Most Immigrants from Brazil in Missouri?
Top 10 Cities with the Most Immigrants from Brazil in Missouri are:
#1
210
#2
155
#3
153
#4
142
#5
85
#6
75
#7
62
#8
61
#9
58
#10
58
What city has the Most Immigrants from Brazil in Missouri?
Ozark has the Most Immigrants from Brazil in Missouri with 210.
What is the Total Immigrants from Brazil in the State of Missouri?
Total Immigrants from Brazil in Missouri is 1,861.
What is the Total Immigrants from Brazil in the United States?
Total Immigrants from Brazil in the United States is 552,373.