Cities with the Highest Percentage of Immigrants from Colombia in Virginia
RELATED REPORTS & OPTIONS
Colombia
Virginia
Compare Cities
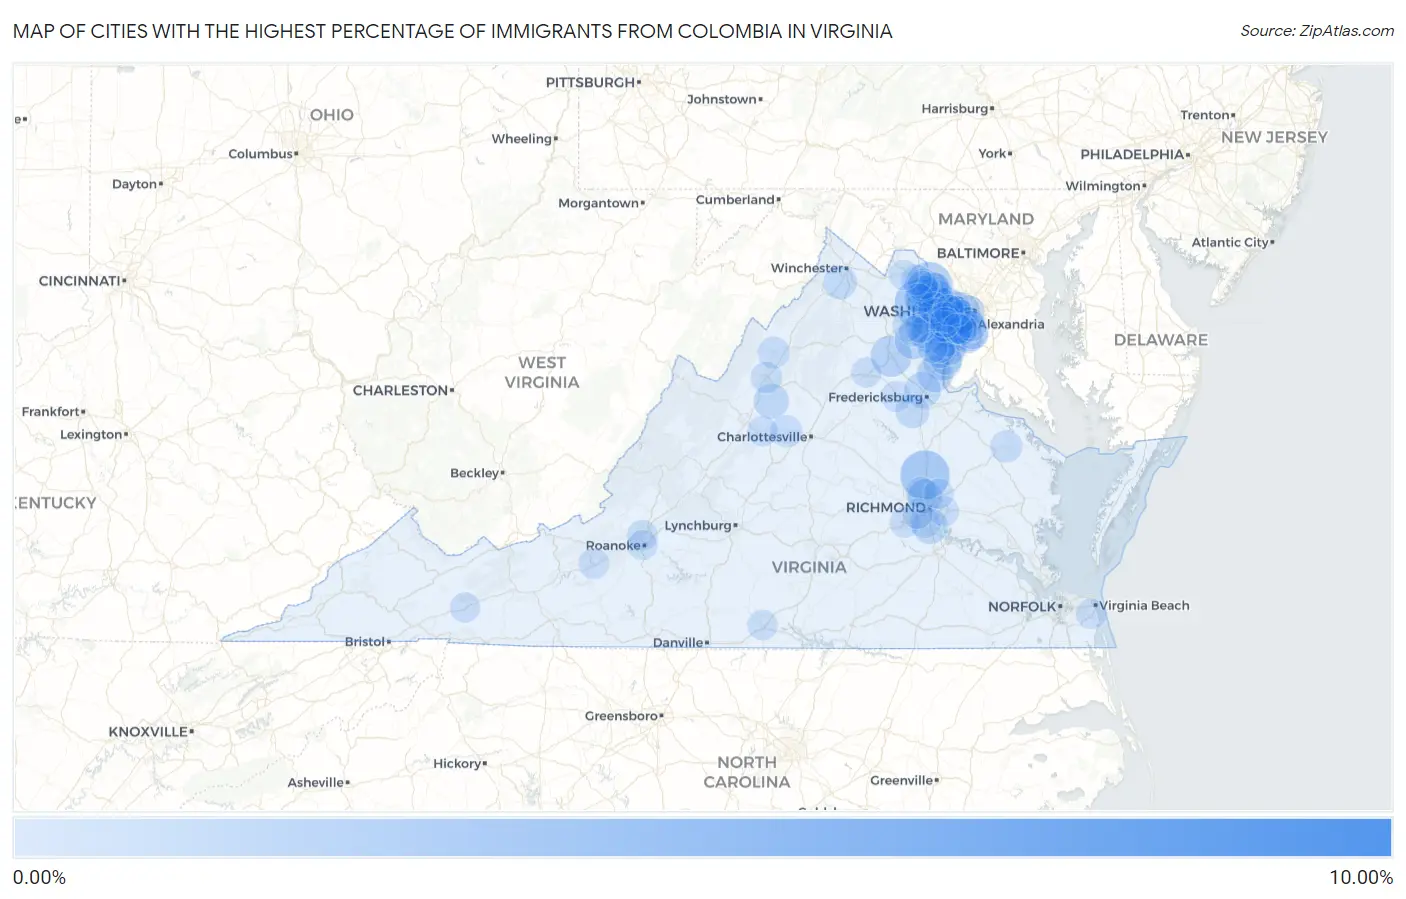
Map of Cities with the Highest Percentage of Immigrants from Colombia in Virginia
0.00%
10.00%
Cities with the Highest Percentage of Immigrants from Colombia in Virginia
| City | Colombia | vs State | vs National | |
| 1. | Fairfield | 9.50% | 0.17%(+9.33)#-1 | 0.26%(+9.24)#0 |
| 2. | Ashland | 2.40% | 0.17%(+2.24)#107 | 0.26%(+2.14)#1,915 |
| 3. | Arcola | 2.34% | 0.17%(+2.17)#108 | 0.26%(+2.08)#1,916 |
| 4. | University Center | 2.27% | 0.17%(+2.11)#109 | 0.26%(+2.01)#1,917 |
| 5. | Mantua | 2.08% | 0.17%(+1.92)#110 | 0.26%(+1.82)#1,918 |
| 6. | Union Mill | 2.05% | 0.17%(+1.88)#111 | 0.26%(+1.79)#1,919 |
| 7. | Woodlawn Cdp Fairfax County | 1.50% | 0.17%(+1.33)#112 | 0.26%(+1.24)#1,920 |
| 8. | Bealeton | 1.41% | 0.17%(+1.25)#113 | 0.26%(+1.15)#1,921 |
| 9. | Falls Church | 1.36% | 0.17%(+1.19)#133 | 0.26%(+1.10)#3,044 |
| 10. | West Springfield | 1.13% | 0.17%(+0.958)#134 | 0.26%(+0.865)#3,045 |
| 11. | Nokesville | 1.10% | 0.17%(+0.935)#135 | 0.26%(+0.842)#3,046 |
| 12. | Triangle | 1.09% | 0.17%(+0.926)#136 | 0.26%(+0.833)#3,047 |
| 13. | Dulles Town Center | 1.02% | 0.17%(+0.852)#137 | 0.26%(+0.760)#3,048 |
| 14. | Hybla Valley | 0.91% | 0.17%(+0.744)#138 | 0.26%(+0.651)#3,049 |
| 15. | Aquia Harbour | 0.88% | 0.17%(+0.711)#139 | 0.26%(+0.618)#3,050 |
| 16. | Sterling | 0.86% | 0.17%(+0.696)#140 | 0.26%(+0.603)#3,051 |
| 17. | Southern Gateway | 0.86% | 0.17%(+0.695)#141 | 0.26%(+0.602)#3,052 |
| 18. | Laurel Hill | 0.82% | 0.17%(+0.650)#142 | 0.26%(+0.558)#3,053 |
| 19. | Bellwood | 0.78% | 0.17%(+0.616)#143 | 0.26%(+0.524)#3,054 |
| 20. | Buckhall | 0.77% | 0.17%(+0.599)#144 | 0.26%(+0.506)#3,055 |
| 21. | Grottoes | 0.72% | 0.17%(+0.556)#145 | 0.26%(+0.463)#3,056 |
| 22. | Centreville | 0.67% | 0.17%(+0.507)#146 | 0.26%(+0.414)#3,057 |
| 23. | Fair Lakes | 0.67% | 0.17%(+0.505)#147 | 0.26%(+0.413)#3,058 |
| 24. | Arlington | 0.67% | 0.17%(+0.503)#148 | 0.26%(+0.410)#3,059 |
| 25. | Herndon | 0.66% | 0.17%(+0.491)#149 | 0.26%(+0.398)#3,060 |
| 26. | Oakton | 0.65% | 0.17%(+0.481)#150 | 0.26%(+0.389)#3,061 |
| 27. | Lakeside | 0.64% | 0.17%(+0.476)#151 | 0.26%(+0.383)#3,062 |
| 28. | South Run | 0.59% | 0.17%(+0.423)#152 | 0.26%(+0.331)#3,063 |
| 29. | Stephens City | 0.57% | 0.17%(+0.402)#153 | 0.26%(+0.310)#3,064 |
| 30. | Newington Forest | 0.57% | 0.17%(+0.402)#154 | 0.26%(+0.309)#3,065 |
| 31. | Spotsylvania Courthouse | 0.56% | 0.17%(+0.392)#155 | 0.26%(+0.300)#3,066 |
| 32. | Merrifield | 0.54% | 0.17%(+0.375)#156 | 0.26%(+0.282)#3,067 |
| 33. | Tysons | 0.51% | 0.17%(+0.343)#157 | 0.26%(+0.251)#3,068 |
| 34. | Annandale | 0.51% | 0.17%(+0.343)#158 | 0.26%(+0.250)#3,069 |
| 35. | Chantilly | 0.49% | 0.17%(+0.326)#159 | 0.26%(+0.233)#3,070 |
| 36. | Wolf Trap | 0.47% | 0.17%(+0.304)#160 | 0.26%(+0.211)#3,071 |
| 37. | Dunn Loring | 0.47% | 0.17%(+0.304)#161 | 0.26%(+0.211)#3,072 |
| 38. | Moorefield | 0.44% | 0.17%(+0.270)#162 | 0.26%(+0.177)#3,073 |
| 39. | Lake Barcroft | 0.42% | 0.17%(+0.248)#163 | 0.26%(+0.155)#3,074 |
| 40. | Woodbridge | 0.42% | 0.17%(+0.248)#164 | 0.26%(+0.155)#3,075 |
| 41. | Navy | 0.41% | 0.17%(+0.245)#165 | 0.26%(+0.152)#3,076 |
| 42. | Fair Oaks | 0.40% | 0.17%(+0.237)#166 | 0.26%(+0.144)#3,077 |
| 43. | Cherry Hill | 0.40% | 0.17%(+0.228)#167 | 0.26%(+0.135)#3,078 |
| 44. | Dranesville | 0.39% | 0.17%(+0.219)#168 | 0.26%(+0.127)#3,079 |
| 45. | Warsaw | 0.39% | 0.17%(+0.219)#169 | 0.26%(+0.126)#3,080 |
| 46. | Burke | 0.38% | 0.17%(+0.208)#170 | 0.26%(+0.115)#3,081 |
| 47. | Reston | 0.37% | 0.17%(+0.205)#171 | 0.26%(+0.112)#3,082 |
| 48. | Crozet | 0.37% | 0.17%(+0.204)#172 | 0.26%(+0.111)#3,083 |
| 49. | Countryside | 0.36% | 0.17%(+0.195)#173 | 0.26%(+0.103)#3,084 |
| 50. | Broadway | 0.36% | 0.17%(+0.192)#174 | 0.26%(+0.100)#3,085 |
| 51. | Cascades | 0.36% | 0.17%(+0.191)#175 | 0.26%(+0.099)#3,086 |
| 52. | Loudoun Valley Estates | 0.35% | 0.17%(+0.185)#176 | 0.26%(+0.092)#3,087 |
| 53. | Manassas Park | 0.33% | 0.17%(+0.160)#177 | 0.26%(+0.067)#3,088 |
| 54. | Manassas | 0.31% | 0.17%(+0.147)#178 | 0.26%(+0.054)#3,089 |
| 55. | Lake Ridge | 0.31% | 0.17%(+0.146)#179 | 0.26%(+0.053)#3,090 |
| 56. | Mount Vernon | 0.31% | 0.17%(+0.141)#180 | 0.26%(+0.048)#3,091 |
| 57. | South Riding | 0.31% | 0.17%(+0.138)#181 | 0.26%(+0.046)#3,092 |
| 58. | Greenbriar | 0.29% | 0.17%(+0.122)#182 | 0.26%(+0.030)#3,093 |
| 59. | Harrisonburg | 0.29% | 0.17%(+0.120)#183 | 0.26%(+0.028)#3,094 |
| 60. | Fairfax Station | 0.29% | 0.17%(+0.118)#184 | 0.26%(+0.025)#3,144 |
| 61. | Montclair | 0.28% | 0.17%(+0.109)#185 | 0.26%(+0.016)#3,145 |
| 62. | Ashburn | 0.25% | 0.17%(+0.081)#186 | 0.26%(-0.012)#3,146 |
| 63. | Laurel | 0.24% | 0.17%(+0.071)#187 | 0.26%(-0.022)#3,164 |
| 64. | Meadowbrook | 0.23% | 0.17%(+0.062)#188 | 0.26%(-0.031)#3,165 |
| 65. | Lake Wilderness | 0.22% | 0.17%(+0.057)#189 | 0.26%(-0.036)#3,166 |
| 66. | Burke Centre | 0.22% | 0.17%(+0.056)#190 | 0.26%(-0.037)#3,167 |
| 67. | Fort Hunt | 0.22% | 0.17%(+0.051)#191 | 0.26%(-0.041)#3,168 |
| 68. | Gainesville | 0.21% | 0.17%(+0.045)#192 | 0.26%(-0.048)#3,169 |
| 69. | Lansdowne | 0.21% | 0.17%(+0.043)#193 | 0.26%(-0.050)#3,170 |
| 70. | Christiansburg | 0.21% | 0.17%(+0.042)#194 | 0.26%(-0.051)#3,171 |
| 71. | Franconia | 0.21% | 0.17%(+0.039)#195 | 0.26%(-0.053)#3,172 |
| 72. | Dale City | 0.20% | 0.17%(+0.037)#196 | 0.26%(-0.056)#3,173 |
| 73. | Alexandria | 0.20% | 0.17%(+0.034)#197 | 0.26%(-0.058)#3,174 |
| 74. | Waynesboro | 0.20% | 0.17%(+0.030)#198 | 0.26%(-0.063)#3,175 |
| 75. | Hollins | 0.20% | 0.17%(+0.028)#199 | 0.26%(-0.065)#3,176 |
| 76. | Belmont | 0.19% | 0.17%(+0.025)#200 | 0.26%(-0.068)#3,177 |
| 77. | Franklin Farm | 0.19% | 0.17%(+0.018)#201 | 0.26%(-0.075)#3,178 |
| 78. | Leesburg | 0.18% | 0.17%(+0.016)#202 | 0.26%(-0.076)#3,179 |
| 79. | Virginia Beach | 0.18% | 0.17%(+0.016)#203 | 0.26%(-0.077)#3,180 |
| 80. | Independent Hill | 0.18% | 0.17%(+0.015)#204 | 0.26%(-0.077)#3,181 |
| 81. | Brandermill | 0.18% | 0.17%(+0.015)#205 | 0.26%(-0.078)#3,182 |
| 82. | Sandston | 0.18% | 0.17%(+0.014)#206 | 0.26%(-0.078)#3,183 |
| 83. | Kingstowne | 0.18% | 0.17%(+0.014)#207 | 0.26%(-0.079)#3,184 |
| 84. | Bull Run | 0.18% | 0.17%(+0.013)#208 | 0.26%(-0.079)#3,185 |
| 85. | Huntington | 0.18% | 0.17%(+0.012)#209 | 0.26%(-0.080)#3,186 |
| 86. | Fairfax | 0.18% | 0.17%(+0.010)#210 | 0.26%(-0.083)#3,187 |
| 87. | South Boston | 0.18% | 0.17%(+0.009)#211 | 0.26%(-0.084)#3,188 |
| 88. | Idylwood | 0.17% | 0.17%(+0.007)#212 | 0.26%(-0.086)#3,189 |
| 89. | Vienna | 0.17% | 0.17%(+0.003)#213 | 0.26%(-0.089)#3,190 |
| 90. | Manchester | 0.17% | 0.17%(+0.000)#214 | 0.26%(-0.092)#3,191 |
| 91. | Culpeper | 0.16% | 0.17%(-0.003)#215 | 0.26%(-0.096)#3,192 |
| 92. | Brambleton | 0.16% | 0.17%(-0.005)#216 | 0.26%(-0.098)#3,193 |
| 93. | Roanoke | 0.16% | 0.17%(-0.006)#217 | 0.26%(-0.099)#3,194 |
| 94. | Springfield | 0.16% | 0.17%(-0.006)#218 | 0.26%(-0.099)#3,195 |
| 95. | Leesylvania | 0.16% | 0.17%(-0.009)#219 | 0.26%(-0.102)#3,196 |
| 96. | Mechanicsville | 0.15% | 0.17%(-0.019)#220 | 0.26%(-0.111)#3,197 |
| 97. | Hamilton | 0.15% | 0.17%(-0.019)#221 | 0.26%(-0.112)#3,198 |
| 98. | Kings Park West | 0.14% | 0.17%(-0.024)#222 | 0.26%(-0.117)#3,199 |
| 99. | Linton Hall | 0.14% | 0.17%(-0.027)#223 | 0.26%(-0.119)#3,200 |
| 100. | Marion | 0.14% | 0.17%(-0.028)#224 | 0.26%(-0.120)#3,201 |
Common Questions
What are the Top 10 Cities with the Highest Percentage of Immigrants from Colombia in Virginia?
Top 10 Cities with the Highest Percentage of Immigrants from Colombia in Virginia are:
#1
2.40%
#2
2.34%
#3
2.27%
#4
2.08%
#5
1.41%
#6
1.36%
#7
1.13%
#8
1.10%
#9
1.09%
#10
1.02%
What city has the Highest Percentage of Immigrants from Colombia in Virginia?
Ashland has the Highest Percentage of Immigrants from Colombia in Virginia with 2.40%.
What is the Percentage of Immigrants from Colombia in the State of Virginia?
Percentage of Immigrants from Colombia in Virginia is 0.17%.
What is the Percentage of Immigrants from Colombia in the United States?
Percentage of Immigrants from Colombia in the United States is 0.26%.