Cities with the Highest Percentage of Immigrants from Colombia in North Carolina
RELATED REPORTS & OPTIONS
Colombia
North Carolina
Compare Cities
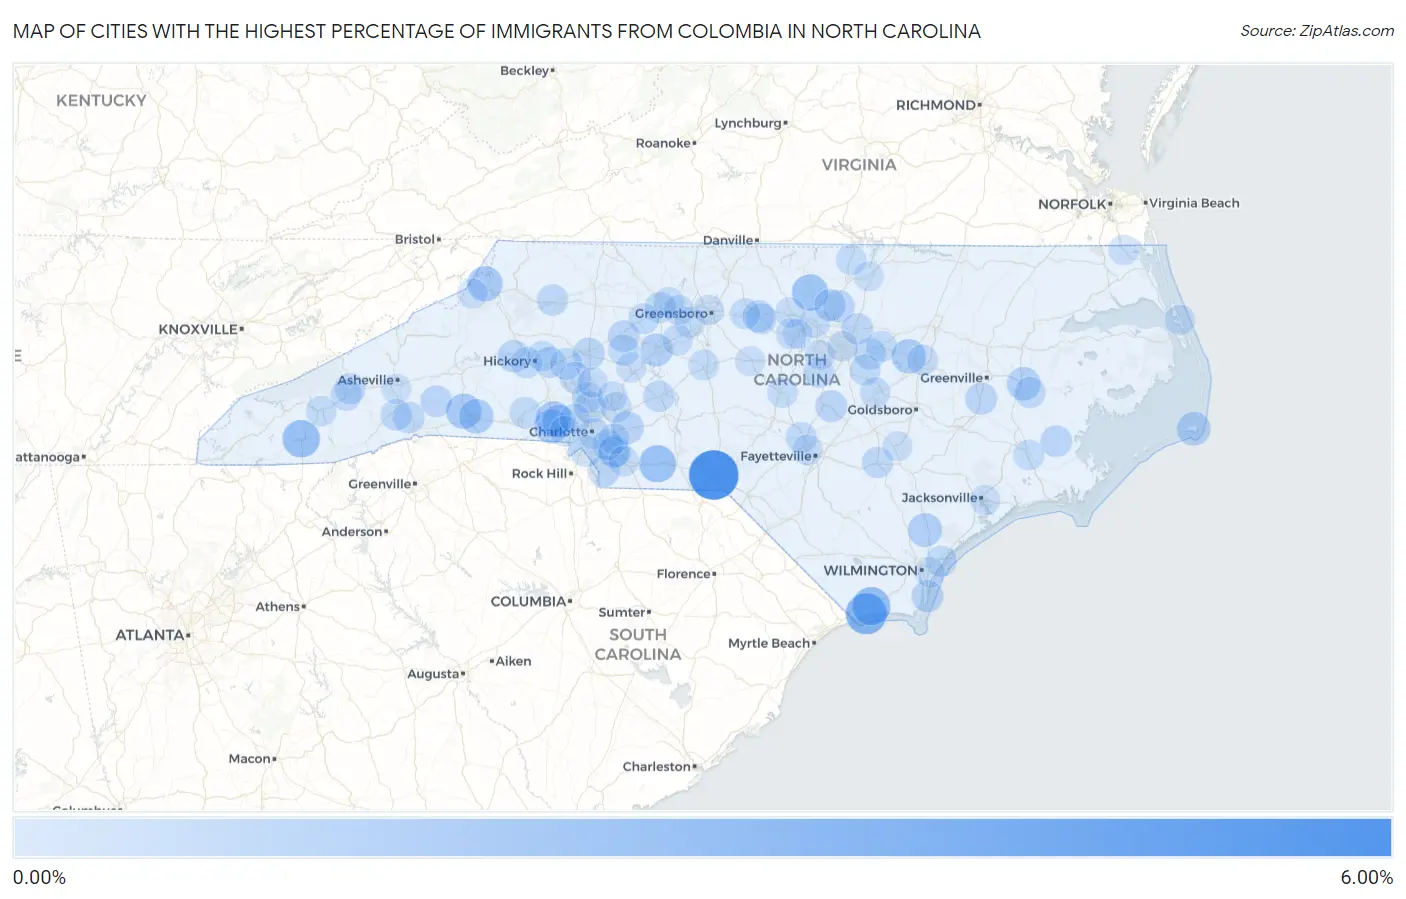
Map of Cities with the Highest Percentage of Immigrants from Colombia in North Carolina
0.00%
6.00%
Cities with the Highest Percentage of Immigrants from Colombia in North Carolina
| City | Colombia | vs State | vs National | |
| 1. | East Rockingham | 5.32% | 0.17%(+5.14)#-1 | 0.26%(+5.06)#0 |
| 2. | Ocean Isle Beach | 2.97% | 0.17%(+2.79)#0 | 0.26%(+2.71)#1 |
| 3. | Shallotte | 2.23% | 0.17%(+2.06)#1 | 0.26%(+1.97)#2 |
| 4. | Franklin | 2.01% | 0.17%(+1.83)#2 | 0.26%(+1.75)#3 |
| 5. | Peachland | 1.94% | 0.17%(+1.76)#3 | 0.26%(+1.68)#4 |
| 6. | Rougemont | 1.69% | 0.17%(+1.51)#4 | 0.26%(+1.43)#5 |
| 7. | Rutherfordton | 1.44% | 0.17%(+1.27)#5 | 0.26%(+1.18)#6 |
| 8. | Dallas | 1.41% | 0.17%(+1.23)#47 | 0.26%(+1.15)#696 |
| 9. | Cove Creek | 1.40% | 0.17%(+1.23)#48 | 0.26%(+1.14)#697 |
| 10. | Sims | 1.23% | 0.17%(+1.06)#49 | 0.26%(+0.972)#698 |
| 11. | Gastonia | 1.22% | 0.17%(+1.04)#111 | 0.26%(+0.958)#1,963 |
| 12. | Forest City | 1.18% | 0.17%(+1.01)#112 | 0.26%(+0.923)#1,964 |
| 13. | St Helena | 1.08% | 0.17%(+0.901)#113 | 0.26%(+0.815)#1,965 |
| 14. | Buxton | 1.02% | 0.17%(+0.841)#114 | 0.26%(+0.756)#1,966 |
| 15. | Washington | 0.99% | 0.17%(+0.819)#129 | 0.26%(+0.734)#2,487 |
| 16. | Ranlo | 0.91% | 0.17%(+0.739)#130 | 0.26%(+0.654)#2,488 |
| 17. | Lexington | 0.85% | 0.17%(+0.673)#131 | 0.26%(+0.587)#2,489 |
| 18. | Midland | 0.71% | 0.17%(+0.531)#132 | 0.26%(+0.446)#2,490 |
| 19. | Rutherford College | 0.63% | 0.17%(+0.451)#133 | 0.26%(+0.366)#2,491 |
| 20. | Statesville | 0.60% | 0.17%(+0.427)#134 | 0.26%(+0.342)#2,492 |
| 21. | Creedmoor | 0.60% | 0.17%(+0.421)#135 | 0.26%(+0.335)#2,493 |
| 22. | Buies Creek | 0.59% | 0.17%(+0.411)#136 | 0.26%(+0.325)#2,494 |
| 23. | Carolina Beach | 0.58% | 0.17%(+0.403)#137 | 0.26%(+0.317)#2,495 |
| 24. | Graham | 0.57% | 0.17%(+0.392)#138 | 0.26%(+0.306)#2,700 |
| 25. | Ayden | 0.56% | 0.17%(+0.385)#139 | 0.26%(+0.300)#2,701 |
| 26. | Lake Park | 0.54% | 0.17%(+0.364)#140 | 0.26%(+0.279)#2,702 |
| 27. | Huntersville | 0.53% | 0.17%(+0.355)#141 | 0.26%(+0.269)#2,703 |
| 28. | Butner | 0.51% | 0.17%(+0.339)#142 | 0.26%(+0.254)#2,704 |
| 29. | Waxhaw | 0.51% | 0.17%(+0.338)#143 | 0.26%(+0.253)#2,705 |
| 30. | Lake Lure | 0.51% | 0.17%(+0.333)#144 | 0.26%(+0.248)#2,706 |
| 31. | Mocksville | 0.51% | 0.17%(+0.333)#145 | 0.26%(+0.248)#2,707 |
| 32. | Bayboro | 0.50% | 0.17%(+0.322)#146 | 0.26%(+0.236)#2,708 |
| 33. | Pineville | 0.48% | 0.17%(+0.310)#147 | 0.26%(+0.224)#2,709 |
| 34. | Catawba | 0.48% | 0.17%(+0.302)#148 | 0.26%(+0.216)#2,710 |
| 35. | Hendersonville | 0.47% | 0.17%(+0.296)#149 | 0.26%(+0.210)#2,711 |
| 36. | Wendell | 0.45% | 0.17%(+0.279)#150 | 0.26%(+0.194)#2,712 |
| 37. | Lake Norman Of Catawba | 0.45% | 0.17%(+0.273)#151 | 0.26%(+0.187)#2,713 |
| 38. | Waynesville | 0.45% | 0.17%(+0.272)#152 | 0.26%(+0.186)#2,714 |
| 39. | Cricket | 0.44% | 0.17%(+0.267)#153 | 0.26%(+0.182)#2,715 |
| 40. | Richfield | 0.43% | 0.17%(+0.260)#154 | 0.26%(+0.174)#2,716 |
| 41. | Horse Shoe | 0.43% | 0.17%(+0.257)#155 | 0.26%(+0.172)#2,717 |
| 42. | Clinton | 0.42% | 0.17%(+0.244)#156 | 0.26%(+0.159)#2,718 |
| 43. | Wake Forest | 0.42% | 0.17%(+0.244)#157 | 0.26%(+0.158)#2,719 |
| 44. | River Road | 0.40% | 0.17%(+0.225)#158 | 0.26%(+0.139)#2,720 |
| 45. | Charlotte | 0.40% | 0.17%(+0.221)#159 | 0.26%(+0.136)#2,721 |
| 46. | Hildebran | 0.38% | 0.17%(+0.205)#160 | 0.26%(+0.120)#2,722 |
| 47. | Porters Neck | 0.38% | 0.17%(+0.202)#161 | 0.26%(+0.117)#2,723 |
| 48. | Spring Lake | 0.38% | 0.17%(+0.201)#162 | 0.26%(+0.116)#2,724 |
| 49. | Lake Junaluska | 0.37% | 0.17%(+0.195)#163 | 0.26%(+0.110)#2,725 |
| 50. | Winston Salem | 0.37% | 0.17%(+0.192)#164 | 0.26%(+0.106)#2,726 |
| 51. | Waco | 0.36% | 0.17%(+0.185)#165 | 0.26%(+0.100)#2,727 |
| 52. | Conover | 0.35% | 0.17%(+0.180)#166 | 0.26%(+0.095)#2,728 |
| 53. | Zebulon | 0.35% | 0.17%(+0.176)#167 | 0.26%(+0.090)#2,729 |
| 54. | Cornelius | 0.34% | 0.17%(+0.169)#168 | 0.26%(+0.084)#2,730 |
| 55. | Cooleemee | 0.34% | 0.17%(+0.168)#169 | 0.26%(+0.083)#2,731 |
| 56. | Clayton | 0.34% | 0.17%(+0.165)#170 | 0.26%(+0.079)#2,732 |
| 57. | Swepsonville | 0.32% | 0.17%(+0.150)#171 | 0.26%(+0.065)#2,733 |
| 58. | Indian Trail | 0.32% | 0.17%(+0.143)#172 | 0.26%(+0.057)#2,734 |
| 59. | Holly Springs | 0.31% | 0.17%(+0.137)#173 | 0.26%(+0.052)#2,776 |
| 60. | Wilson | 0.31% | 0.17%(+0.133)#174 | 0.26%(+0.048)#2,777 |
| 61. | Asheboro | 0.31% | 0.17%(+0.132)#175 | 0.26%(+0.046)#2,778 |
| 62. | Clemmons | 0.31% | 0.17%(+0.131)#176 | 0.26%(+0.045)#2,779 |
| 63. | Matthews | 0.30% | 0.17%(+0.126)#177 | 0.26%(+0.041)#2,780 |
| 64. | High Point | 0.30% | 0.17%(+0.124)#178 | 0.26%(+0.039)#2,781 |
| 65. | Walkertown | 0.30% | 0.17%(+0.123)#179 | 0.26%(+0.038)#2,782 |
| 66. | Concord | 0.28% | 0.17%(+0.108)#180 | 0.26%(+0.023)#2,783 |
| 67. | Mint Hill | 0.27% | 0.17%(+0.093)#181 | 0.26%(+0.008)#2,784 |
| 68. | Stovall | 0.27% | 0.17%(+0.093)#182 | 0.26%(+0.007)#2,785 |
| 69. | Thomasville | 0.26% | 0.17%(+0.087)#183 | 0.26%(+0.002)#2,786 |
| 70. | Durham | 0.26% | 0.17%(+0.082)#184 | 0.26%(-0.003)#2,787 |
| 71. | Carrboro | 0.25% | 0.17%(+0.080)#185 | 0.26%(-0.006)#2,788 |
| 72. | James City | 0.25% | 0.17%(+0.076)#186 | 0.26%(-0.009)#2,789 |
| 73. | Burlington | 0.24% | 0.17%(+0.066)#187 | 0.26%(-0.019)#2,790 |
| 74. | St Stephens | 0.24% | 0.17%(+0.064)#188 | 0.26%(-0.021)#2,791 |
| 75. | Sylva | 0.23% | 0.17%(+0.056)#189 | 0.26%(-0.029)#2,792 |
| 76. | Sanford | 0.23% | 0.17%(+0.053)#190 | 0.26%(-0.033)#2,793 |
| 77. | Smithfield | 0.23% | 0.17%(+0.051)#191 | 0.26%(-0.034)#2,794 |
| 78. | Fayetteville | 0.21% | 0.17%(+0.031)#192 | 0.26%(-0.054)#2,795 |
| 79. | Kill Devil Hills | 0.20% | 0.17%(+0.021)#193 | 0.26%(-0.064)#2,796 |
| 80. | Moyock | 0.19% | 0.17%(+0.016)#194 | 0.26%(-0.070)#2,797 |
| 81. | Raleigh | 0.18% | 0.17%(+0.010)#195 | 0.26%(-0.075)#2,798 |
| 82. | Monroe | 0.17% | 0.17%(-0.003)#196 | 0.26%(-0.088)#2,799 |
| 83. | Cramerton | 0.17% | 0.17%(-0.005)#197 | 0.26%(-0.090)#2,800 |
| 84. | Mooresville | 0.17% | 0.17%(-0.005)#198 | 0.26%(-0.090)#3,082 |
| 85. | Greensboro | 0.16% | 0.17%(-0.013)#199 | 0.26%(-0.099)#3,083 |
| 86. | Mount Holly | 0.16% | 0.17%(-0.016)#200 | 0.26%(-0.101)#3,084 |
| 87. | Jacksonville | 0.16% | 0.17%(-0.019)#201 | 0.26%(-0.104)#3,141 |
| 88. | Cary | 0.16% | 0.17%(-0.019)#202 | 0.26%(-0.104)#3,142 |
| 89. | Anderson Creek | 0.15% | 0.17%(-0.022)#203 | 0.26%(-0.108)#3,143 |
| 90. | Kernersville | 0.14% | 0.17%(-0.031)#204 | 0.26%(-0.116)#3,144 |
| 91. | Hillsborough | 0.13% | 0.17%(-0.049)#205 | 0.26%(-0.134)#3,145 |
| 92. | Wilmington | 0.13% | 0.17%(-0.049)#206 | 0.26%(-0.134)#3,146 |
| 93. | Beech Mountain | 0.13% | 0.17%(-0.049)#207 | 0.26%(-0.135)#3,147 |
| 94. | Salisbury | 0.12% | 0.17%(-0.050)#208 | 0.26%(-0.136)#3,148 |
| 95. | Chapel Hill | 0.12% | 0.17%(-0.052)#209 | 0.26%(-0.138)#3,149 |
| 96. | Asheville | 0.12% | 0.17%(-0.057)#210 | 0.26%(-0.143)#3,150 |
| 97. | Kannapolis | 0.11% | 0.17%(-0.064)#211 | 0.26%(-0.149)#3,151 |
| 98. | Faison | 0.11% | 0.17%(-0.069)#212 | 0.26%(-0.155)#3,152 |
| 99. | Siler City | 0.10% | 0.17%(-0.073)#213 | 0.26%(-0.158)#3,153 |
| 100. | Henderson | 0.10% | 0.17%(-0.075)#214 | 0.26%(-0.160)#3,154 |
Common Questions
What are the Top 10 Cities with the Highest Percentage of Immigrants from Colombia in North Carolina?
Top 10 Cities with the Highest Percentage of Immigrants from Colombia in North Carolina are:
#1
5.32%
#2
2.97%
#3
2.23%
#4
2.01%
#5
1.94%
#6
1.69%
#7
1.44%
#8
1.41%
#9
1.40%
#10
1.23%
What city has the Highest Percentage of Immigrants from Colombia in North Carolina?
East Rockingham has the Highest Percentage of Immigrants from Colombia in North Carolina with 5.32%.
What is the Percentage of Immigrants from Colombia in the State of North Carolina?
Percentage of Immigrants from Colombia in North Carolina is 0.17%.
What is the Percentage of Immigrants from Colombia in the United States?
Percentage of Immigrants from Colombia in the United States is 0.26%.