Cities with the Highest Percentage of Immigrants from Colombia in Indiana

RELATED REPORTS & OPTIONS

Colombia
Population
Families and Households
Female Fertility
Female Fertility (Unmarried)
Race (Community Size)
Race (Percentage)
Ancestry (Community Size)
AfghanAfricanAlaska NativeAlaskan AthabascanAlbanianAleutAlsatianAmericanApacheArabArapahoArgentineanArmenianAssyrian / Chaldean / SyriacAustralianAustrianBahamianBangladeshiBarbadianBasqueBelgianBelizeanBermudanBhutaneseBlackfeetBolivianBrazilianBritishBritish West IndianBulgarianBurmeseCajunCambodianCanadianCape VerdeanCarpatho RusynCelticCentral AmericanCentral American IndianCherokeeCheyenneChickasawChileanChineseChippewaChoctawColombianColvilleComancheCosta RicanCreeCreekCroatianCrowCubanCypriotCzechCzechoslovakianDanishDelawareDominicanDutchDutch West IndianEastern EuropeanEcuadorianEgyptianEnglishEstonianEthiopianEuropeanFijianFilipinoFinnishFrenchFrench American IndianFrench CanadianGermanGerman RussianGhanaianGreekGuamanian / ChamorroGuatemalanGuyaneseHaitianHmongHonduranHopiHoumaHungarianIcelanderIndian (Asian)IndonesianInupiatIranianIraqiIrishIroquoisIsraeliItalianJamaicanJapaneseJordanianKenyanKiowaKoreanLaotianLatvianLebaneseLiberianLithuanianLumbeeLuxembourgerMacedonianMalaysianMalteseMarshalleseMenomineeMexicanMexican American IndianMongolianMoroccanNative HawaiianNavajoNepaleseNew ZealanderNicaraguanNigerianNorthern EuropeanNorwegianOkinawanOsageOttawaPaiutePakistaniPalestinianPanamanianParaguayanPennsylvania GermanPeruvianPimaPolishPortuguesePotawatomiPuebloPuerto RicanPuget Sound SalishRomanianRussianSalvadoranSamoanScandinavianScotch-IrishScottishSeminoleSenegaleseSerbianShoshoneSierra LeoneanSiouxSlavicSlovakSloveneSomaliSouth AfricanSouth AmericanSouth American IndianSoviet UnionSpaniardSpanishSpanish AmericanSpanish American IndianSri LankanSubsaharan AfricanSudaneseSwedishSwissSyrianTaiwaneseThaiTlingit-HaidaTohono O'OdhamTonganTrinidadian and TobagonianTsimshianTurkishU.S. Virgin IslanderUgandanUkrainianUruguayanUteVenezuelanVietnameseWelshWest IndianYakamaYaquiYugoslavianYumanYup'ikZimbabwean
Ancestry (Percentage)
AfghanAfricanAlaska NativeAlaskan AthabascanAlbanianAleutAlsatianAmericanApacheArabArapahoArgentineanArmenianAssyrian / Chaldean / SyriacAustralianAustrianBahamianBangladeshiBarbadianBasqueBelgianBelizeanBermudanBhutaneseBlackfeetBolivianBrazilianBritishBritish West IndianBulgarianBurmeseCajunCambodianCanadianCape VerdeanCarpatho RusynCelticCentral AmericanCentral American IndianCherokeeCheyenneChickasawChileanChineseChippewaChoctawColombianColvilleComancheCosta RicanCreeCreekCroatianCrowCubanCypriotCzechCzechoslovakianDanishDelawareDominicanDutchDutch West IndianEastern EuropeanEcuadorianEgyptianEnglishEstonianEthiopianEuropeanFijianFilipinoFinnishFrenchFrench American IndianFrench CanadianGermanGerman RussianGhanaianGreekGuamanian / ChamorroGuatemalanGuyaneseHaitianHmongHonduranHopiHoumaHungarianIcelanderIndian (Asian)IndonesianInupiatIranianIraqiIrishIroquoisIsraeliItalianJamaicanJapaneseJordanianKenyanKiowaKoreanLaotianLatvianLebaneseLiberianLithuanianLumbeeLuxembourgerMacedonianMalaysianMalteseMarshalleseMenomineeMexicanMexican American IndianMongolianMoroccanNative HawaiianNavajoNepaleseNew ZealanderNicaraguanNigerianNorthern EuropeanNorwegianOkinawanOsageOttawaPaiutePakistaniPalestinianPanamanianParaguayanPennsylvania GermanPeruvianPimaPolishPortuguesePotawatomiPuebloPuerto RicanPuget Sound SalishRomanianRussianSalvadoranSamoanScandinavianScotch-IrishScottishSeminoleSenegaleseSerbianShoshoneSierra LeoneanSiouxSlavicSlovakSloveneSomaliSouth AfricanSouth AmericanSouth American IndianSoviet UnionSpaniardSpanishSpanish AmericanSpanish American IndianSri LankanSubsaharan AfricanSudaneseSwedishSwissSyrianTaiwaneseThaiTlingit-HaidaTohono O'OdhamTonganTrinidadian and TobagonianTsimshianTurkishU.S. Virgin IslanderUgandanUkrainianUruguayanUteVenezuelanVietnameseWelshWest IndianYakamaYaquiYugoslavianYumanYup'ikZimbabwean
Immigrant Origin (Total)
AfghanistanAfricaAlbaniaArgentinaArmeniaAsiaAustraliaAustriaAzoresBahamasBangladeshBarbadosBelarusBelgiumBelizeBoliviaBosnia and HerzegovinaBrazilBulgariaBurma / MyanmarCabo VerdeCambodiaCameroonCanadaCaribbeanCentral AmericaChileChinaColombiaCongoCosta RicaCroatiaCubaCzechoslovakiaDenmarkDominicaDominican RepublicEastern AfricaEastern AsiaEastern EuropeEcuadorEgyptEl SalvadorEnglandEritreaEthiopiaEuropeFijiFranceGermanyGhanaGreeceGrenadaGuatemalaGuyanaHaitiHondurasHong KongHungaryIndiaIndonesiaIranIraqIrelandIsraelItalyJamaicaJapanJordanKazakhstanKenyaKoreaKuwaitLaosLatin AmericaLatviaLebanonLiberiaLithuaniaMalaysiaMexicoMicronesiaMiddle AfricaMoldovaMoroccoNepalNetherlandsNicaraguaNigeriaNorth MacedoniaNorthern AfricaNorthern EuropeNorwayOceaniaPakistanPanamaPeruPhilippinesPolandPortugalRomaniaRussiaSaudi ArabiaScotlandSenegalSerbiaSierra LeoneSingaporeSomaliaSouth AfricaSouth AmericaSouth Central AsiaSouth Eastern AsiaSouthern EuropeSpainSri LankaSt. Vincent and the GrenadinesSudanSwedenSwitzerlandSyriaTaiwanThailandTrinidad and TobagoTurkeyUgandaUkraineUruguayUzbekistanVenezuelaVietnamWest IndiesWestern AfricaWestern AsiaWestern EuropeYemenZaireZimbabwe
Immigrant Origin (Percentage)
AfghanistanAfricaAlbaniaArgentinaArmeniaAsiaAustraliaAustriaAzoresBahamasBangladeshBarbadosBelarusBelgiumBelizeBoliviaBosnia and HerzegovinaBrazilBulgariaBurma / MyanmarCabo VerdeCambodiaCameroonCanadaCaribbeanCentral AmericaChileChinaColombiaCongoCosta RicaCroatiaCubaCzechoslovakiaDenmarkDominicaDominican RepublicEastern AfricaEastern AsiaEastern EuropeEcuadorEgyptEl SalvadorEnglandEritreaEthiopiaEuropeFijiFranceGermanyGhanaGreeceGrenadaGuatemalaGuyanaHaitiHondurasHong KongHungaryIndiaIndonesiaIranIraqIrelandIsraelItalyJamaicaJapanJordanKazakhstanKenyaKoreaKuwaitLaosLatin AmericaLatviaLebanonLiberiaLithuaniaMalaysiaMexicoMicronesiaMiddle AfricaMoldovaMoroccoNepalNetherlandsNicaraguaNigeriaNorth MacedoniaNorthern AfricaNorthern EuropeNorwayOceaniaPakistanPanamaPeruPhilippinesPolandPortugalRomaniaRussiaSaudi ArabiaScotlandSenegalSerbiaSierra LeoneSingaporeSomaliaSouth AfricaSouth AmericaSouth Central AsiaSouth Eastern AsiaSouthern EuropeSpainSri LankaSt. Vincent and the GrenadinesSudanSwedenSwitzerlandSyriaTaiwanThailandTrinidad and TobagoTurkeyUgandaUkraineUruguayUzbekistanVenezuelaVietnamWest IndiesWestern AfricaWestern AsiaWestern EuropeYemenZaireZimbabwe
Income
Income (Families)
Income (Households)
Poverty
Poverty (Families)
Unemployment
Employment Occupations
Employment Industries
Employer Class
Commute Time
Commute Means
School Enrollment
Education by Degree Field
Occupancy
Finances
Physical Characteristics
Indiana
Compare Cities
Comparison Subject

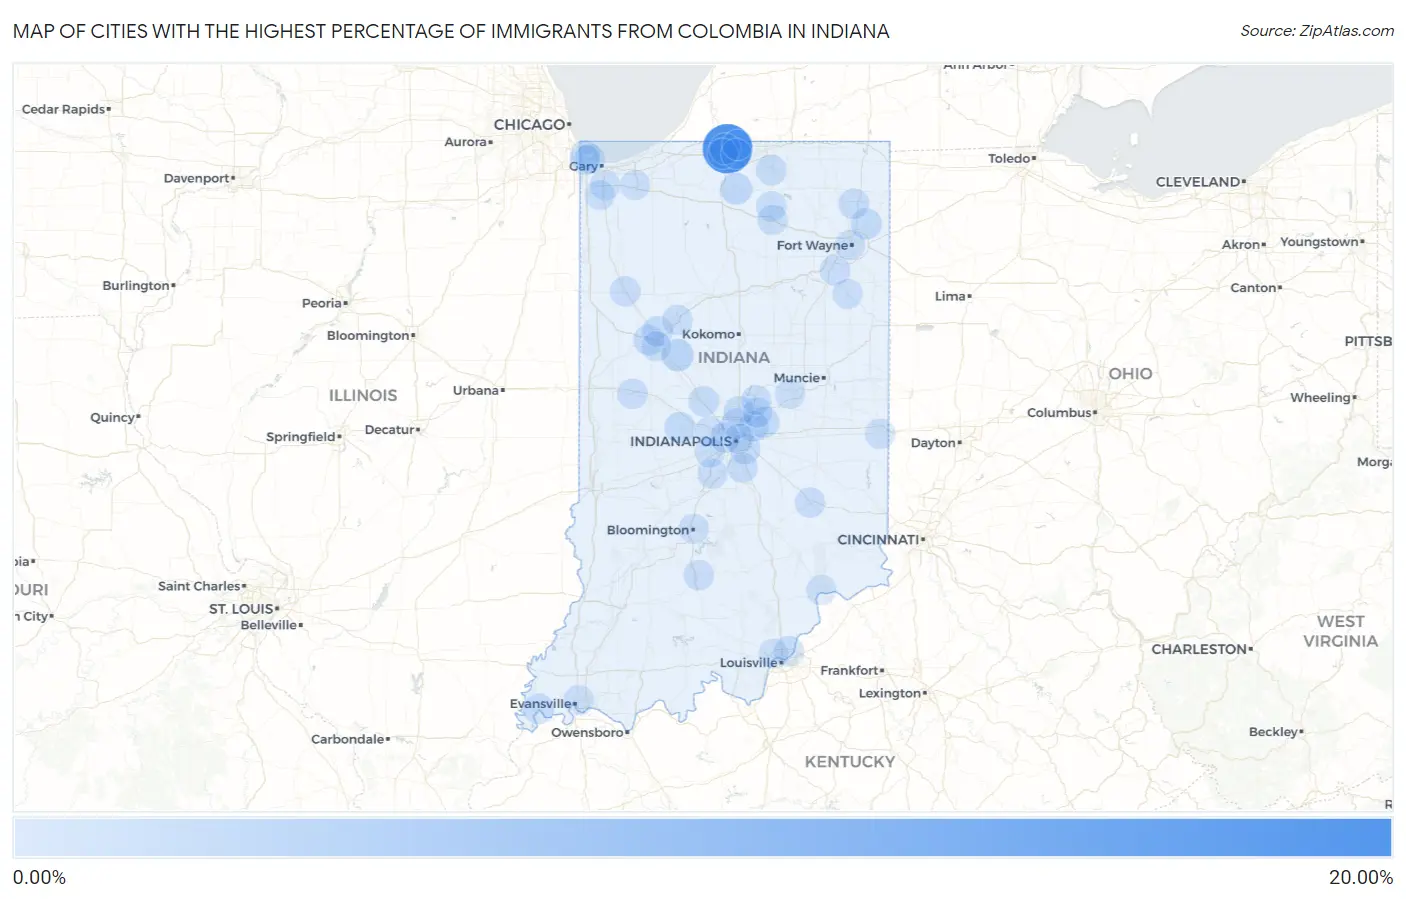
Map of Cities with the Highest Percentage of Immigrants from Colombia in Indiana

0.00%
20.00%
Cities with the Highest Percentage of Immigrants from Colombia in Indiana Map

Cities with the Highest Percentage of Immigrants from Colombia in Indiana

City Colombia vs State vs National
1.Indian Village16.54%0.046%(+16.5)#-10.26%(+16.3)#0
2.Mulberry1.72%0.046%(+1.67)#00.26%(+1.46)#1
3.Bremen1.48%0.046%(+1.43)#10.26%(+1.22)#2
4.Gilmer Park1.29%0.046%(+1.24)#20.26%(+1.03)#3
5.Liberty Center1.20%0.046%(+1.16)#30.26%(+0.945)#4
6.Leo Cedarville0.93%0.046%(+0.886)#40.26%(+0.672)#5
7.Mccordsville0.92%0.046%(+0.877)#50.26%(+0.663)#6
8.North Salem0.92%0.046%(+0.877)#60.26%(+0.663)#7
9.Goshen0.58%0.046%(+0.533)#110.26%(+0.319)#918
10.West Lafayette0.55%0.046%(+0.505)#340.26%(+0.291)#2,390
11.Roseland0.50%0.046%(+0.458)#350.26%(+0.244)#2,391
12.Lebanon0.49%0.046%(+0.440)#360.26%(+0.226)#2,392
13.Mount Vernon0.46%0.046%(+0.417)#370.26%(+0.203)#2,393
14.Garrett0.44%0.046%(+0.389)#380.26%(+0.175)#2,394
15.Beech Grove0.43%0.046%(+0.382)#410.26%(+0.168)#2,635
16.Meridian Hills0.40%0.046%(+0.355)#420.26%(+0.141)#2,636
17.Battle Ground0.39%0.046%(+0.340)#430.26%(+0.126)#2,637
18.Waynetown0.39%0.046%(+0.340)#440.26%(+0.126)#2,638
19.Remington0.34%0.046%(+0.291)#450.26%(+0.076)#2,639
20.Lawrence0.27%0.046%(+0.220)#460.26%(+0.006)#2,640
21.Delphi0.23%0.046%(+0.189)#470.26%(-0.025)#2,641
22.Leesburg0.21%0.046%(+0.166)#480.26%(-0.048)#2,642
23.Jeffersonville0.21%0.046%(+0.163)#490.26%(-0.051)#2,643
24.Warsaw0.19%0.046%(+0.148)#500.26%(-0.066)#2,644
25.Zanesville0.19%0.046%(+0.143)#510.26%(-0.071)#2,645
26.Carmel0.19%0.046%(+0.142)#520.26%(-0.072)#2,646
27.Bedford0.18%0.046%(+0.135)#530.26%(-0.079)#2,647
28.Greenwood0.17%0.046%(+0.122)#540.26%(-0.092)#2,648
29.Greensburg0.16%0.046%(+0.112)#550.26%(-0.103)#2,649
30.Speedway0.15%0.046%(+0.108)#560.26%(-0.106)#2,650
31.Whiting0.11%0.046%(+0.063)#570.26%(-0.151)#2,651
32.South Bend0.093%0.046%(+0.047)#580.26%(-0.167)#2,652
33.Madison0.089%0.046%(+0.044)#590.26%(-0.171)#2,653
34.Fort Wayne0.071%0.046%(+0.025)#600.26%(-0.189)#2,654
35.Indianapolis0.067%0.046%(+0.021)#610.26%(-0.193)#2,655
36.Richmond0.065%0.046%(+0.019)#620.26%(-0.195)#2,921
37.Bloomington0.063%0.046%(+0.017)#630.26%(-0.197)#3,123
38.Hammond0.061%0.046%(+0.015)#640.26%(-0.199)#3,124
39.Lafayette0.051%0.046%(+0.005)#650.26%(-0.209)#3,125
40.Anderson0.049%0.046%(+0.003)#660.26%(-0.211)#3,126
41.East Chicago0.046%0.046%(-0.000)#670.26%(-0.214)#3,127
42.Brooklyn0.044%0.046%(-0.001)#680.26%(-0.215)#3,128
43.New Albany0.040%0.046%(-0.006)#690.26%(-0.220)#3,129
44.Valparaiso0.038%0.046%(-0.008)#700.26%(-0.222)#3,130
45.Brownsburg0.034%0.046%(-0.012)#710.26%(-0.226)#3,131
46.Merrillville0.033%0.046%(-0.013)#720.26%(-0.227)#3,132
47.Plainfield0.031%0.046%(-0.015)#730.26%(-0.229)#3,133
48.Fishers0.029%0.046%(-0.017)#740.26%(-0.231)#3,134
49.Mishawaka0.026%0.046%(-0.020)#750.26%(-0.234)#3,135
50.Granger0.023%0.046%(-0.023)#760.26%(-0.237)#3,136
51.Crown Point0.021%0.046%(-0.025)#770.26%(-0.239)#3,137
52.Noblesville0.020%0.046%(-0.026)#780.26%(-0.240)#3,138
53.Evansville0.014%0.046%(-0.032)#790.26%(-0.246)#3,139
54.Bluffton0.0096%0.046%(-0.036)#800.26%(-0.250)#3,140

Common Questions

What are the Top 10 Cities with the Highest Percentage of Immigrants from Colombia in Indiana?
Top 10 Cities with the Highest Percentage of Immigrants from Colombia in Indiana are:
#1
16.54%
#2
1.72%
#3
1.48%
#4
0.93%
#5
0.92%
#6
0.92%
#7
0.58%
#8
0.55%
#9
0.50%
#10
0.49%
What city has the Highest Percentage of Immigrants from Colombia in Indiana?
Indian Village has the Highest Percentage of Immigrants from Colombia in Indiana with 16.54%.
What is the Percentage of Immigrants from Colombia in the State of Indiana?
Percentage of Immigrants from Colombia in Indiana is 0.046%.
What is the Percentage of Immigrants from Colombia in the United States?
Percentage of Immigrants from Colombia in the United States is 0.26%.