Cities with the Highest Percentage of Immigrants from Bangladesh in New York
RELATED REPORTS & OPTIONS
Bangladesh
New York
Compare Cities
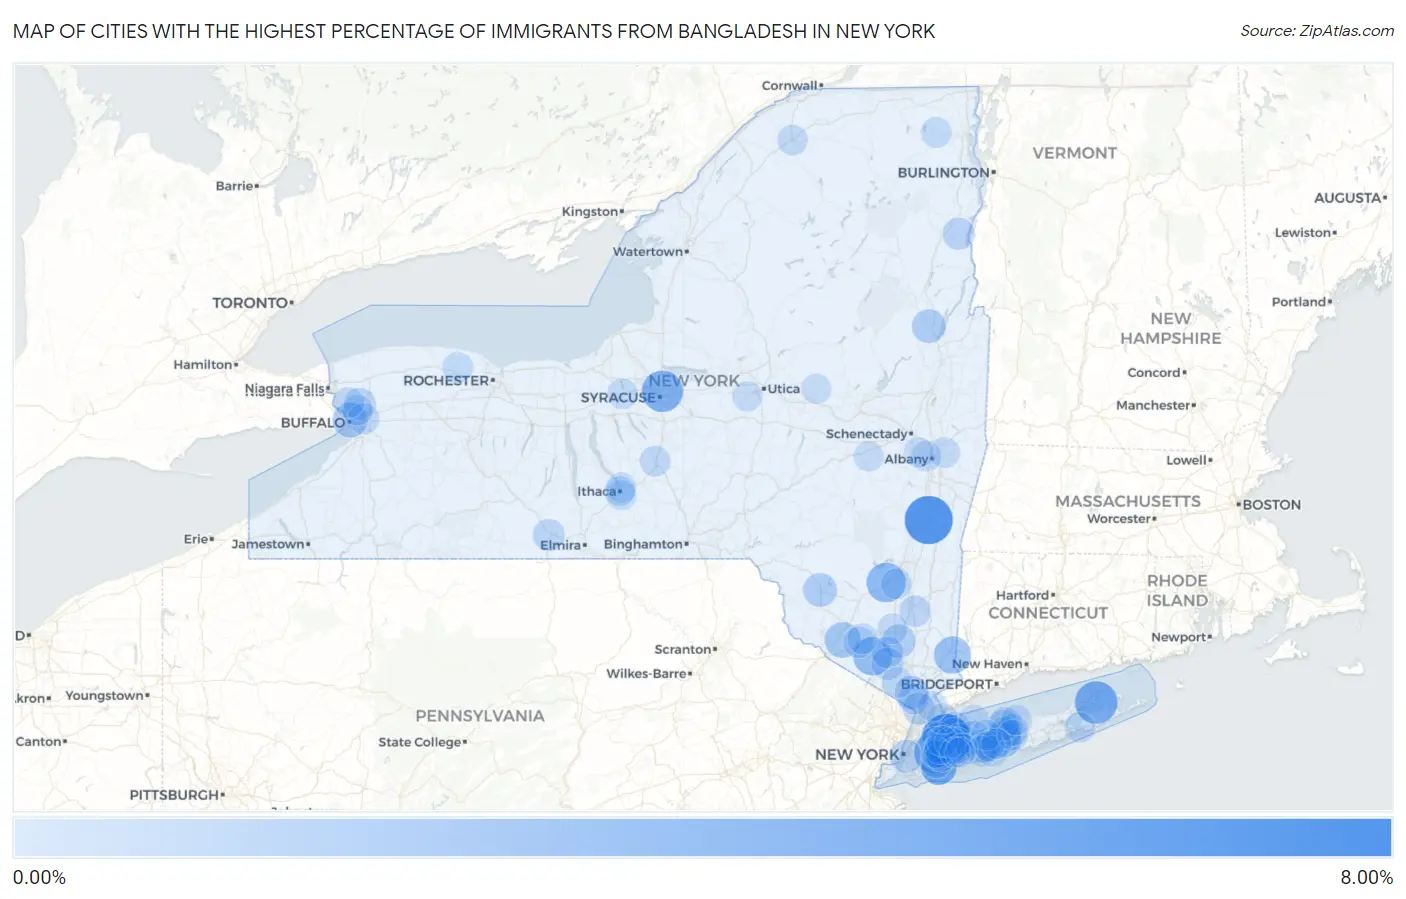
Map of Cities with the Highest Percentage of Immigrants from Bangladesh in New York
0.00%
8.00%
Cities with the Highest Percentage of Immigrants from Bangladesh in New York
| City | Bangladesh | vs State | vs National | |
| 1. | Greenvale | 6.70% | 0.59%(+6.11)#1 | 0.082%(+6.62)#7 |
| 2. | Hudson | 6.21% | 0.59%(+5.63)#2 | 0.082%(+6.13)#9 |
| 3. | Shelter Island | 4.33% | 0.59%(+3.74)#3 | 0.082%(+4.25)#16 |
| 4. | Lyncourt | 3.96% | 0.59%(+3.37)#4 | 0.082%(+3.88)#17 |
| 5. | Bellerose Terrace | 3.93% | 0.59%(+3.35)#5 | 0.082%(+3.85)#18 |
| 6. | Stone Ridge | 3.26% | 0.59%(+2.68)#6 | 0.082%(+3.18)#20 |
| 7. | Chester | 2.98% | 0.59%(+2.39)#7 | 0.082%(+2.90)#26 |
| 8. | Manhasset Hills | 2.77% | 0.59%(+2.18)#8 | 0.082%(+2.68)#31 |
| 9. | Searingtown | 2.62% | 0.59%(+2.03)#9 | 0.082%(+2.54)#34 |
| 10. | Peach Lake | 2.52% | 0.59%(+1.93)#10 | 0.082%(+2.44)#38 |
| 11. | Garden City Park | 2.39% | 0.59%(+1.81)#11 | 0.082%(+2.31)#41 |
| 12. | Herricks | 2.37% | 0.59%(+1.78)#12 | 0.082%(+2.28)#42 |
| 13. | Hewlett Bay Park | 2.27% | 0.59%(+1.68)#13 | 0.082%(+2.18)#44 |
| 14. | Otisville | 2.03% | 0.59%(+1.44)#14 | 0.082%(+1.94)#47 |
| 15. | Latham | 1.98% | 0.59%(+1.39)#15 | 0.082%(+1.89)#48 |
| 16. | Hewlett Neck | 1.87% | 0.59%(+1.29)#16 | 0.082%(+1.79)#51 |
| 17. | Buffalo | 1.77% | 0.59%(+1.19)#17 | 0.082%(+1.69)#57 |
| 18. | Ronkonkoma | 1.65% | 0.59%(+1.06)#18 | 0.082%(+1.57)#62 |
| 19. | Albertson | 1.57% | 0.59%(+0.984)#19 | 0.082%(+1.49)#67 |
| 20. | Roessleville | 1.50% | 0.59%(+0.916)#20 | 0.082%(+1.42)#70 |
| 21. | Liberty | 1.43% | 0.59%(+0.845)#21 | 0.082%(+1.35)#75 |
| 22. | Warrensburg | 1.42% | 0.59%(+0.835)#22 | 0.082%(+1.34)#76 |
| 23. | Vails Gate | 1.35% | 0.59%(+0.767)#23 | 0.082%(+1.27)#80 |
| 24. | Valley Cottage | 1.35% | 0.59%(+0.759)#24 | 0.082%(+1.26)#83 |
| 25. | Lake Ronkonkoma | 1.29% | 0.59%(+0.700)#25 | 0.082%(+1.20)#85 |
| 26. | Stony Brook University | 1.27% | 0.59%(+0.681)#26 | 0.082%(+1.19)#87 |
| 27. | South Huntington | 1.23% | 0.59%(+0.646)#27 | 0.082%(+1.15)#90 |
| 28. | Deer Park | 1.17% | 0.59%(+0.585)#28 | 0.082%(+1.09)#95 |
| 29. | New York | 1.15% | 0.59%(+0.567)#29 | 0.082%(+1.07)#97 |
| 30. | Hicksville | 1.10% | 0.59%(+0.518)#30 | 0.082%(+1.02)#101 |
| 31. | New Hyde Park | 1.07% | 0.59%(+0.488)#31 | 0.082%(+0.993)#107 |
| 32. | Williston Park | 1.02% | 0.59%(+0.434)#32 | 0.082%(+0.939)#114 |
| 33. | Dobbs Ferry | 0.91% | 0.59%(+0.323)#33 | 0.082%(+0.828)#133 |
| 34. | Plandome Manor | 0.90% | 0.59%(+0.316)#34 | 0.082%(+0.820)#134 |
| 35. | Mineville | 0.88% | 0.59%(+0.296)#35 | 0.082%(+0.801)#142 |
| 36. | Harriman | 0.88% | 0.59%(+0.293)#36 | 0.082%(+0.798)#144 |
| 37. | Lake Grove | 0.83% | 0.59%(+0.245)#37 | 0.082%(+0.749)#155 |
| 38. | East Hills | 0.81% | 0.59%(+0.228)#38 | 0.082%(+0.733)#156 |
| 39. | Gang Mills | 0.81% | 0.59%(+0.224)#39 | 0.082%(+0.729)#157 |
| 40. | University At Buffalo | 0.81% | 0.59%(+0.221)#40 | 0.082%(+0.726)#158 |
| 41. | Mountain Lodge Park | 0.77% | 0.59%(+0.182)#41 | 0.082%(+0.686)#168 |
| 42. | Selden | 0.75% | 0.59%(+0.167)#42 | 0.082%(+0.672)#173 |
| 43. | Upper Brookville | 0.74% | 0.59%(+0.158)#43 | 0.082%(+0.663)#177 |
| 44. | Great Neck Plaza | 0.67% | 0.59%(+0.085)#44 | 0.082%(+0.590)#194 |
| 45. | Spackenkill | 0.65% | 0.59%(+0.059)#45 | 0.082%(+0.564)#199 |
| 46. | Mill Neck | 0.63% | 0.59%(+0.045)#46 | 0.082%(+0.550)#203 |
| 47. | South Valley Stream | 0.63% | 0.59%(+0.041)#47 | 0.082%(+0.546)#204 |
| 48. | South Nyack | 0.62% | 0.59%(+0.033)#48 | 0.082%(+0.537)#208 |
| 49. | Brentwood | 0.62% | 0.59%(+0.031)#49 | 0.082%(+0.536)#209 |
| 50. | Salisbury | 0.61% | 0.59%(+0.020)#50 | 0.082%(+0.524)#211 |
| 51. | Cheektowaga | 0.59% | 0.59%(+0.002)#51 | 0.082%(+0.506)#225 |
| 52. | Mechanicstown | 0.57% | 0.59%(-0.018)#52 | 0.082%(+0.486)#228 |
| 53. | Elmont | 0.57% | 0.59%(-0.019)#53 | 0.082%(+0.486)#229 |
| 54. | Homer | 0.50% | 0.59%(-0.082)#54 | 0.082%(+0.423)#248 |
| 55. | Pomona | 0.50% | 0.59%(-0.091)#55 | 0.082%(+0.413)#252 |
| 56. | Syosset | 0.49% | 0.59%(-0.097)#56 | 0.082%(+0.407)#255 |
| 57. | Eggertsville | 0.48% | 0.59%(-0.109)#57 | 0.082%(+0.396)#259 |
| 58. | Islip | 0.47% | 0.59%(-0.112)#58 | 0.082%(+0.392)#262 |
| 59. | Dannemora | 0.47% | 0.59%(-0.112)#59 | 0.082%(+0.392)#263 |
| 60. | Stony Brook | 0.47% | 0.59%(-0.115)#60 | 0.082%(+0.390)#265 |
| 61. | North Babylon | 0.46% | 0.59%(-0.124)#61 | 0.082%(+0.380)#269 |
| 62. | Tonawanda | 0.46% | 0.59%(-0.125)#62 | 0.082%(+0.379)#270 |
| 63. | Asharoken | 0.46% | 0.59%(-0.126)#63 | 0.082%(+0.378)#272 |
| 64. | Baywood | 0.46% | 0.59%(-0.127)#64 | 0.082%(+0.377)#273 |
| 65. | Clarkson | 0.46% | 0.59%(-0.129)#65 | 0.082%(+0.376)#275 |
| 66. | Tillson | 0.45% | 0.59%(-0.138)#66 | 0.082%(+0.367)#281 |
| 67. | Commack | 0.43% | 0.59%(-0.156)#67 | 0.082%(+0.349)#287 |
| 68. | Scotchtown | 0.42% | 0.59%(-0.162)#68 | 0.082%(+0.343)#289 |
| 69. | Potsdam | 0.42% | 0.59%(-0.167)#69 | 0.082%(+0.338)#294 |
| 70. | South Floral Park | 0.41% | 0.59%(-0.172)#70 | 0.082%(+0.333)#298 |
| 71. | Jericho | 0.41% | 0.59%(-0.173)#71 | 0.082%(+0.331)#300 |
| 72. | Franklin Square | 0.41% | 0.59%(-0.174)#72 | 0.082%(+0.331)#301 |
| 73. | Jordan | 0.41% | 0.59%(-0.181)#73 | 0.082%(+0.323)#309 |
| 74. | Bellerose | 0.40% | 0.59%(-0.186)#74 | 0.082%(+0.318)#314 |
| 75. | North Bay Shore | 0.39% | 0.59%(-0.195)#75 | 0.082%(+0.309)#320 |
| 76. | North New Hyde Park | 0.39% | 0.59%(-0.198)#76 | 0.082%(+0.307)#321 |
| 77. | Orange Lake | 0.39% | 0.59%(-0.199)#77 | 0.082%(+0.306)#322 |
| 78. | Old Westbury | 0.39% | 0.59%(-0.201)#78 | 0.082%(+0.303)#324 |
| 79. | East Setauket | 0.38% | 0.59%(-0.206)#79 | 0.082%(+0.299)#330 |
| 80. | Wynantskill | 0.38% | 0.59%(-0.206)#80 | 0.082%(+0.298)#331 |
| 81. | Farmingville | 0.38% | 0.59%(-0.208)#81 | 0.082%(+0.297)#334 |
| 82. | Rye | 0.38% | 0.59%(-0.210)#82 | 0.082%(+0.295)#335 |
| 83. | Roslyn Estates | 0.37% | 0.59%(-0.216)#83 | 0.082%(+0.288)#343 |
| 84. | Mount Sinai | 0.37% | 0.59%(-0.217)#84 | 0.082%(+0.287)#344 |
| 85. | Hamilton College | 0.37% | 0.59%(-0.219)#85 | 0.082%(+0.285)#346 |
| 86. | Albany | 0.36% | 0.59%(-0.229)#86 | 0.082%(+0.276)#350 |
| 87. | Central Islip | 0.35% | 0.59%(-0.242)#87 | 0.082%(+0.263)#362 |
| 88. | Shinnecock Hills | 0.33% | 0.59%(-0.259)#88 | 0.082%(+0.246)#377 |
| 89. | Bethpage | 0.32% | 0.59%(-0.263)#89 | 0.082%(+0.242)#383 |
| 90. | Cayuga Heights | 0.32% | 0.59%(-0.265)#90 | 0.082%(+0.239)#388 |
| 91. | South Hill | 0.32% | 0.59%(-0.269)#91 | 0.082%(+0.236)#391 |
| 92. | Schoharie | 0.31% | 0.59%(-0.273)#92 | 0.082%(+0.232)#397 |
| 93. | White Plains | 0.31% | 0.59%(-0.275)#93 | 0.082%(+0.229)#399 |
| 94. | Clinton | 0.31% | 0.59%(-0.275)#94 | 0.082%(+0.229)#400 |
| 95. | Ithaca | 0.30% | 0.59%(-0.290)#95 | 0.082%(+0.215)#416 |
| 96. | Westmere | 0.29% | 0.59%(-0.292)#96 | 0.082%(+0.213)#417 |
| 97. | Akwesasne | 0.29% | 0.59%(-0.301)#97 | 0.082%(+0.204)#429 |
| 98. | Dolgeville | 0.28% | 0.59%(-0.311)#98 | 0.082%(+0.193)#444 |
| 99. | East Meadow | 0.27% | 0.59%(-0.313)#99 | 0.082%(+0.192)#449 |
| 100. | Levittown | 0.27% | 0.59%(-0.319)#100 | 0.082%(+0.186)#456 |
Common Questions
What are the Top 10 Cities with the Highest Percentage of Immigrants from Bangladesh in New York?
Top 10 Cities with the Highest Percentage of Immigrants from Bangladesh in New York are:
#1
6.70%
#2
6.21%
#3
4.33%
#4
3.96%
#5
3.93%
#6
3.26%
#7
2.98%
#8
2.77%
#9
2.62%
#10
2.52%
What city has the Highest Percentage of Immigrants from Bangladesh in New York?
Greenvale has the Highest Percentage of Immigrants from Bangladesh in New York with 6.70%.
What is the Percentage of Immigrants from Bangladesh in the State of New York?
Percentage of Immigrants from Bangladesh in New York is 0.59%.
What is the Percentage of Immigrants from Bangladesh in the United States?
Percentage of Immigrants from Bangladesh in the United States is 0.082%.