Cities with the Highest Costs of Housing as Percentage of Income in South Carolina
RELATED REPORTS & OPTIONS
Highest Housing Costs / Income
South Carolina
Compare Cities
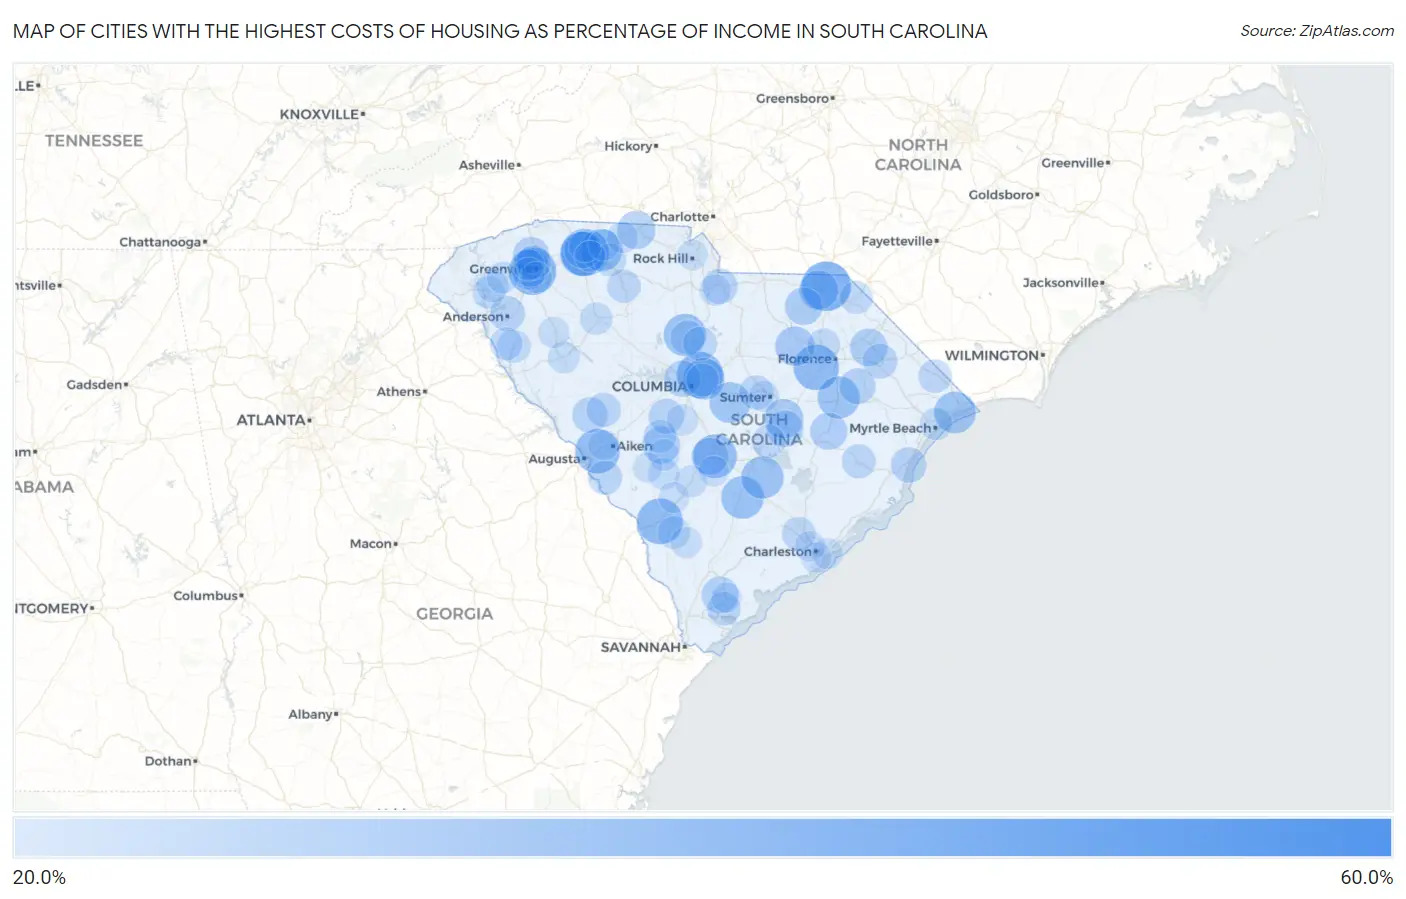
Map of Cities with the Highest Costs of Housing as Percentage of Income in South Carolina
0.0%
60.0%
Cities with the Highest Costs of Housing as Percentage of Income in South Carolina
| City | Housing Costs / Income | vs State | vs National | |
| 1. | Daviston | 50.9% | 18.8%(+32.1)#1 | 20.4%(+30.5)#77 |
| 2. | Arthurtown | 40.8% | 18.8%(+22.0)#2 | 20.4%(+20.5)#173 |
| 3. | Wallace | 38.5% | 18.8%(+19.7)#3 | 20.4%(+18.1)#231 |
| 4. | Judson | 36.8% | 18.8%(+18.0)#4 | 20.4%(+16.4)#305 |
| 5. | Saxon | 36.7% | 18.8%(+17.9)#5 | 20.4%(+16.3)#314 |
| 6. | Dentsville | 35.9% | 18.8%(+17.1)#6 | 20.4%(+15.5)#354 |
| 7. | Allendale | 35.4% | 18.8%(+16.6)#7 | 20.4%(+15.0)#374 |
| 8. | Timmonsville | 35.2% | 18.8%(+16.4)#8 | 20.4%(+14.8)#391 |
| 9. | Arcadia | 34.6% | 18.8%(+15.8)#9 | 20.4%(+14.2)#431 |
| 10. | Burnettown | 34.4% | 18.8%(+15.6)#10 | 20.4%(+14.0)#448 |
| 11. | Wilkinson Heights | 33.7% | 18.8%(+14.9)#11 | 20.4%(+13.4)#494 |
| 12. | Manville | 33.6% | 18.8%(+14.8)#12 | 20.4%(+13.3)#501 |
| 13. | St George | 32.8% | 18.8%(+14.0)#13 | 20.4%(+12.4)#585 |
| 14. | Winnsboro | 32.7% | 18.8%(+14.0)#14 | 20.4%(+12.4)#588 |
| 15. | Holly Hill | 32.6% | 18.8%(+13.8)#15 | 20.4%(+12.2)#601 |
| 16. | Clifton | 32.6% | 18.8%(+13.8)#16 | 20.4%(+12.2)#607 |
| 17. | Scranton | 32.4% | 18.8%(+13.6)#17 | 20.4%(+12.0)#621 |
| 18. | Atlantic Beach | 32.0% | 18.8%(+13.2)#18 | 20.4%(+11.6)#666 |
| 19. | Woodfield | 31.9% | 18.8%(+13.1)#19 | 20.4%(+11.5)#679 |
| 20. | Eastover | 31.4% | 18.8%(+12.6)#20 | 20.4%(+11.0)#743 |
| 21. | Lydia | 30.3% | 18.8%(+11.5)#21 | 20.4%(+9.92)#912 |
| 22. | Alcolu | 30.1% | 18.8%(+11.3)#22 | 20.4%(+9.71)#953 |
| 23. | Cheraw | 29.9% | 18.8%(+11.1)#23 | 20.4%(+9.53)#995 |
| 24. | Blacksburg | 29.3% | 18.8%(+10.5)#24 | 20.4%(+8.93)#1,113 |
| 25. | Parker | 29.3% | 18.8%(+10.5)#25 | 20.4%(+8.89)#1,123 |
| 26. | Sellers | 28.7% | 18.8%(+9.94)#26 | 20.4%(+8.35)#1,252 |
| 27. | Salley | 28.7% | 18.8%(+9.94)#27 | 20.4%(+8.35)#1,254 |
| 28. | Patrick | 28.7% | 18.8%(+9.92)#28 | 20.4%(+8.33)#1,259 |
| 29. | Kingstree | 28.3% | 18.8%(+9.54)#29 | 20.4%(+7.95)#1,382 |
| 30. | Orangeburg | 28.3% | 18.8%(+9.52)#30 | 20.4%(+7.93)#1,390 |
| 31. | Camp Croft | 28.2% | 18.8%(+9.41)#31 | 20.4%(+7.82)#1,419 |
| 32. | Laurel Bay | 28.0% | 18.8%(+9.22)#32 | 20.4%(+7.63)#1,489 |
| 33. | Hilltop | 28.0% | 18.8%(+9.19)#33 | 20.4%(+7.60)#1,504 |
| 34. | Manning | 27.9% | 18.8%(+9.07)#34 | 20.4%(+7.48)#1,556 |
| 35. | Southern Shops | 27.8% | 18.8%(+9.05)#35 | 20.4%(+7.46)#1,568 |
| 36. | St Andrews | 27.7% | 18.8%(+8.95)#36 | 20.4%(+7.36)#1,614 |
| 37. | Travelers Rest | 27.6% | 18.8%(+8.80)#37 | 20.4%(+7.21)#1,654 |
| 38. | Pamplico | 27.3% | 18.8%(+8.53)#38 | 20.4%(+6.94)#1,755 |
| 39. | Edgefield | 27.1% | 18.8%(+8.31)#39 | 20.4%(+6.72)#1,850 |
| 40. | Pawleys Island | 27.0% | 18.8%(+8.17)#40 | 20.4%(+6.58)#1,911 |
| 41. | Lancaster | 26.7% | 18.8%(+7.94)#41 | 20.4%(+6.35)#2,032 |
| 42. | Pelion | 26.7% | 18.8%(+7.94)#42 | 20.4%(+6.35)#2,034 |
| 43. | Anderson | 26.7% | 18.8%(+7.92)#43 | 20.4%(+6.33)#2,043 |
| 44. | Marion | 26.4% | 18.8%(+7.65)#44 | 20.4%(+6.06)#2,171 |
| 45. | Sans Souci | 26.1% | 18.8%(+7.35)#45 | 20.4%(+5.76)#2,314 |
| 46. | Johnston | 26.1% | 18.8%(+7.35)#46 | 20.4%(+5.76)#2,320 |
| 47. | Cherryvale | 26.1% | 18.8%(+7.28)#47 | 20.4%(+5.69)#2,351 |
| 48. | Winnsboro Mills | 26.0% | 18.8%(+7.18)#48 | 20.4%(+5.59)#2,423 |
| 49. | Jackson | 25.9% | 18.8%(+7.16)#49 | 20.4%(+5.57)#2,433 |
| 50. | Ridgeway | 25.8% | 18.8%(+7.05)#50 | 20.4%(+5.46)#2,506 |
| 51. | Drayton | 25.7% | 18.8%(+6.91)#51 | 20.4%(+5.32)#2,596 |
| 52. | Andrews | 25.7% | 18.8%(+6.87)#52 | 20.4%(+5.28)#2,623 |
| 53. | North Charleston | 25.6% | 18.8%(+6.78)#53 | 20.4%(+5.19)#2,680 |
| 54. | Port Royal | 25.4% | 18.8%(+6.64)#54 | 20.4%(+5.05)#2,760 |
| 55. | Union | 25.3% | 18.8%(+6.51)#55 | 20.4%(+4.92)#2,851 |
| 56. | Loris | 25.3% | 18.8%(+6.49)#56 | 20.4%(+4.90)#2,860 |
| 57. | Capitol View | 25.2% | 18.8%(+6.44)#57 | 20.4%(+4.86)#2,887 |
| 58. | Summerton | 25.2% | 18.8%(+6.37)#58 | 20.4%(+4.78)#2,945 |
| 59. | Tatum | 25.0% | 18.8%(+6.25)#59 | 20.4%(+4.66)#3,024 |
| 60. | Ben Avon | 25.0% | 18.8%(+6.19)#60 | 20.4%(+4.60)#3,071 |
| 61. | Lake Secession | 25.0% | 18.8%(+6.18)#61 | 20.4%(+4.59)#3,081 |
| 62. | Columbia | 25.0% | 18.8%(+6.17)#62 | 20.4%(+4.58)#3,089 |
| 63. | Darlington | 24.9% | 18.8%(+6.14)#63 | 20.4%(+4.55)#3,116 |
| 64. | Perry | 24.9% | 18.8%(+6.11)#64 | 20.4%(+4.52)#3,148 |
| 65. | Iva | 24.8% | 18.8%(+5.99)#65 | 20.4%(+4.40)#3,225 |
| 66. | Clinton | 24.8% | 18.8%(+5.97)#66 | 20.4%(+4.38)#3,245 |
| 67. | Central Pacolet | 24.7% | 18.8%(+5.94)#67 | 20.4%(+4.35)#3,269 |
| 68. | Clemson | 24.6% | 18.8%(+5.80)#68 | 20.4%(+4.22)#3,375 |
| 69. | Brunson | 24.5% | 18.8%(+5.73)#69 | 20.4%(+4.14)#3,430 |
| 70. | Myrtle Beach | 24.5% | 18.8%(+5.69)#70 | 20.4%(+4.10)#3,465 |
| 71. | Welcome | 24.3% | 18.8%(+5.55)#71 | 20.4%(+3.96)#3,592 |
| 72. | Bamberg | 24.2% | 18.8%(+5.42)#72 | 20.4%(+3.83)#3,697 |
| 73. | Central | 24.2% | 18.8%(+5.39)#73 | 20.4%(+3.80)#3,725 |
| 74. | Beech Island | 24.1% | 18.8%(+5.30)#74 | 20.4%(+3.71)#3,804 |
| 75. | Blackville | 24.0% | 18.8%(+5.24)#75 | 20.4%(+3.65)#3,849 |
| 76. | Greenwood | 23.9% | 18.8%(+5.16)#76 | 20.4%(+3.57)#3,906 |
| 77. | Liberty | 23.9% | 18.8%(+5.16)#77 | 20.4%(+3.57)#3,911 |
| 78. | Valley Falls | 23.9% | 18.8%(+5.09)#78 | 20.4%(+3.50)#3,980 |
| 79. | Carolina Forest | 23.8% | 18.8%(+5.05)#79 | 20.4%(+3.46)#4,028 |
| 80. | Springfield | 23.8% | 18.8%(+5.02)#80 | 20.4%(+3.43)#4,051 |
| 81. | Irwin | 23.8% | 18.8%(+5.01)#81 | 20.4%(+3.42)#4,057 |
| 82. | Swansea | 23.7% | 18.8%(+4.89)#82 | 20.4%(+3.30)#4,190 |
| 83. | Gantt | 23.6% | 18.8%(+4.86)#83 | 20.4%(+3.27)#4,218 |
| 84. | Ware Shoals | 23.6% | 18.8%(+4.85)#84 | 20.4%(+3.26)#4,234 |
| 85. | Gaffney | 23.6% | 18.8%(+4.80)#85 | 20.4%(+3.21)#4,278 |
| 86. | Varnville | 23.5% | 18.8%(+4.72)#86 | 20.4%(+3.13)#4,370 |
| 87. | Berea | 23.5% | 18.8%(+4.70)#87 | 20.4%(+3.11)#4,385 |
| 88. | Sumter | 23.4% | 18.8%(+4.65)#88 | 20.4%(+3.06)#4,438 |
| 89. | Cowpens | 23.4% | 18.8%(+4.60)#89 | 20.4%(+3.01)#4,477 |
| 90. | Olar | 23.3% | 18.8%(+4.56)#90 | 20.4%(+2.97)#4,520 |
| 91. | Spartanburg | 23.3% | 18.8%(+4.51)#91 | 20.4%(+2.92)#4,573 |
| 92. | Sullivan S Island | 23.2% | 18.8%(+4.38)#92 | 20.4%(+2.79)#4,703 |
| 93. | Graniteville | 23.2% | 18.8%(+4.37)#93 | 20.4%(+2.78)#4,713 |
| 94. | Rock Hill | 23.1% | 18.8%(+4.34)#94 | 20.4%(+2.75)#4,742 |
| 95. | James Island | 23.0% | 18.8%(+4.23)#95 | 20.4%(+2.64)#4,883 |
| 96. | Rowesville | 23.0% | 18.8%(+4.18)#96 | 20.4%(+2.59)#4,942 |
| 97. | Charleston | 22.9% | 18.8%(+4.12)#97 | 20.4%(+2.53)#5,024 |
| 98. | Beaufort | 22.9% | 18.8%(+4.11)#98 | 20.4%(+2.52)#5,026 |
| 99. | White Knoll | 22.8% | 18.8%(+4.05)#99 | 20.4%(+2.46)#5,099 |
| 100. | Williston | 22.7% | 18.8%(+3.87)#100 | 20.4%(+2.28)#5,345 |
Common Questions
What are the Top 10 Cities with the Highest Costs of Housing as Percentage of Income in South Carolina?
Top 10 Cities with the Highest Costs of Housing as Percentage of Income in South Carolina are:
#1
38.5%
#2
36.8%
#3
36.7%
#4
35.9%
#5
35.4%
#6
35.2%
#7
34.6%
#8
34.4%
#9
33.7%
#10
32.8%
What city has the Highest Costs of Housing as Percentage of Income in South Carolina?
Wallace has the Highest Costs of Housing as Percentage of Income in South Carolina with 38.5%.
What is the Average Housing Costs as Percentage of Income in the State of South Carolina?
Average Housing Costs as Percentage of Income in South Carolina is 18.8%.
What is the Average Housing Costs as Percentage of Income in the United States?
Average Housing Costs as Percentage of Income in the United States is 20.4%.