Cities with the Highest Costs of Housing as Percentage of Income in North Dakota
RELATED REPORTS & OPTIONS
Highest Housing Costs / Income
North Dakota
Compare Cities
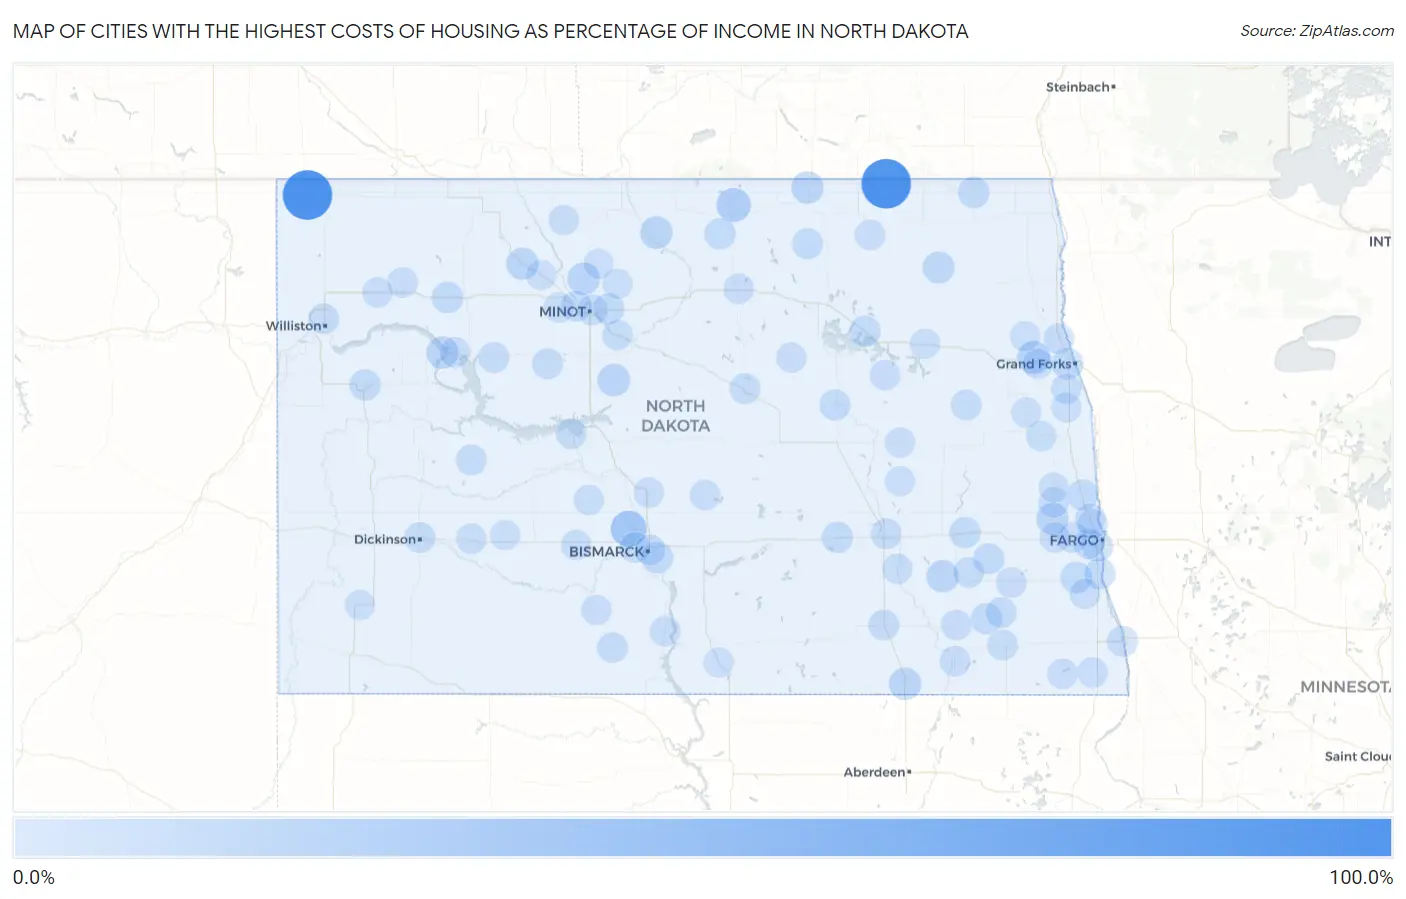
Map of Cities with the Highest Costs of Housing as Percentage of Income in North Dakota
0.0%
100.0%
Cities with the Highest Costs of Housing as Percentage of Income in North Dakota
| City | Housing Costs / Income | vs State | vs National | |
| 1. | Hannah | 100.0% | 15.2%(+84.8)#1 | 20.4%(+79.6)#2 |
| 2. | Fortuna | 100.0% | 15.2%(+84.8)#2 | 20.4%(+79.6)#8 |
| 3. | Harmon | 39.2% | 15.2%(+24.0)#3 | 20.4%(+18.9)#211 |
| 4. | East Dunseith | 30.7% | 15.2%(+15.5)#4 | 20.4%(+10.3)#840 |
| 5. | Grand Forks Afb | 26.4% | 15.2%(+11.1)#5 | 20.4%(+5.99)#2,208 |
| 6. | Benedict | 24.5% | 15.2%(+9.31)#6 | 20.4%(+4.17)#3,407 |
| 7. | Kramer | 24.5% | 15.2%(+9.24)#7 | 20.4%(+4.10)#3,459 |
| 8. | Minot Afb | 24.2% | 15.2%(+8.97)#8 | 20.4%(+3.83)#3,696 |
| 9. | Ellendale | 23.2% | 15.2%(+7.94)#9 | 20.4%(+2.80)#4,687 |
| 10. | Hansboro | 23.1% | 15.2%(+7.88)#10 | 20.4%(+2.74)#4,766 |
| 11. | Four Bears Village | 22.6% | 15.2%(+7.36)#11 | 20.4%(+2.22)#5,410 |
| 12. | Amenia | 22.4% | 15.2%(+7.21)#12 | 20.4%(+2.07)#5,576 |
| 13. | Donnybrook | 22.4% | 15.2%(+7.18)#13 | 20.4%(+2.04)#5,631 |
| 14. | Litchville | 22.4% | 15.2%(+7.15)#14 | 20.4%(+2.01)#5,666 |
| 15. | Fairdale | 21.7% | 15.2%(+6.48)#15 | 20.4%(+1.34)#6,599 |
| 16. | Grand Forks | 20.5% | 15.2%(+5.22)#16 | 20.4%(+0.078)#8,676 |
| 17. | Ross | 20.2% | 15.2%(+4.95)#17 | 20.4%(-0.191)#9,184 |
| 18. | Kindred | 20.1% | 15.2%(+4.88)#18 | 20.4%(-0.260)#9,306 |
| 19. | Walhalla | 19.9% | 15.2%(+4.65)#19 | 20.4%(-0.489)#9,716 |
| 20. | Lincoln | 19.5% | 15.2%(+4.22)#20 | 20.4%(-0.920)#10,611 |
| 21. | Overly | 19.2% | 15.2%(+3.93)#21 | 20.4%(-1.21)#11,275 |
| 22. | Watford City | 19.1% | 15.2%(+3.90)#22 | 20.4%(-1.24)#11,322 |
| 23. | Oxbow | 18.8% | 15.2%(+3.58)#23 | 20.4%(-1.56)#11,966 |
| 24. | Devils Lake | 18.7% | 15.2%(+3.46)#24 | 20.4%(-1.68)#12,221 |
| 25. | Cleveland | 18.6% | 15.2%(+3.39)#25 | 20.4%(-1.75)#12,375 |
| 26. | Elliott | 18.6% | 15.2%(+3.36)#26 | 20.4%(-1.78)#12,432 |
| 27. | Surrey | 18.4% | 15.2%(+3.18)#27 | 20.4%(-1.96)#12,883 |
| 28. | Valley City | 18.2% | 15.2%(+2.94)#28 | 20.4%(-2.20)#13,423 |
| 29. | Fargo | 18.1% | 15.2%(+2.90)#29 | 20.4%(-2.24)#13,507 |
| 30. | Gardner | 18.1% | 15.2%(+2.83)#30 | 20.4%(-2.31)#13,657 |
| 31. | Bisbee | 17.9% | 15.2%(+2.65)#31 | 20.4%(-2.49)#14,082 |
| 32. | New Rockford | 17.9% | 15.2%(+2.64)#32 | 20.4%(-2.50)#14,092 |
| 33. | Fingal | 17.8% | 15.2%(+2.58)#33 | 20.4%(-2.56)#14,226 |
| 34. | Parshall | 17.6% | 15.2%(+2.32)#34 | 20.4%(-2.82)#14,801 |
| 35. | Harvey | 17.5% | 15.2%(+2.27)#35 | 20.4%(-2.87)#14,898 |
| 36. | Burlington | 17.4% | 15.2%(+2.16)#36 | 20.4%(-2.98)#15,165 |
| 37. | Ryder | 17.3% | 15.2%(+2.09)#37 | 20.4%(-3.05)#15,299 |
| 38. | Lisbon | 17.2% | 15.2%(+1.99)#38 | 20.4%(-3.15)#15,541 |
| 39. | Wahpeton | 17.2% | 15.2%(+1.92)#39 | 20.4%(-3.22)#15,683 |
| 40. | Kathryn | 16.9% | 15.2%(+1.71)#40 | 20.4%(-3.43)#16,142 |
| 41. | Porcupine | 16.8% | 15.2%(+1.54)#41 | 20.4%(-3.60)#16,520 |
| 42. | Halliday | 16.8% | 15.2%(+1.53)#42 | 20.4%(-3.61)#16,531 |
| 43. | West Fargo | 16.7% | 15.2%(+1.50)#43 | 20.4%(-3.64)#16,593 |
| 44. | Aneta | 16.7% | 15.2%(+1.49)#44 | 20.4%(-3.65)#16,612 |
| 45. | Jamestown | 16.7% | 15.2%(+1.49)#45 | 20.4%(-3.65)#16,630 |
| 46. | Dickinson | 16.6% | 15.2%(+1.36)#46 | 20.4%(-3.78)#16,923 |
| 47. | Edgeley | 16.5% | 15.2%(+1.31)#47 | 20.4%(-3.83)#17,050 |
| 48. | Mandan | 16.5% | 15.2%(+1.30)#48 | 20.4%(-3.84)#17,073 |
| 49. | Williston | 16.4% | 15.2%(+1.16)#49 | 20.4%(-3.98)#17,363 |
| 50. | Pick City | 16.3% | 15.2%(+1.11)#50 | 20.4%(-4.03)#17,484 |
| 51. | Arthur | 16.3% | 15.2%(+1.04)#51 | 20.4%(-4.10)#17,646 |
| 52. | Warwick | 16.3% | 15.2%(+1.04)#52 | 20.4%(-4.10)#17,649 |
| 53. | Gwinner | 16.2% | 15.2%(+0.987)#53 | 20.4%(-4.15)#17,758 |
| 54. | Bismarck | 16.2% | 15.2%(+0.962)#54 | 20.4%(-4.18)#17,809 |
| 55. | Minot | 16.2% | 15.2%(+0.951)#55 | 20.4%(-4.19)#17,839 |
| 56. | Flasher | 16.2% | 15.2%(+0.949)#56 | 20.4%(-4.19)#17,844 |
| 57. | Mapleton | 16.2% | 15.2%(+0.920)#57 | 20.4%(-4.22)#17,911 |
| 58. | Cannon Ball | 16.1% | 15.2%(+0.879)#58 | 20.4%(-4.26)#18,001 |
| 59. | Walcott | 16.1% | 15.2%(+0.863)#59 | 20.4%(-4.28)#18,041 |
| 60. | Enderlin | 16.0% | 15.2%(+0.812)#60 | 20.4%(-4.33)#18,159 |
| 61. | Hankinson | 16.0% | 15.2%(+0.777)#61 | 20.4%(-4.36)#18,225 |
| 62. | Wing | 15.9% | 15.2%(+0.664)#62 | 20.4%(-4.48)#18,452 |
| 63. | Oakes | 15.9% | 15.2%(+0.658)#63 | 20.4%(-4.48)#18,468 |
| 64. | Casselton | 15.9% | 15.2%(+0.652)#64 | 20.4%(-4.49)#18,483 |
| 65. | Munich | 15.9% | 15.2%(+0.644)#65 | 20.4%(-4.50)#18,498 |
| 66. | Sawyer | 15.8% | 15.2%(+0.609)#66 | 20.4%(-4.53)#18,588 |
| 67. | Brooktree Park | 15.8% | 15.2%(+0.543)#67 | 20.4%(-4.60)#18,716 |
| 68. | Tioga | 15.7% | 15.2%(+0.440)#68 | 20.4%(-4.70)#18,924 |
| 69. | Manvel | 15.7% | 15.2%(+0.438)#69 | 20.4%(-4.70)#18,931 |
| 70. | Verona | 15.5% | 15.2%(+0.278)#70 | 20.4%(-4.86)#19,247 |
| 71. | Ray | 15.5% | 15.2%(+0.278)#71 | 20.4%(-4.86)#19,248 |
| 72. | Rugby | 15.5% | 15.2%(+0.253)#72 | 20.4%(-4.89)#19,298 |
| 73. | New Town | 15.4% | 15.2%(+0.209)#73 | 20.4%(-4.93)#19,412 |
| 74. | Lidgerwood | 15.4% | 15.2%(+0.177)#74 | 20.4%(-4.96)#19,478 |
| 75. | Wilton | 15.3% | 15.2%(+0.074)#75 | 20.4%(-5.07)#19,662 |
| 76. | Richardton | 15.3% | 15.2%(+0.067)#76 | 20.4%(-5.07)#19,679 |
| 77. | Thompson | 15.2% | 15.2%(-0.082)#77 | 20.4%(-5.22)#19,963 |
| 78. | Apple Valley | 15.1% | 15.2%(-0.093)#78 | 20.4%(-5.23)#19,989 |
| 79. | Mayville | 15.1% | 15.2%(-0.141)#79 | 20.4%(-5.28)#20,065 |
| 80. | Emerado | 15.0% | 15.2%(-0.187)#80 | 20.4%(-5.33)#20,146 |
| 81. | Mohall | 15.0% | 15.2%(-0.209)#81 | 20.4%(-5.35)#20,176 |
| 82. | Center | 15.0% | 15.2%(-0.238)#82 | 20.4%(-5.38)#20,256 |
| 83. | Maddock | 15.0% | 15.2%(-0.265)#83 | 20.4%(-5.41)#20,304 |
| 84. | New Salem | 15.0% | 15.2%(-0.267)#84 | 20.4%(-5.41)#20,313 |
| 85. | Montpelier | 14.9% | 15.2%(-0.302)#85 | 20.4%(-5.44)#20,360 |
| 86. | Hatton | 14.8% | 15.2%(-0.391)#86 | 20.4%(-5.53)#20,519 |
| 87. | Lakota | 14.8% | 15.2%(-0.448)#87 | 20.4%(-5.59)#20,617 |
| 88. | Hebron | 14.8% | 15.2%(-0.478)#88 | 20.4%(-5.62)#20,681 |
| 89. | Glenfield | 14.7% | 15.2%(-0.495)#89 | 20.4%(-5.63)#20,708 |
| 90. | Carpio | 14.6% | 15.2%(-0.601)#90 | 20.4%(-5.74)#20,892 |
| 91. | Gilby | 14.5% | 15.2%(-0.692)#91 | 20.4%(-5.83)#21,034 |
| 92. | Strasburg | 14.5% | 15.2%(-0.732)#92 | 20.4%(-5.87)#21,103 |
| 93. | Harwood | 14.5% | 15.2%(-0.732)#93 | 20.4%(-5.87)#21,104 |
| 94. | Deering | 14.5% | 15.2%(-0.756)#94 | 20.4%(-5.90)#21,131 |
| 95. | Des Lacs | 14.5% | 15.2%(-0.759)#95 | 20.4%(-5.90)#21,135 |
| 96. | Reynolds | 14.5% | 15.2%(-0.765)#96 | 20.4%(-5.91)#21,152 |
| 97. | Amidon | 14.5% | 15.2%(-0.778)#97 | 20.4%(-5.92)#21,176 |
| 98. | Glenburn | 14.4% | 15.2%(-0.806)#98 | 20.4%(-5.95)#21,219 |
| 99. | Courtenay | 14.3% | 15.2%(-0.983)#99 | 20.4%(-6.12)#21,518 |
| 100. | Hunter | 14.2% | 15.2%(-1.04)#100 | 20.4%(-6.18)#21,622 |
Common Questions
What are the Top 10 Cities with the Highest Costs of Housing as Percentage of Income in North Dakota?
Top 10 Cities with the Highest Costs of Housing as Percentage of Income in North Dakota are:
#1
100.0%
#2
100.0%
#3
39.2%
#4
30.7%
#5
26.4%
#6
24.5%
#7
24.5%
#8
24.2%
#9
23.2%
#10
23.1%
What city has the Highest Costs of Housing as Percentage of Income in North Dakota?
Hannah has the Highest Costs of Housing as Percentage of Income in North Dakota with 100.0%.
What is the Average Housing Costs as Percentage of Income in the State of North Dakota?
Average Housing Costs as Percentage of Income in North Dakota is 15.2%.
What is the Average Housing Costs as Percentage of Income in the United States?
Average Housing Costs as Percentage of Income in the United States is 20.4%.