Cities with the Most Immigrants from Asia in Indiana
RELATED REPORTS & OPTIONS
Asia
Indiana
Compare Cities
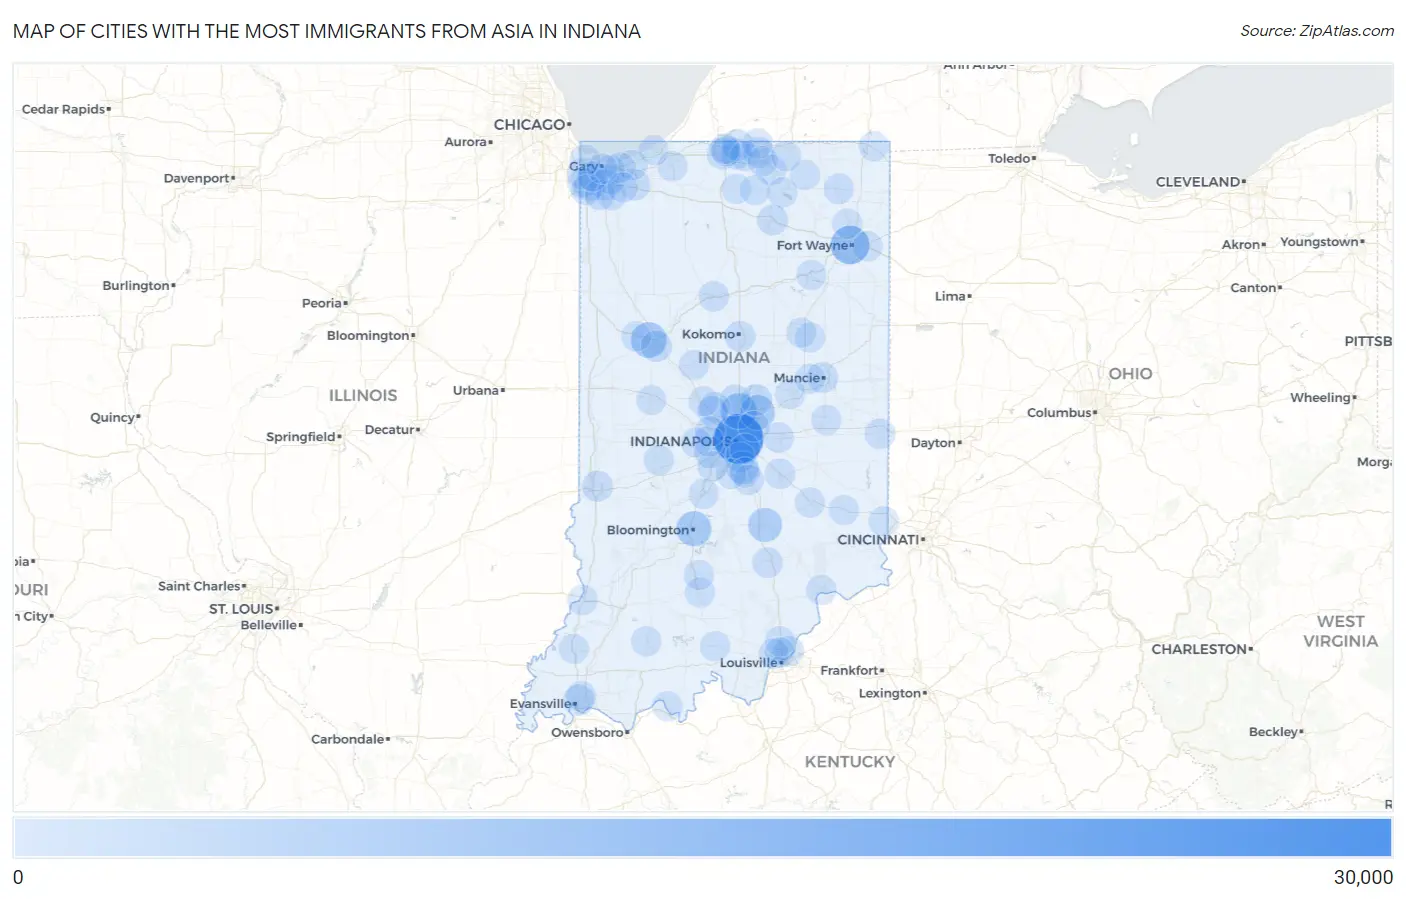
Map of Cities with the Most Immigrants from Asia in Indiana
0
30,000
Cities with the Most Immigrants from Asia in Indiana
| City | Asia | vs State | vs National | |
| 1. | Indianapolis | 27,048 | 131,472(20.57%)#1 | 14,105,933(0.19%)#54 |
| 2. | Fort Wayne | 11,411 | 131,472(8.68%)#2 | 14,105,933(0.08%)#181 |
| 3. | Carmel | 7,580 | 131,472(5.77%)#3 | 14,105,933(0.05%)#270 |
| 4. | West Lafayette | 7,399 | 131,472(5.63%)#4 | 14,105,933(0.05%)#278 |
| 5. | Bloomington | 6,612 | 131,472(5.03%)#5 | 14,105,933(0.05%)#318 |
| 6. | Fishers | 6,410 | 131,472(4.88%)#6 | 14,105,933(0.05%)#332 |
| 7. | Columbus | 5,200 | 131,472(3.96%)#7 | 14,105,933(0.04%)#405 |
| 8. | Greenwood | 2,959 | 131,472(2.25%)#8 | 14,105,933(0.02%)#692 |
| 9. | Noblesville | 1,963 | 131,472(1.49%)#9 | 14,105,933(0.01%)#993 |
| 10. | Lafayette | 1,720 | 131,472(1.31%)#10 | 14,105,933(0.01%)#1,093 |
| 11. | South Bend | 1,562 | 131,472(1.19%)#11 | 14,105,933(0.01%)#1,190 |
| 12. | Plainfield | 1,528 | 131,472(1.16%)#12 | 14,105,933(0.01%)#1,201 |
| 13. | Granger | 1,491 | 131,472(1.13%)#13 | 14,105,933(0.01%)#1,225 |
| 14. | Mishawaka | 1,241 | 131,472(0.94%)#14 | 14,105,933(0.01%)#1,380 |
| 15. | Evansville | 1,235 | 131,472(0.94%)#15 | 14,105,933(0.01%)#1,385 |
| 16. | Schererville | 1,227 | 131,472(0.93%)#16 | 14,105,933(0.01%)#1,395 |
| 17. | Terre Haute | 1,102 | 131,472(0.84%)#17 | 14,105,933(0.01%)#1,497 |
| 18. | Munster | 1,090 | 131,472(0.83%)#18 | 14,105,933(0.01%)#1,509 |
| 19. | Valparaiso | 1,008 | 131,472(0.77%)#19 | 14,105,933(0.01%)#1,582 |
| 20. | Westfield | 983 | 131,472(0.75%)#20 | 14,105,933(0.01%)#1,611 |
| 21. | Muncie | 978 | 131,472(0.74%)#21 | 14,105,933(0.01%)#1,618 |
| 22. | Zionsville | 978 | 131,472(0.74%)#22 | 14,105,933(0.01%)#1,619 |
| 23. | Kokomo | 897 | 131,472(0.68%)#23 | 14,105,933(0.01%)#1,730 |
| 24. | Warsaw | 816 | 131,472(0.62%)#24 | 14,105,933(0.01%)#1,838 |
| 25. | Hammond | 660 | 131,472(0.50%)#25 | 14,105,933(0.00%)#2,076 |
| 26. | Lawrence | 657 | 131,472(0.50%)#26 | 14,105,933(0.00%)#2,084 |
| 27. | Seymour | 639 | 131,472(0.49%)#27 | 14,105,933(0.00%)#2,119 |
| 28. | Merrillville | 625 | 131,472(0.48%)#28 | 14,105,933(0.00%)#2,152 |
| 29. | Avon | 567 | 131,472(0.43%)#29 | 14,105,933(0.00%)#2,288 |
| 30. | Jeffersonville | 505 | 131,472(0.38%)#30 | 14,105,933(0.00%)#2,421 |
| 31. | Logansport | 504 | 131,472(0.38%)#31 | 14,105,933(0.00%)#2,424 |
| 32. | Whitestown | 479 | 131,472(0.36%)#32 | 14,105,933(0.00%)#2,506 |
| 33. | Kendallville | 448 | 131,472(0.34%)#33 | 14,105,933(0.00%)#2,613 |
| 34. | Richmond | 443 | 131,472(0.34%)#34 | 14,105,933(0.00%)#2,633 |
| 35. | Southport | 411 | 131,472(0.31%)#35 | 14,105,933(0.00%)#2,738 |
| 36. | Greencastle | 399 | 131,472(0.30%)#36 | 14,105,933(0.00%)#2,778 |
| 37. | Hobart | 383 | 131,472(0.29%)#37 | 14,105,933(0.00%)#2,849 |
| 38. | Greenfield | 372 | 131,472(0.28%)#38 | 14,105,933(0.00%)#2,898 |
| 39. | Elkhart | 371 | 131,472(0.28%)#39 | 14,105,933(0.00%)#2,902 |
| 40. | Chesterton | 336 | 131,472(0.26%)#40 | 14,105,933(0.00%)#3,064 |
| 41. | Goshen | 333 | 131,472(0.25%)#41 | 14,105,933(0.00%)#3,081 |
| 42. | Shelbyville | 330 | 131,472(0.25%)#42 | 14,105,933(0.00%)#3,104 |
| 43. | Dyer | 321 | 131,472(0.24%)#43 | 14,105,933(0.00%)#3,142 |
| 44. | Brownsburg | 316 | 131,472(0.24%)#44 | 14,105,933(0.00%)#3,167 |
| 45. | St John | 316 | 131,472(0.24%)#45 | 14,105,933(0.00%)#3,168 |
| 46. | Crown Point | 304 | 131,472(0.23%)#46 | 14,105,933(0.00%)#3,236 |
| 47. | Franklin | 302 | 131,472(0.23%)#47 | 14,105,933(0.00%)#3,252 |
| 48. | Griffith | 291 | 131,472(0.22%)#48 | 14,105,933(0.00%)#3,320 |
| 49. | New Albany | 240 | 131,472(0.18%)#49 | 14,105,933(0.00%)#3,634 |
| 50. | Huntertown | 205 | 131,472(0.16%)#50 | 14,105,933(0.00%)#3,915 |
| 51. | Vincennes | 204 | 131,472(0.16%)#51 | 14,105,933(0.00%)#3,924 |
| 52. | Jasper | 204 | 131,472(0.16%)#52 | 14,105,933(0.00%)#3,925 |
| 53. | Notre Dame | 203 | 131,472(0.15%)#53 | 14,105,933(0.00%)#3,938 |
| 54. | Michigan City | 201 | 131,472(0.15%)#54 | 14,105,933(0.00%)#3,955 |
| 55. | Lake Station | 200 | 131,472(0.15%)#55 | 14,105,933(0.00%)#3,968 |
| 56. | Anderson | 198 | 131,472(0.15%)#56 | 14,105,933(0.00%)#3,983 |
| 57. | Huntington | 192 | 131,472(0.15%)#57 | 14,105,933(0.00%)#4,045 |
| 58. | Syracuse | 189 | 131,472(0.14%)#58 | 14,105,933(0.00%)#4,066 |
| 59. | Beech Grove | 186 | 131,472(0.14%)#59 | 14,105,933(0.00%)#4,097 |
| 60. | Sellersburg | 180 | 131,472(0.14%)#60 | 14,105,933(0.00%)#4,157 |
| 61. | Yorktown | 169 | 131,472(0.13%)#61 | 14,105,933(0.00%)#4,273 |
| 62. | Bremen | 167 | 131,472(0.13%)#62 | 14,105,933(0.00%)#4,303 |
| 63. | Simonton Lake | 166 | 131,472(0.13%)#63 | 14,105,933(0.00%)#4,316 |
| 64. | Winfield | 160 | 131,472(0.12%)#64 | 14,105,933(0.00%)#4,391 |
| 65. | Mitchell | 156 | 131,472(0.12%)#65 | 14,105,933(0.00%)#4,451 |
| 66. | Portage | 151 | 131,472(0.11%)#66 | 14,105,933(0.00%)#4,504 |
| 67. | Bargersville | 139 | 131,472(0.11%)#67 | 14,105,933(0.00%)#4,673 |
| 68. | Greensburg | 132 | 131,472(0.10%)#68 | 14,105,933(0.00%)#4,793 |
| 69. | Gary | 130 | 131,472(0.10%)#69 | 14,105,933(0.00%)#4,813 |
| 70. | New Haven | 125 | 131,472(0.10%)#70 | 14,105,933(0.00%)#4,902 |
| 71. | Osceola | 125 | 131,472(0.10%)#71 | 14,105,933(0.00%)#4,910 |
| 72. | Clarksville | 118 | 131,472(0.09%)#72 | 14,105,933(0.00%)#4,995 |
| 73. | Topeka | 115 | 131,472(0.09%)#73 | 14,105,933(0.00%)#5,067 |
| 74. | Madison | 111 | 131,472(0.08%)#74 | 14,105,933(0.00%)#5,122 |
| 75. | La Porte | 104 | 131,472(0.08%)#75 | 14,105,933(0.00%)#5,240 |
| 76. | New Castle | 104 | 131,472(0.08%)#76 | 14,105,933(0.00%)#5,241 |
| 77. | Melody Hill | 102 | 131,472(0.08%)#77 | 14,105,933(0.00%)#5,279 |
| 78. | Montmorenci | 101 | 131,472(0.08%)#78 | 14,105,933(0.00%)#5,311 |
| 79. | Martinsville | 93 | 131,472(0.07%)#79 | 14,105,933(0.00%)#5,459 |
| 80. | Crawfordsville | 92 | 131,472(0.07%)#80 | 14,105,933(0.00%)#5,485 |
| 81. | Fremont | 91 | 131,472(0.07%)#81 | 14,105,933(0.00%)#5,531 |
| 82. | Tell City | 88 | 131,472(0.07%)#82 | 14,105,933(0.00%)#5,579 |
| 83. | Bright | 86 | 131,472(0.07%)#83 | 14,105,933(0.00%)#5,621 |
| 84. | Bedford | 85 | 131,472(0.06%)#84 | 14,105,933(0.00%)#5,632 |
| 85. | Frankfort | 81 | 131,472(0.06%)#85 | 14,105,933(0.00%)#5,734 |
| 86. | Dunlap | 81 | 131,472(0.06%)#86 | 14,105,933(0.00%)#5,740 |
| 87. | Shorewood Forest | 81 | 131,472(0.06%)#87 | 14,105,933(0.00%)#5,746 |
| 88. | Whiteland | 76 | 131,472(0.06%)#88 | 14,105,933(0.00%)#5,888 |
| 89. | Batesville | 74 | 131,472(0.06%)#89 | 14,105,933(0.00%)#5,941 |
| 90. | Floyds Knobs | 73 | 131,472(0.06%)#90 | 14,105,933(0.00%)#5,976 |
| 91. | Upland | 69 | 131,472(0.05%)#91 | 14,105,933(0.00%)#6,092 |
| 92. | Danville | 68 | 131,472(0.05%)#92 | 14,105,933(0.00%)#6,115 |
| 93. | Gas City | 66 | 131,472(0.05%)#93 | 14,105,933(0.00%)#6,180 |
| 94. | Nappanee | 59 | 131,472(0.04%)#94 | 14,105,933(0.00%)#6,421 |
| 95. | Middlebury | 59 | 131,472(0.04%)#95 | 14,105,933(0.00%)#6,431 |
| 96. | Marengo | 59 | 131,472(0.04%)#96 | 14,105,933(0.00%)#6,445 |
| 97. | Roseland | 59 | 131,472(0.04%)#97 | 14,105,933(0.00%)#6,446 |
| 98. | Mooresville | 57 | 131,472(0.04%)#98 | 14,105,933(0.00%)#6,490 |
| 99. | Lebanon | 55 | 131,472(0.04%)#99 | 14,105,933(0.00%)#6,558 |
| 100. | Princeton | 55 | 131,472(0.04%)#100 | 14,105,933(0.00%)#6,565 |
Common Questions
What are the Top 10 Cities with the Most Immigrants from Asia in Indiana?
Top 10 Cities with the Most Immigrants from Asia in Indiana are:
#1
27,048
#2
11,411
#3
7,580
#4
7,399
#5
6,612
#6
6,410
#7
5,200
#8
2,959
#9
1,963
#10
1,720
What city has the Most Immigrants from Asia in Indiana?
Indianapolis has the Most Immigrants from Asia in Indiana with 27,048.
What is the Total Immigrants from Asia in the State of Indiana?
Total Immigrants from Asia in Indiana is 131,472.
What is the Total Immigrants from Asia in the United States?
Total Immigrants from Asia in the United States is 14,105,933.