Cities with the Most Immigrants from Asia in West Virginia
RELATED REPORTS & OPTIONS
Asia
West Virginia
Compare Cities
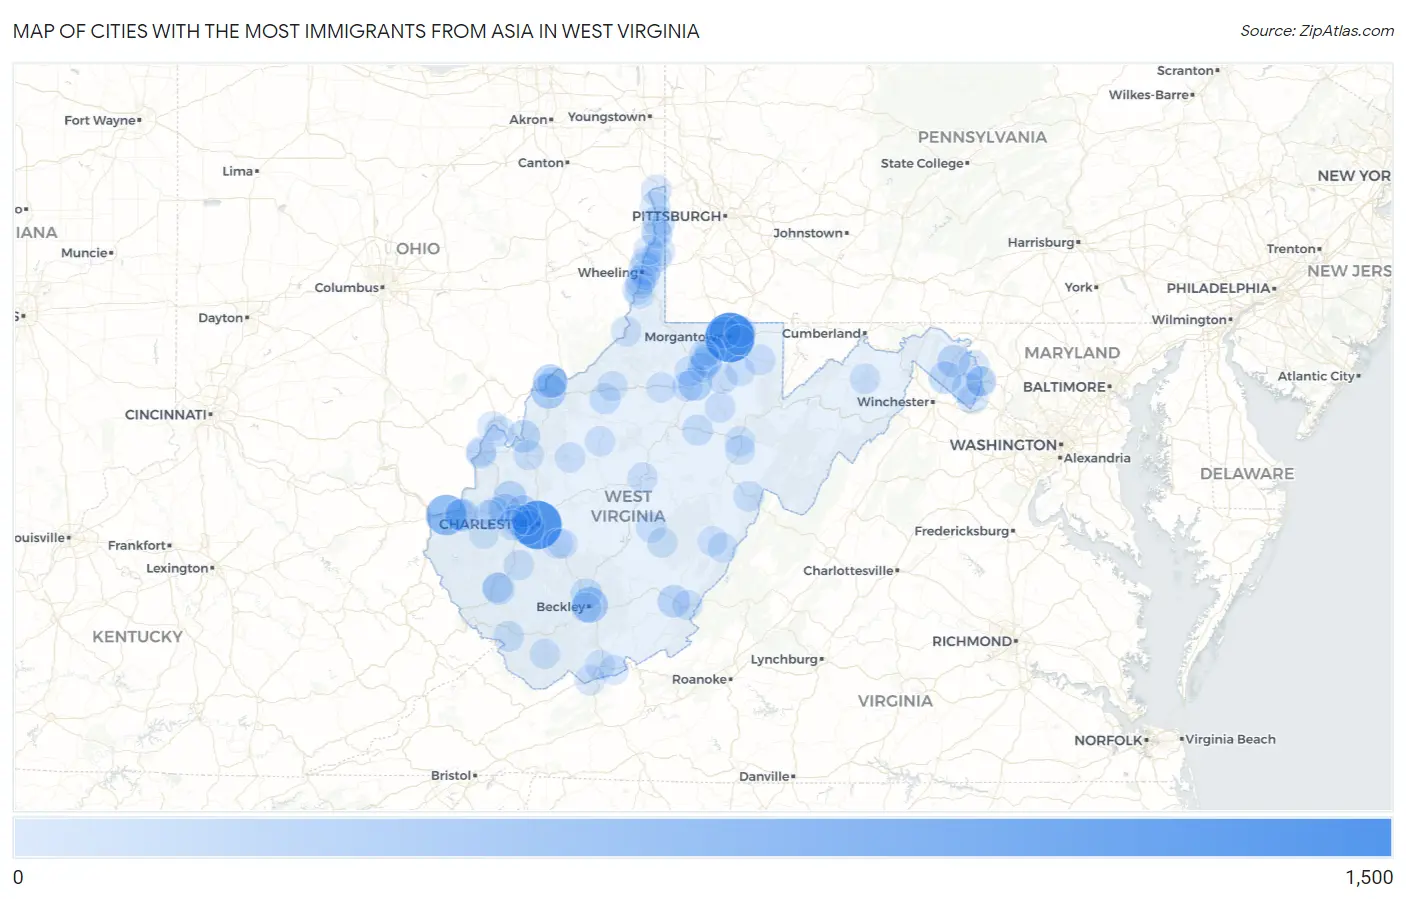
Map of Cities with the Most Immigrants from Asia in West Virginia
0
1,500
Cities with the Most Immigrants from Asia in West Virginia
| City | Asia | vs State | vs National | |
| 1. | Morgantown | 1,106 | 11,641(9.50%)#1 | 14,105,933(0.01%)#1,494 |
| 2. | Charleston | 1,045 | 11,641(8.98%)#2 | 14,105,933(0.01%)#1,548 |
| 3. | Huntington | 576 | 11,641(4.95%)#3 | 14,105,933(0.00%)#2,262 |
| 4. | Beckley | 312 | 11,641(2.68%)#4 | 14,105,933(0.00%)#3,193 |
| 5. | Parkersburg | 257 | 11,641(2.21%)#5 | 14,105,933(0.00%)#3,494 |
| 6. | South Charleston | 222 | 11,641(1.91%)#6 | 14,105,933(0.00%)#3,765 |
| 7. | Bridgeport | 203 | 11,641(1.74%)#7 | 14,105,933(0.00%)#3,933 |
| 8. | Vienna | 201 | 11,641(1.73%)#8 | 14,105,933(0.00%)#3,958 |
| 9. | Winfield | 163 | 11,641(1.40%)#9 | 14,105,933(0.00%)#4,352 |
| 10. | Barboursville | 161 | 11,641(1.38%)#10 | 14,105,933(0.00%)#4,376 |
| 11. | Ranson Corporation | 144 | 11,641(1.24%)#11 | 14,105,933(0.00%)#4,611 |
| 12. | Teays Valley | 143 | 11,641(1.23%)#12 | 14,105,933(0.00%)#4,620 |
| 13. | Martinsburg | 142 | 11,641(1.22%)#13 | 14,105,933(0.00%)#4,629 |
| 14. | Wheeling | 136 | 11,641(1.17%)#14 | 14,105,933(0.00%)#4,713 |
| 15. | Inwood | 134 | 11,641(1.15%)#15 | 14,105,933(0.00%)#4,770 |
| 16. | Ravenswood | 131 | 11,641(1.13%)#16 | 14,105,933(0.00%)#4,811 |
| 17. | Lewisburg | 128 | 11,641(1.10%)#17 | 14,105,933(0.00%)#4,860 |
| 18. | Cross Lanes | 126 | 11,641(1.08%)#18 | 14,105,933(0.00%)#4,887 |
| 19. | Charles Town | 114 | 11,641(0.98%)#19 | 14,105,933(0.00%)#5,078 |
| 20. | Weirton | 112 | 11,641(0.96%)#20 | 14,105,933(0.00%)#5,101 |
| 21. | Star City | 105 | 11,641(0.90%)#21 | 14,105,933(0.00%)#5,233 |
| 22. | Henlawson | 105 | 11,641(0.90%)#22 | 14,105,933(0.00%)#5,238 |
| 23. | Cheat Lake | 69 | 11,641(0.59%)#23 | 14,105,933(0.00%)#6,082 |
| 24. | Pea Ridge | 67 | 11,641(0.58%)#24 | 14,105,933(0.00%)#6,145 |
| 25. | Hurricane | 64 | 11,641(0.55%)#25 | 14,105,933(0.00%)#6,244 |
| 26. | Bradley | 63 | 11,641(0.54%)#26 | 14,105,933(0.00%)#6,296 |
| 27. | St Albans | 59 | 11,641(0.51%)#27 | 14,105,933(0.00%)#6,417 |
| 28. | Harrisville | 50 | 11,641(0.43%)#28 | 14,105,933(0.00%)#6,812 |
| 29. | Fairmont | 48 | 11,641(0.41%)#29 | 14,105,933(0.00%)#6,874 |
| 30. | Buckhannon | 47 | 11,641(0.40%)#30 | 14,105,933(0.00%)#6,933 |
| 31. | Shannondale | 33 | 11,641(0.28%)#31 | 14,105,933(0.00%)#7,750 |
| 32. | Tornado | 32 | 11,641(0.27%)#32 | 14,105,933(0.00%)#7,850 |
| 33. | Kingwood | 31 | 11,641(0.27%)#33 | 14,105,933(0.00%)#7,892 |
| 34. | Pleasant Valley | 30 | 11,641(0.26%)#34 | 14,105,933(0.00%)#7,966 |
| 35. | Craigsville | 29 | 11,641(0.25%)#35 | 14,105,933(0.00%)#8,081 |
| 36. | Gilbert Creek | 29 | 11,641(0.25%)#36 | 14,105,933(0.00%)#8,109 |
| 37. | Bartow | 28 | 11,641(0.24%)#37 | 14,105,933(0.00%)#8,206 |
| 38. | Philippi | 26 | 11,641(0.22%)#38 | 14,105,933(0.00%)#8,320 |
| 39. | Bluefield | 25 | 11,641(0.21%)#39 | 14,105,933(0.00%)#8,384 |
| 40. | Newell | 25 | 11,641(0.21%)#40 | 14,105,933(0.00%)#8,463 |
| 41. | Shinnston | 23 | 11,641(0.20%)#41 | 14,105,933(0.00%)#8,658 |
| 42. | Clarksburg | 21 | 11,641(0.18%)#42 | 14,105,933(0.00%)#8,824 |
| 43. | Madison | 20 | 11,641(0.17%)#43 | 14,105,933(0.00%)#8,989 |
| 44. | Shrewsbury | 20 | 11,641(0.17%)#44 | 14,105,933(0.00%)#9,041 |
| 45. | New Martinsville | 18 | 11,641(0.15%)#45 | 14,105,933(0.00%)#9,188 |
| 46. | Point Pleasant | 16 | 11,641(0.14%)#46 | 14,105,933(0.00%)#9,485 |
| 47. | Ripley | 15 | 11,641(0.13%)#47 | 14,105,933(0.00%)#9,621 |
| 48. | Spencer | 15 | 11,641(0.13%)#48 | 14,105,933(0.00%)#9,656 |
| 49. | White Hall | 14 | 11,641(0.12%)#49 | 14,105,933(0.00%)#9,856 |
| 50. | North Hills | 14 | 11,641(0.12%)#50 | 14,105,933(0.00%)#9,859 |
| 51. | Dunbar | 13 | 11,641(0.11%)#51 | 14,105,933(0.00%)#9,895 |
| 52. | Grafton | 13 | 11,641(0.11%)#52 | 14,105,933(0.00%)#9,918 |
| 53. | White Sulphur Springs | 13 | 11,641(0.11%)#53 | 14,105,933(0.00%)#9,948 |
| 54. | Brookhaven | 11 | 11,641(0.09%)#54 | 14,105,933(0.00%)#10,290 |
| 55. | Romney | 11 | 11,641(0.09%)#55 | 14,105,933(0.00%)#10,346 |
| 56. | Sutton | 11 | 11,641(0.09%)#56 | 14,105,933(0.00%)#10,422 |
| 57. | Grantsville | 11 | 11,641(0.09%)#57 | 14,105,933(0.00%)#10,467 |
| 58. | Welch | 10 | 11,641(0.09%)#58 | 14,105,933(0.00%)#10,518 |
| 59. | Culloden | 10 | 11,641(0.09%)#59 | 14,105,933(0.00%)#10,541 |
| 60. | Salem | 10 | 11,641(0.09%)#60 | 14,105,933(0.00%)#10,576 |
| 61. | Shepherdstown | 10 | 11,641(0.09%)#61 | 14,105,933(0.00%)#10,595 |
| 62. | Marlinton | 9 | 11,641(0.08%)#62 | 14,105,933(0.00%)#10,871 |
| 63. | Princeton | 8 | 11,641(0.07%)#63 | 14,105,933(0.00%)#10,991 |
| 64. | Mabscott | 8 | 11,641(0.07%)#64 | 14,105,933(0.00%)#11,105 |
| 65. | Pennsboro | 8 | 11,641(0.07%)#65 | 14,105,933(0.00%)#11,120 |
| 66. | Follansbee | 7 | 11,641(0.06%)#66 | 14,105,933(0.00%)#11,304 |
| 67. | Richwood | 7 | 11,641(0.06%)#67 | 14,105,933(0.00%)#11,311 |
| 68. | Rivesville | 7 | 11,641(0.06%)#68 | 14,105,933(0.00%)#11,456 |
| 69. | Elkins | 6 | 11,641(0.05%)#69 | 14,105,933(0.00%)#11,546 |
| 70. | Bolivar | 6 | 11,641(0.05%)#70 | 14,105,933(0.00%)#11,669 |
| 71. | New Haven | 5 | 11,641(0.04%)#71 | 14,105,933(0.00%)#11,967 |
| 72. | Moundsville | 4 | 11,641(0.03%)#72 | 14,105,933(0.00%)#12,191 |
| 73. | Barrackville | 4 | 11,641(0.03%)#73 | 14,105,933(0.00%)#12,305 |
| 74. | Mitchell Heights | 4 | 11,641(0.03%)#74 | 14,105,933(0.00%)#12,511 |
| 75. | West Liberty | 3 | 11,641(0.03%)#75 | 14,105,933(0.00%)#12,683 |
| 76. | Clearview | 3 | 11,641(0.03%)#76 | 14,105,933(0.00%)#12,892 |
| 77. | Harpers Ferry | 3 | 11,641(0.03%)#77 | 14,105,933(0.00%)#12,989 |
| 78. | Newburg | 3 | 11,641(0.03%)#78 | 14,105,933(0.00%)#13,011 |
| 79. | Oakvale | 3 | 11,641(0.03%)#79 | 14,105,933(0.00%)#13,026 |
| 80. | Mcmechen | 2 | 11,641(0.02%)#80 | 14,105,933(0.00%)#13,132 |
| 81. | Benwood | 2 | 11,641(0.02%)#81 | 14,105,933(0.00%)#13,186 |
| 82. | Bethany | 2 | 11,641(0.02%)#82 | 14,105,933(0.00%)#13,204 |
| 83. | Henderson | 2 | 11,641(0.02%)#83 | 14,105,933(0.00%)#13,536 |
| 84. | Huntersville | 2 | 11,641(0.02%)#84 | 14,105,933(0.00%)#13,638 |
| 85. | Bethlehem | 1 | 11,641(0.01%)#85 | 14,105,933(0.00%)#13,678 |
| 86. | Hooverson Heights | 1 | 11,641(0.01%)#86 | 14,105,933(0.00%)#13,681 |
| 87. | Glen Dale | 1 | 11,641(0.01%)#87 | 14,105,933(0.00%)#13,704 |
| 88. | Hamlin | 1 | 11,641(0.01%)#88 | 14,105,933(0.00%)#13,722 |
| 89. | New Cumberland | 1 | 11,641(0.01%)#89 | 14,105,933(0.00%)#13,752 |
| 90. | Mason | 1 | 11,641(0.01%)#90 | 14,105,933(0.00%)#13,787 |
| 91. | Glasgow | 1 | 11,641(0.01%)#91 | 14,105,933(0.00%)#13,790 |
| 92. | Beverly | 1 | 11,641(0.01%)#92 | 14,105,933(0.00%)#13,823 |
| 93. | Beech Bottom | 1 | 11,641(0.01%)#93 | 14,105,933(0.00%)#13,836 |
| 94. | Institute | 1 | 11,641(0.01%)#94 | 14,105,933(0.00%)#13,846 |
1
2Common Questions
What are the Top 10 Cities with the Most Immigrants from Asia in West Virginia?
Top 10 Cities with the Most Immigrants from Asia in West Virginia are:
#1
1,106
#2
1,045
#3
576
#4
312
#5
257
#6
222
#7
203
#8
201
#9
163
#10
161
What city has the Most Immigrants from Asia in West Virginia?
Morgantown has the Most Immigrants from Asia in West Virginia with 1,106.
What is the Total Immigrants from Asia in the State of West Virginia?
Total Immigrants from Asia in West Virginia is 11,641.
What is the Total Immigrants from Asia in the United States?
Total Immigrants from Asia in the United States is 14,105,933.