Cities with the Most Immigrants from Asia in New Mexico
RELATED REPORTS & OPTIONS
Asia
New Mexico
Compare Cities
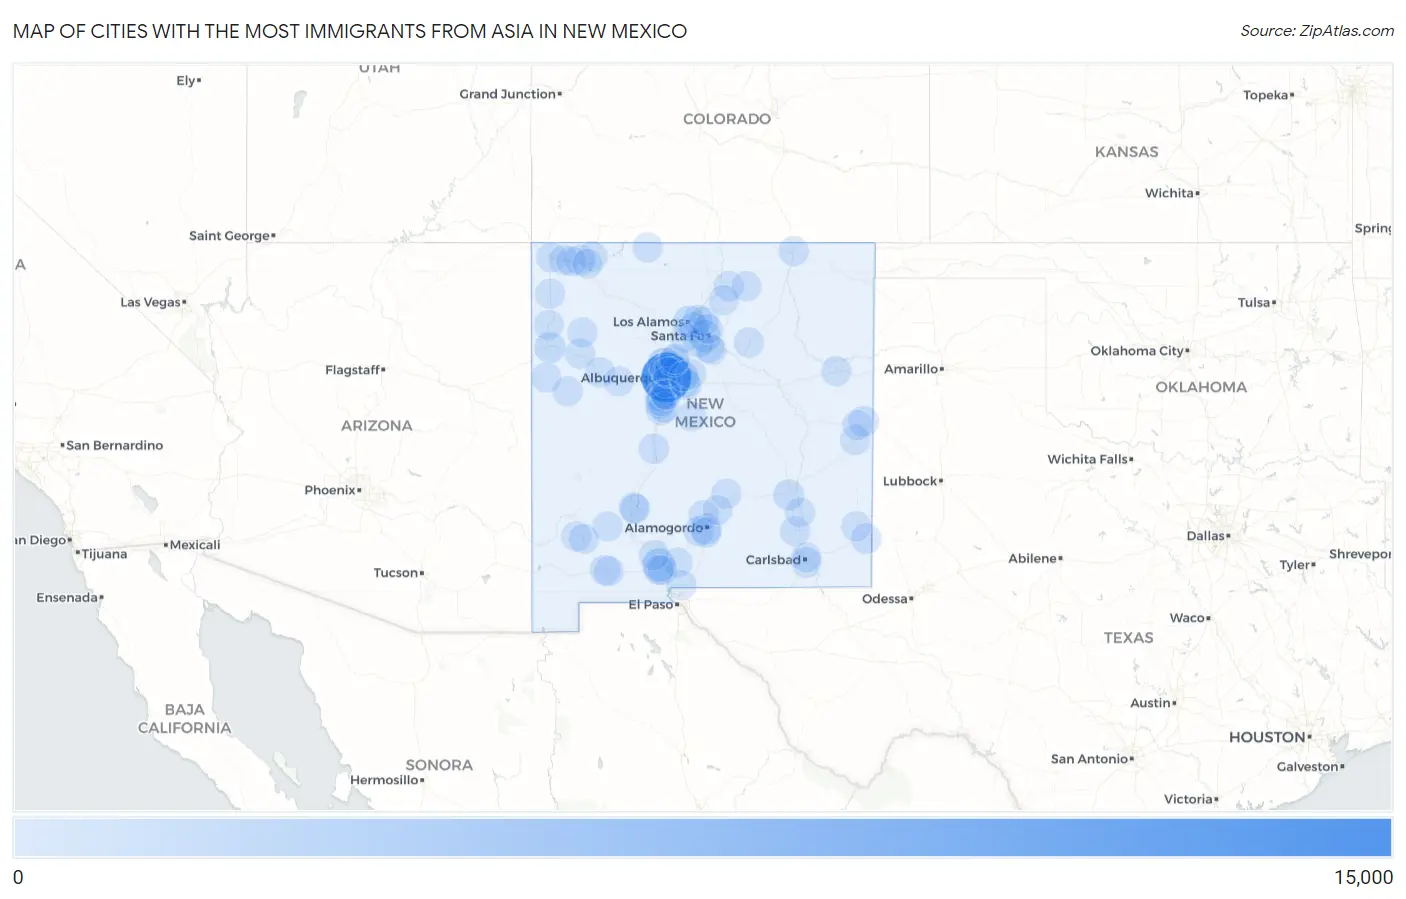
Map of Cities with the Most Immigrants from Asia in New Mexico
0
15,000
Cities with the Most Immigrants from Asia in New Mexico
| City | Asia | vs State | vs National | |
| 1. | Albuquerque | 14,221 | 27,577(51.57%)#1 | 14,105,933(0.10%)#135 |
| 2. | Las Cruces | 2,071 | 27,577(7.51%)#2 | 14,105,933(0.01%)#941 |
| 3. | Rio Rancho | 1,311 | 27,577(4.75%)#3 | 14,105,933(0.01%)#1,337 |
| 4. | Santa Fe | 1,273 | 27,577(4.62%)#4 | 14,105,933(0.01%)#1,360 |
| 5. | Los Alamos | 848 | 27,577(3.08%)#5 | 14,105,933(0.01%)#1,794 |
| 6. | Gallup | 604 | 27,577(2.19%)#6 | 14,105,933(0.00%)#2,196 |
| 7. | Roswell | 590 | 27,577(2.14%)#7 | 14,105,933(0.00%)#2,226 |
| 8. | Alamogordo | 546 | 27,577(1.98%)#8 | 14,105,933(0.00%)#2,325 |
| 9. | Farmington | 369 | 27,577(1.34%)#9 | 14,105,933(0.00%)#2,906 |
| 10. | Clovis | 291 | 27,577(1.06%)#10 | 14,105,933(0.00%)#3,317 |
| 11. | Jarales | 258 | 27,577(0.94%)#11 | 14,105,933(0.00%)#3,492 |
| 12. | Carlsbad | 240 | 27,577(0.87%)#12 | 14,105,933(0.00%)#3,635 |
| 13. | Socorro | 228 | 27,577(0.83%)#13 | 14,105,933(0.00%)#3,726 |
| 14. | Hobbs | 200 | 27,577(0.73%)#14 | 14,105,933(0.00%)#3,963 |
| 15. | Belen | 137 | 27,577(0.50%)#15 | 14,105,933(0.00%)#4,701 |
| 16. | Los Lunas | 136 | 27,577(0.49%)#16 | 14,105,933(0.00%)#4,715 |
| 17. | Ruidoso | 114 | 27,577(0.41%)#17 | 14,105,933(0.00%)#5,077 |
| 18. | Silver City | 113 | 27,577(0.41%)#18 | 14,105,933(0.00%)#5,091 |
| 19. | Portales | 110 | 27,577(0.40%)#19 | 14,105,933(0.00%)#5,143 |
| 20. | Shiprock | 99 | 27,577(0.36%)#20 | 14,105,933(0.00%)#5,340 |
| 21. | Espanola | 97 | 27,577(0.35%)#21 | 14,105,933(0.00%)#5,372 |
| 22. | Artesia | 94 | 27,577(0.34%)#22 | 14,105,933(0.00%)#5,436 |
| 23. | Corrales | 92 | 27,577(0.33%)#23 | 14,105,933(0.00%)#5,491 |
| 24. | Deming | 90 | 27,577(0.33%)#24 | 14,105,933(0.00%)#5,540 |
| 25. | Las Vegas | 86 | 27,577(0.31%)#25 | 14,105,933(0.00%)#5,617 |
| 26. | Eldorado At Santa Fe | 86 | 27,577(0.31%)#26 | 14,105,933(0.00%)#5,623 |
| 27. | Sandia Heights | 77 | 27,577(0.28%)#27 | 14,105,933(0.00%)#5,862 |
| 28. | Rio Communities | 76 | 27,577(0.28%)#28 | 14,105,933(0.00%)#5,885 |
| 29. | Raton | 66 | 27,577(0.24%)#29 | 14,105,933(0.00%)#6,181 |
| 30. | Taos | 62 | 27,577(0.22%)#30 | 14,105,933(0.00%)#6,322 |
| 31. | White Sands | 57 | 27,577(0.21%)#31 | 14,105,933(0.00%)#6,517 |
| 32. | Chaparral | 56 | 27,577(0.20%)#32 | 14,105,933(0.00%)#6,523 |
| 33. | Grants | 56 | 27,577(0.20%)#33 | 14,105,933(0.00%)#6,532 |
| 34. | North Valley | 52 | 27,577(0.19%)#34 | 14,105,933(0.00%)#6,694 |
| 35. | Cannon Afb | 51 | 27,577(0.18%)#35 | 14,105,933(0.00%)#6,754 |
| 36. | Bosque Farms | 50 | 27,577(0.18%)#36 | 14,105,933(0.00%)#6,792 |
| 37. | Holloman Afb | 48 | 27,577(0.17%)#37 | 14,105,933(0.00%)#6,890 |
| 38. | Placitas Cdp Sandoval County | 46 | 27,577(0.17%)#38 | 14,105,933(0.00%)#6,975 |
| 39. | South Valley | 45 | 27,577(0.16%)#39 | 14,105,933(0.00%)#7,001 |
| 40. | Aztec | 40 | 27,577(0.15%)#40 | 14,105,933(0.00%)#7,294 |
| 41. | Kingston | 40 | 27,577(0.15%)#41 | 14,105,933(0.00%)#7,341 |
| 42. | Waterflow | 39 | 27,577(0.14%)#42 | 14,105,933(0.00%)#7,388 |
| 43. | Tohatchi | 39 | 27,577(0.14%)#43 | 14,105,933(0.00%)#7,392 |
| 44. | Center Point | 37 | 27,577(0.13%)#44 | 14,105,933(0.00%)#7,494 |
| 45. | Tucumcari | 36 | 27,577(0.13%)#45 | 14,105,933(0.00%)#7,540 |
| 46. | Paradise Hills | 36 | 27,577(0.13%)#46 | 14,105,933(0.00%)#7,547 |
| 47. | Picacho Hills | 35 | 27,577(0.13%)#47 | 14,105,933(0.00%)#7,621 |
| 48. | Tularosa | 34 | 27,577(0.12%)#48 | 14,105,933(0.00%)#7,680 |
| 49. | Crouch Mesa | 32 | 27,577(0.12%)#49 | 14,105,933(0.00%)#7,808 |
| 50. | Ponderosa Pine | 27 | 27,577(0.10%)#50 | 14,105,933(0.00%)#8,260 |
| 51. | La Cienega | 25 | 27,577(0.09%)#51 | 14,105,933(0.00%)#8,409 |
| 52. | Thoreau | 25 | 27,577(0.09%)#52 | 14,105,933(0.00%)#8,439 |
| 53. | Tres Arroyos | 24 | 27,577(0.09%)#53 | 14,105,933(0.00%)#8,546 |
| 54. | Las Campanas | 24 | 27,577(0.09%)#54 | 14,105,933(0.00%)#8,560 |
| 55. | Black Rock | 23 | 27,577(0.08%)#55 | 14,105,933(0.00%)#8,687 |
| 56. | Los Chaves | 22 | 27,577(0.08%)#56 | 14,105,933(0.00%)#8,731 |
| 57. | Kirtland Afb | 22 | 27,577(0.08%)#57 | 14,105,933(0.00%)#8,745 |
| 58. | Los Ranchos De Albuquerque | 21 | 27,577(0.08%)#58 | 14,105,933(0.00%)#8,837 |
| 59. | Boles Acres | 21 | 27,577(0.08%)#59 | 14,105,933(0.00%)#8,887 |
| 60. | Mountainair | 21 | 27,577(0.08%)#60 | 14,105,933(0.00%)#8,918 |
| 61. | Lamy | 21 | 27,577(0.08%)#61 | 14,105,933(0.00%)#8,944 |
| 62. | Lovington | 19 | 27,577(0.07%)#62 | 14,105,933(0.00%)#9,050 |
| 63. | North Hurley | 19 | 27,577(0.07%)#63 | 14,105,933(0.00%)#9,163 |
| 64. | University Park | 18 | 27,577(0.07%)#64 | 14,105,933(0.00%)#9,215 |
| 65. | Cedro | 18 | 27,577(0.07%)#65 | 14,105,933(0.00%)#9,287 |
| 66. | Edgewood | 17 | 27,577(0.06%)#66 | 14,105,933(0.00%)#9,317 |
| 67. | Truth Or Consequences | 17 | 27,577(0.06%)#67 | 14,105,933(0.00%)#9,319 |
| 68. | Kirtland | 15 | 27,577(0.05%)#68 | 14,105,933(0.00%)#9,715 |
| 69. | Radium Springs | 14 | 27,577(0.05%)#69 | 14,105,933(0.00%)#9,823 |
| 70. | La Huerta | 13 | 27,577(0.05%)#70 | 14,105,933(0.00%)#10,003 |
| 71. | Pinehill | 13 | 27,577(0.05%)#71 | 14,105,933(0.00%)#10,058 |
| 72. | Encantado | 13 | 27,577(0.05%)#72 | 14,105,933(0.00%)#10,071 |
| 73. | Ventura | 12 | 27,577(0.04%)#73 | 14,105,933(0.00%)#10,222 |
| 74. | Edith Enclave | 11 | 27,577(0.04%)#74 | 14,105,933(0.00%)#10,471 |
| 75. | White Rock | 10 | 27,577(0.04%)#75 | 14,105,933(0.00%)#10,504 |
| 76. | Paa-Ko | 10 | 27,577(0.04%)#76 | 14,105,933(0.00%)#10,681 |
| 77. | Lee Acres | 9 | 27,577(0.03%)#77 | 14,105,933(0.00%)#10,747 |
| 78. | Dulce | 9 | 27,577(0.03%)#78 | 14,105,933(0.00%)#10,799 |
| 79. | Santa Fe Foothills | 9 | 27,577(0.03%)#79 | 14,105,933(0.00%)#10,914 |
| 80. | Newcomb | 9 | 27,577(0.03%)#80 | 14,105,933(0.00%)#10,945 |
| 81. | Bernalillo | 8 | 27,577(0.03%)#81 | 14,105,933(0.00%)#10,978 |
| 82. | Peralta | 8 | 27,577(0.03%)#82 | 14,105,933(0.00%)#11,013 |
| 83. | Elephant Butte | 8 | 27,577(0.03%)#83 | 14,105,933(0.00%)#11,099 |
| 84. | Mescalero | 8 | 27,577(0.03%)#84 | 14,105,933(0.00%)#11,155 |
| 85. | San Ildefonso Pueblo | 8 | 27,577(0.03%)#85 | 14,105,933(0.00%)#11,179 |
| 86. | Mesilla | 6 | 27,577(0.02%)#86 | 14,105,933(0.00%)#11,643 |
| 87. | Angel Fire | 6 | 27,577(0.02%)#87 | 14,105,933(0.00%)#11,709 |
| 88. | Hagerman | 6 | 27,577(0.02%)#88 | 14,105,933(0.00%)#11,751 |
| 89. | Crownpoint | 5 | 27,577(0.02%)#89 | 14,105,933(0.00%)#11,910 |
| 90. | Pojoaque | 4 | 27,577(0.01%)#90 | 14,105,933(0.00%)#12,246 |
| 91. | Cañoncito | 4 | 27,577(0.01%)#91 | 14,105,933(0.00%)#12,365 |
| 92. | Cedar Crest | 4 | 27,577(0.01%)#92 | 14,105,933(0.00%)#12,379 |
| 93. | Peak Place | 4 | 27,577(0.01%)#93 | 14,105,933(0.00%)#12,494 |
| 94. | Barton | 3 | 27,577(0.01%)#94 | 14,105,933(0.00%)#12,705 |
| 95. | Cochiti Lake | 2 | 27,577(0.01%)#95 | 14,105,933(0.00%)#13,390 |
| 96. | Vadito | 2 | 27,577(0.01%)#96 | 14,105,933(0.00%)#13,444 |
| 97. | Santa Ana Pueblo | 1 | 27,577(0.00%)#97 | 14,105,933(0.00%)#13,759 |
| 98. | Seama | 1 | 27,577(0.00%)#98 | 14,105,933(0.00%)#13,913 |
Common Questions
What are the Top 10 Cities with the Most Immigrants from Asia in New Mexico?
Top 10 Cities with the Most Immigrants from Asia in New Mexico are:
#1
14,221
#2
2,071
#3
1,311
#4
1,273
#5
848
#6
604
#7
590
#8
546
#9
369
#10
291
What city has the Most Immigrants from Asia in New Mexico?
Albuquerque has the Most Immigrants from Asia in New Mexico with 14,221.
What is the Total Immigrants from Asia in the State of New Mexico?
Total Immigrants from Asia in New Mexico is 27,577.
What is the Total Immigrants from Asia in the United States?
Total Immigrants from Asia in the United States is 14,105,933.