Cities with the Most Immigrants from Asia in Tennessee
RELATED REPORTS & OPTIONS
Asia
Tennessee
Compare Cities
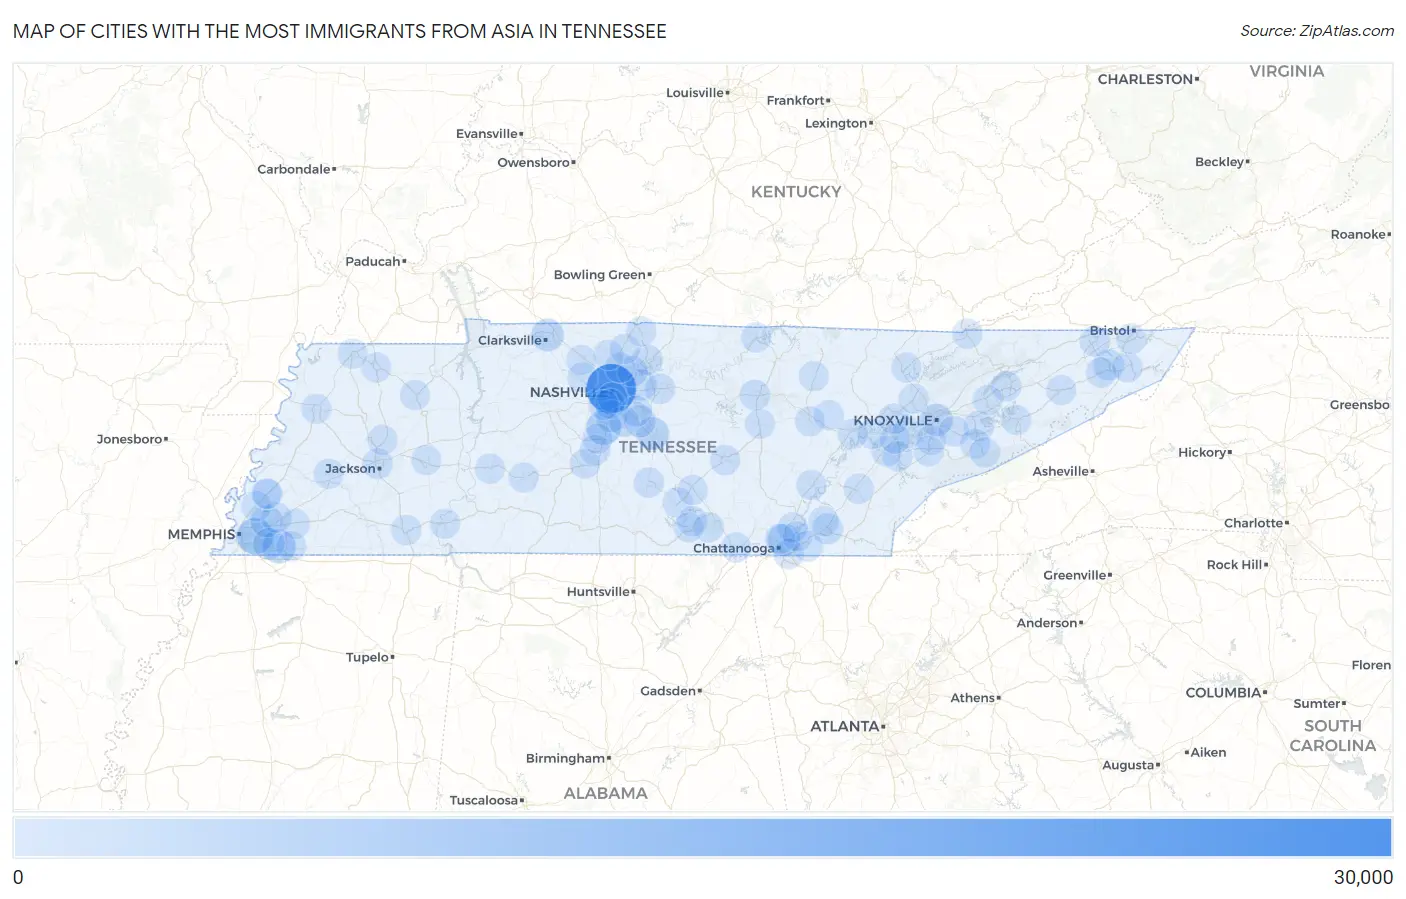
Map of Cities with the Most Immigrants from Asia in Tennessee
0
30,000
Cities with the Most Immigrants from Asia in Tennessee
| City | Asia | vs State | vs National | |
| 1. | Nashville | 26,521 | 109,258(24.27%)#1 | 14,105,933(0.19%)#58 |
| 2. | Memphis | 7,957 | 109,258(7.28%)#2 | 14,105,933(0.06%)#256 |
| 3. | Franklin | 5,867 | 109,258(5.37%)#3 | 14,105,933(0.04%)#366 |
| 4. | Collierville | 5,155 | 109,258(4.72%)#4 | 14,105,933(0.04%)#413 |
| 5. | Murfreesboro | 3,388 | 109,258(3.10%)#5 | 14,105,933(0.02%)#616 |
| 6. | Knoxville | 3,387 | 109,258(3.10%)#6 | 14,105,933(0.02%)#617 |
| 7. | Clarksville | 3,287 | 109,258(3.01%)#7 | 14,105,933(0.02%)#635 |
| 8. | Chattanooga | 3,151 | 109,258(2.88%)#8 | 14,105,933(0.02%)#656 |
| 9. | Brentwood | 2,373 | 109,258(2.17%)#9 | 14,105,933(0.02%)#835 |
| 10. | Bartlett | 2,339 | 109,258(2.14%)#10 | 14,105,933(0.02%)#848 |
| 11. | Smyrna | 2,251 | 109,258(2.06%)#11 | 14,105,933(0.02%)#877 |
| 12. | Germantown | 1,995 | 109,258(1.83%)#12 | 14,105,933(0.01%)#972 |
| 13. | Mount Juliet | 1,253 | 109,258(1.15%)#13 | 14,105,933(0.01%)#1,372 |
| 14. | Johnson City | 1,181 | 109,258(1.08%)#14 | 14,105,933(0.01%)#1,430 |
| 15. | Cleveland | 1,180 | 109,258(1.08%)#15 | 14,105,933(0.01%)#1,431 |
| 16. | La Vergne | 934 | 109,258(0.85%)#16 | 14,105,933(0.01%)#1,680 |
| 17. | Farragut | 871 | 109,258(0.80%)#17 | 14,105,933(0.01%)#1,764 |
| 18. | Gallatin | 807 | 109,258(0.74%)#18 | 14,105,933(0.01%)#1,855 |
| 19. | Hendersonville | 789 | 109,258(0.72%)#19 | 14,105,933(0.01%)#1,877 |
| 20. | Jackson | 693 | 109,258(0.63%)#20 | 14,105,933(0.00%)#2,022 |
| 21. | Cookeville | 691 | 109,258(0.63%)#21 | 14,105,933(0.00%)#2,026 |
| 22. | Kingsport | 634 | 109,258(0.58%)#22 | 14,105,933(0.00%)#2,126 |
| 23. | Oak Ridge | 588 | 109,258(0.54%)#23 | 14,105,933(0.00%)#2,234 |
| 24. | Lebanon | 480 | 109,258(0.44%)#24 | 14,105,933(0.00%)#2,500 |
| 25. | Nolensville | 470 | 109,258(0.43%)#25 | 14,105,933(0.00%)#2,542 |
| 26. | Sevierville | 464 | 109,258(0.42%)#26 | 14,105,933(0.00%)#2,554 |
| 27. | Spring Hill | 436 | 109,258(0.40%)#27 | 14,105,933(0.00%)#2,650 |
| 28. | Seymour | 406 | 109,258(0.37%)#28 | 14,105,933(0.00%)#2,750 |
| 29. | Morristown | 402 | 109,258(0.37%)#29 | 14,105,933(0.00%)#2,762 |
| 30. | Maryville | 374 | 109,258(0.34%)#30 | 14,105,933(0.00%)#2,889 |
| 31. | Goodlettsville | 372 | 109,258(0.34%)#31 | 14,105,933(0.00%)#2,899 |
| 32. | Collegedale | 289 | 109,258(0.26%)#32 | 14,105,933(0.00%)#3,331 |
| 33. | East Ridge | 286 | 109,258(0.26%)#33 | 14,105,933(0.00%)#3,343 |
| 34. | Lakeland | 257 | 109,258(0.24%)#34 | 14,105,933(0.00%)#3,497 |
| 35. | Mcminnville | 248 | 109,258(0.23%)#35 | 14,105,933(0.00%)#3,575 |
| 36. | Shelbyville | 245 | 109,258(0.22%)#36 | 14,105,933(0.00%)#3,596 |
| 37. | Millington | 244 | 109,258(0.22%)#37 | 14,105,933(0.00%)#3,611 |
| 38. | Jonesborough | 236 | 109,258(0.22%)#38 | 14,105,933(0.00%)#3,673 |
| 39. | Tullahoma | 219 | 109,258(0.20%)#39 | 14,105,933(0.00%)#3,795 |
| 40. | Middle Valley | 214 | 109,258(0.20%)#40 | 14,105,933(0.00%)#3,842 |
| 41. | Pigeon Forge | 193 | 109,258(0.18%)#41 | 14,105,933(0.00%)#4,040 |
| 42. | Gatlinburg | 185 | 109,258(0.17%)#42 | 14,105,933(0.00%)#4,115 |
| 43. | Powell | 180 | 109,258(0.16%)#43 | 14,105,933(0.00%)#4,153 |
| 44. | Columbia | 178 | 109,258(0.16%)#44 | 14,105,933(0.00%)#4,177 |
| 45. | Thompson S Station | 176 | 109,258(0.16%)#45 | 14,105,933(0.00%)#4,210 |
| 46. | Manchester | 166 | 109,258(0.15%)#46 | 14,105,933(0.00%)#4,311 |
| 47. | White House | 161 | 109,258(0.15%)#47 | 14,105,933(0.00%)#4,369 |
| 48. | Athens | 159 | 109,258(0.15%)#48 | 14,105,933(0.00%)#4,402 |
| 49. | Greenbrier | 158 | 109,258(0.14%)#49 | 14,105,933(0.00%)#4,422 |
| 50. | Loudon | 139 | 109,258(0.13%)#50 | 14,105,933(0.00%)#4,675 |
| 51. | Harrison | 134 | 109,258(0.12%)#51 | 14,105,933(0.00%)#4,758 |
| 52. | Ashland City | 133 | 109,258(0.12%)#52 | 14,105,933(0.00%)#4,783 |
| 53. | Alcoa | 131 | 109,258(0.12%)#53 | 14,105,933(0.00%)#4,807 |
| 54. | Elizabethton | 128 | 109,258(0.12%)#54 | 14,105,933(0.00%)#4,848 |
| 55. | Dyersburg | 114 | 109,258(0.10%)#55 | 14,105,933(0.00%)#5,071 |
| 56. | Munford | 112 | 109,258(0.10%)#56 | 14,105,933(0.00%)#5,111 |
| 57. | Berry Hill | 107 | 109,258(0.10%)#57 | 14,105,933(0.00%)#5,208 |
| 58. | Oakland | 101 | 109,258(0.09%)#58 | 14,105,933(0.00%)#5,290 |
| 59. | Medina | 93 | 109,258(0.09%)#59 | 14,105,933(0.00%)#5,466 |
| 60. | Bristol | 85 | 109,258(0.08%)#60 | 14,105,933(0.00%)#5,630 |
| 61. | Atoka | 83 | 109,258(0.08%)#61 | 14,105,933(0.00%)#5,680 |
| 62. | Dayton | 75 | 109,258(0.07%)#62 | 14,105,933(0.00%)#5,906 |
| 63. | Martin | 74 | 109,258(0.07%)#63 | 14,105,933(0.00%)#5,931 |
| 64. | Savannah | 74 | 109,258(0.07%)#64 | 14,105,933(0.00%)#5,940 |
| 65. | Harrogate | 73 | 109,258(0.07%)#65 | 14,105,933(0.00%)#5,977 |
| 66. | Oak Hill | 72 | 109,258(0.07%)#66 | 14,105,933(0.00%)#6,001 |
| 67. | Red Bank | 70 | 109,258(0.06%)#67 | 14,105,933(0.00%)#6,050 |
| 68. | Mckenzie | 70 | 109,258(0.06%)#68 | 14,105,933(0.00%)#6,061 |
| 69. | Newport | 69 | 109,258(0.06%)#69 | 14,105,933(0.00%)#6,085 |
| 70. | Fairfield Glade | 64 | 109,258(0.06%)#70 | 14,105,933(0.00%)#6,241 |
| 71. | Kingston | 63 | 109,258(0.06%)#71 | 14,105,933(0.00%)#6,285 |
| 72. | Brownsville | 62 | 109,258(0.06%)#72 | 14,105,933(0.00%)#6,313 |
| 73. | Lynchburg | 61 | 109,258(0.06%)#73 | 14,105,933(0.00%)#6,359 |
| 74. | Rockwood | 61 | 109,258(0.06%)#74 | 14,105,933(0.00%)#6,362 |
| 75. | Hohenwald | 60 | 109,258(0.05%)#75 | 14,105,933(0.00%)#6,403 |
| 76. | Pleasant View | 59 | 109,258(0.05%)#76 | 14,105,933(0.00%)#6,428 |
| 77. | Linden | 59 | 109,258(0.05%)#77 | 14,105,933(0.00%)#6,439 |
| 78. | Oak Grove Cdp Washington County | 57 | 109,258(0.05%)#78 | 14,105,933(0.00%)#6,503 |
| 79. | Tellico Village | 56 | 109,258(0.05%)#79 | 14,105,933(0.00%)#6,535 |
| 80. | Sewanee | 53 | 109,258(0.05%)#80 | 14,105,933(0.00%)#6,665 |
| 81. | Portland | 52 | 109,258(0.05%)#81 | 14,105,933(0.00%)#6,690 |
| 82. | Forest Hills | 50 | 109,258(0.05%)#82 | 14,105,933(0.00%)#6,784 |
| 83. | Selmer | 50 | 109,258(0.05%)#83 | 14,105,933(0.00%)#6,789 |
| 84. | Jacksboro | 48 | 109,258(0.04%)#84 | 14,105,933(0.00%)#6,897 |
| 85. | Decherd | 46 | 109,258(0.04%)#85 | 14,105,933(0.00%)#6,985 |
| 86. | Crossville | 44 | 109,258(0.04%)#86 | 14,105,933(0.00%)#7,060 |
| 87. | Greeneville | 43 | 109,258(0.04%)#87 | 14,105,933(0.00%)#7,117 |
| 88. | Celina | 43 | 109,258(0.04%)#88 | 14,105,933(0.00%)#7,159 |
| 89. | Kimball | 43 | 109,258(0.04%)#89 | 14,105,933(0.00%)#7,162 |
| 90. | Clinton | 40 | 109,258(0.04%)#90 | 14,105,933(0.00%)#7,284 |
| 91. | Rocky Top | 40 | 109,258(0.04%)#91 | 14,105,933(0.00%)#7,328 |
| 92. | Jefferson City | 36 | 109,258(0.03%)#92 | 14,105,933(0.00%)#7,531 |
| 93. | Winchester | 35 | 109,258(0.03%)#93 | 14,105,933(0.00%)#7,586 |
| 94. | Lexington | 35 | 109,258(0.03%)#94 | 14,105,933(0.00%)#7,591 |
| 95. | Sparta | 35 | 109,258(0.03%)#95 | 14,105,933(0.00%)#7,598 |
| 96. | Union City | 34 | 109,258(0.03%)#96 | 14,105,933(0.00%)#7,645 |
| 97. | Lenoir City | 34 | 109,258(0.03%)#97 | 14,105,933(0.00%)#7,647 |
| 98. | Hopewell | 34 | 109,258(0.03%)#98 | 14,105,933(0.00%)#7,679 |
| 99. | Grimsley | 34 | 109,258(0.03%)#99 | 14,105,933(0.00%)#7,705 |
| 100. | Piperton | 33 | 109,258(0.03%)#100 | 14,105,933(0.00%)#7,761 |
Common Questions
What are the Top 10 Cities with the Most Immigrants from Asia in Tennessee?
Top 10 Cities with the Most Immigrants from Asia in Tennessee are:
#1
26,521
#2
7,957
#3
5,867
#4
5,155
#5
3,388
#6
3,387
#7
3,287
#8
3,151
#9
2,373
#10
2,339
What city has the Most Immigrants from Asia in Tennessee?
Nashville has the Most Immigrants from Asia in Tennessee with 26,521.
What is the Total Immigrants from Asia in the State of Tennessee?
Total Immigrants from Asia in Tennessee is 109,258.
What is the Total Immigrants from Asia in the United States?
Total Immigrants from Asia in the United States is 14,105,933.