Cities with the Most Immigrants from Asia in Montana
RELATED REPORTS & OPTIONS
Asia
Montana
Compare Cities
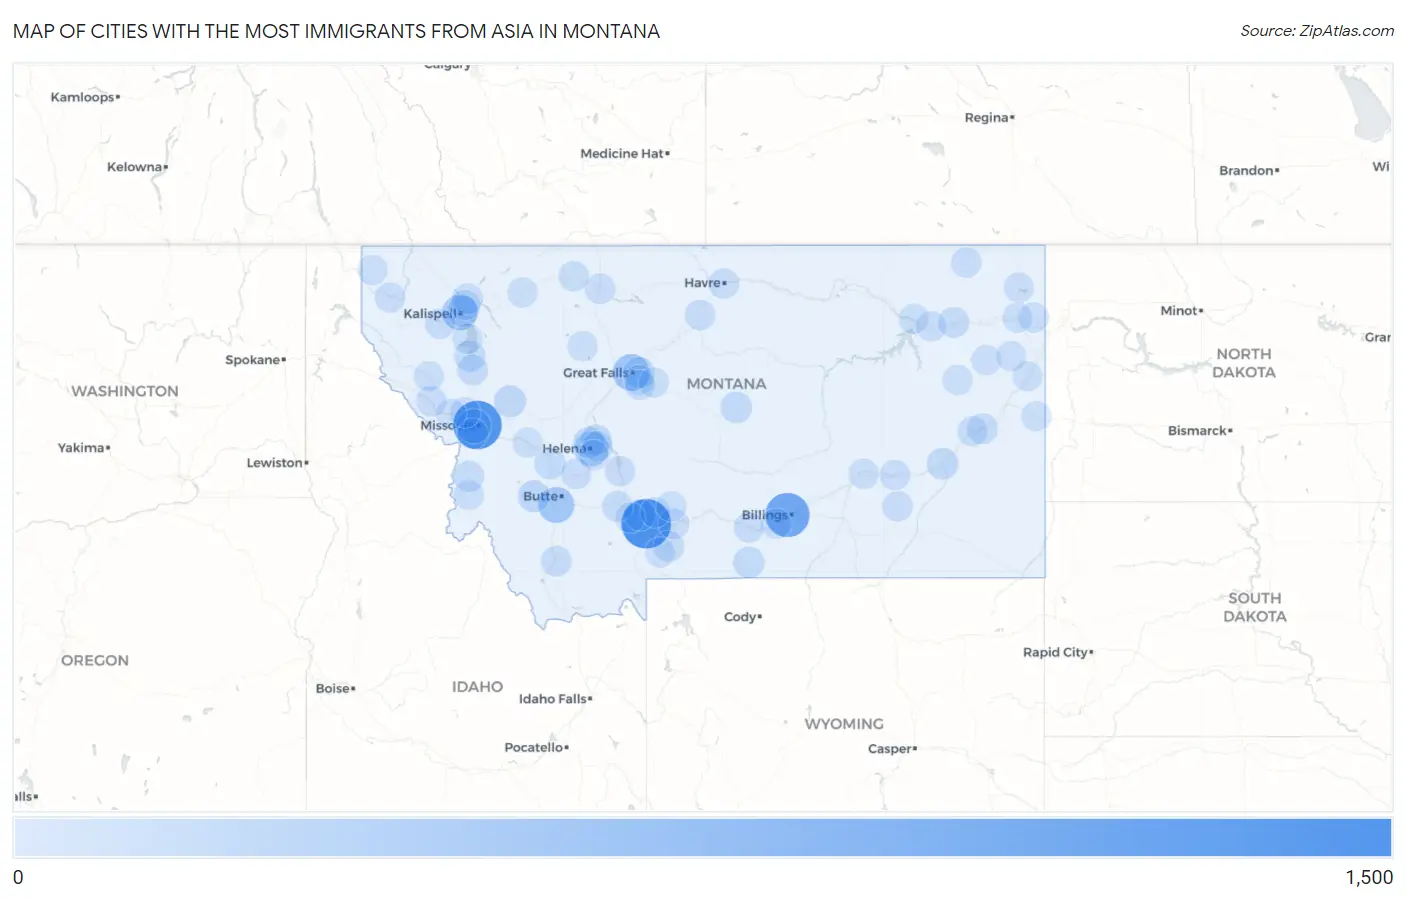
Map of Cities with the Most Immigrants from Asia in Montana
0
1,500
Cities with the Most Immigrants from Asia in Montana
| City | Asia | vs State | vs National | |
| 1. | Bozeman | 1,131 | 7,224(15.66%)#1 | 14,105,933(0.01%)#1,467 |
| 2. | Missoula | 1,067 | 7,224(14.77%)#2 | 14,105,933(0.01%)#1,532 |
| 3. | Billings | 811 | 7,224(11.23%)#3 | 14,105,933(0.01%)#1,848 |
| 4. | Great Falls | 377 | 7,224(5.22%)#4 | 14,105,933(0.00%)#2,874 |
| 5. | Butte Silver Bow Balance | 334 | 7,224(4.62%)#5 | 14,105,933(0.00%)#3,075 |
| 6. | Kalispell | 302 | 7,224(4.18%)#6 | 14,105,933(0.00%)#3,253 |
| 7. | Helena | 249 | 7,224(3.45%)#7 | 14,105,933(0.00%)#3,560 |
| 8. | Orchard Homes | 236 | 7,224(3.27%)#8 | 14,105,933(0.00%)#3,674 |
| 9. | Seeley Lake | 100 | 7,224(1.38%)#9 | 14,105,933(0.00%)#5,333 |
| 10. | Anaconda Deer Lodge County | 99 | 7,224(1.37%)#10 | 14,105,933(0.00%)#5,339 |
| 11. | Miles City | 79 | 7,224(1.09%)#11 | 14,105,933(0.00%)#5,799 |
| 12. | Lewistown Heights | 79 | 7,224(1.09%)#12 | 14,105,933(0.00%)#5,815 |
| 13. | Malmstrom Afb | 77 | 7,224(1.07%)#13 | 14,105,933(0.00%)#5,860 |
| 14. | Red Lodge | 68 | 7,224(0.94%)#14 | 14,105,933(0.00%)#6,132 |
| 15. | Belgrade | 60 | 7,224(0.83%)#15 | 14,105,933(0.00%)#6,379 |
| 16. | Polson | 60 | 7,224(0.83%)#16 | 14,105,933(0.00%)#6,395 |
| 17. | Helena Valley West Central | 58 | 7,224(0.80%)#17 | 14,105,933(0.00%)#6,456 |
| 18. | Deer Lodge | 55 | 7,224(0.76%)#18 | 14,105,933(0.00%)#6,586 |
| 19. | Evergreen | 53 | 7,224(0.73%)#19 | 14,105,933(0.00%)#6,642 |
| 20. | Helena Valley Northeast | 52 | 7,224(0.72%)#20 | 14,105,933(0.00%)#6,705 |
| 21. | Hamilton | 46 | 7,224(0.64%)#21 | 14,105,933(0.00%)#6,969 |
| 22. | Wolf Point | 45 | 7,224(0.62%)#22 | 14,105,933(0.00%)#7,035 |
| 23. | Ronan | 42 | 7,224(0.58%)#23 | 14,105,933(0.00%)#7,208 |
| 24. | Three Forks | 38 | 7,224(0.53%)#24 | 14,105,933(0.00%)#7,443 |
| 25. | Fallon | 34 | 7,224(0.47%)#25 | 14,105,933(0.00%)#7,711 |
| 26. | Dillon | 30 | 7,224(0.42%)#26 | 14,105,933(0.00%)#7,960 |
| 27. | Pray | 30 | 7,224(0.42%)#27 | 14,105,933(0.00%)#8,007 |
| 28. | Lolo | 28 | 7,224(0.39%)#28 | 14,105,933(0.00%)#8,141 |
| 29. | Livingston | 25 | 7,224(0.35%)#29 | 14,105,933(0.00%)#8,387 |
| 30. | Townsend | 25 | 7,224(0.35%)#30 | 14,105,933(0.00%)#8,441 |
| 31. | Shelby | 23 | 7,224(0.32%)#31 | 14,105,933(0.00%)#8,642 |
| 32. | Frenchtown | 21 | 7,224(0.29%)#32 | 14,105,933(0.00%)#8,900 |
| 33. | Basin | 21 | 7,224(0.29%)#33 | 14,105,933(0.00%)#8,942 |
| 34. | Havre | 19 | 7,224(0.26%)#34 | 14,105,933(0.00%)#9,055 |
| 35. | Colstrip | 19 | 7,224(0.26%)#35 | 14,105,933(0.00%)#9,104 |
| 36. | Riverbend | 19 | 7,224(0.26%)#36 | 14,105,933(0.00%)#9,154 |
| 37. | Bridger | 19 | 7,224(0.26%)#37 | 14,105,933(0.00%)#9,162 |
| 38. | Helena Valley Southeast | 18 | 7,224(0.25%)#38 | 14,105,933(0.00%)#9,168 |
| 39. | Scobey | 18 | 7,224(0.25%)#39 | 14,105,933(0.00%)#9,278 |
| 40. | Columbia Falls | 16 | 7,224(0.22%)#40 | 14,105,933(0.00%)#9,477 |
| 41. | Forsyth | 16 | 7,224(0.22%)#41 | 14,105,933(0.00%)#9,531 |
| 42. | Big Sandy | 15 | 7,224(0.21%)#42 | 14,105,933(0.00%)#9,702 |
| 43. | Cut Bank | 14 | 7,224(0.19%)#43 | 14,105,933(0.00%)#9,776 |
| 44. | Laurel | 13 | 7,224(0.18%)#44 | 14,105,933(0.00%)#9,898 |
| 45. | Marion | 13 | 7,224(0.18%)#45 | 14,105,933(0.00%)#10,006 |
| 46. | Columbus | 12 | 7,224(0.17%)#46 | 14,105,933(0.00%)#10,165 |
| 47. | Libby | 10 | 7,224(0.14%)#47 | 14,105,933(0.00%)#10,542 |
| 48. | Frazer | 9 | 7,224(0.12%)#48 | 14,105,933(0.00%)#10,953 |
| 49. | Hysham | 8 | 7,224(0.11%)#49 | 14,105,933(0.00%)#11,241 |
| 50. | Helena Flats | 7 | 7,224(0.10%)#50 | 14,105,933(0.00%)#11,408 |
| 51. | Choteau | 6 | 7,224(0.08%)#51 | 14,105,933(0.00%)#11,638 |
| 52. | Alberton | 6 | 7,224(0.08%)#52 | 14,105,933(0.00%)#11,784 |
| 53. | Terry | 6 | 7,224(0.08%)#53 | 14,105,933(0.00%)#11,789 |
| 54. | Darby | 5 | 7,224(0.07%)#54 | 14,105,933(0.00%)#12,106 |
| 55. | Circle | 5 | 7,224(0.07%)#55 | 14,105,933(0.00%)#12,128 |
| 56. | Amsterdam | 5 | 7,224(0.07%)#56 | 14,105,933(0.00%)#12,171 |
| 57. | Kingsbury Colony | 5 | 7,224(0.07%)#57 | 14,105,933(0.00%)#12,183 |
| 58. | Plains | 4 | 7,224(0.06%)#58 | 14,105,933(0.00%)#12,333 |
| 59. | Sylvanite | 4 | 7,224(0.06%)#59 | 14,105,933(0.00%)#12,580 |
| 60. | Wibaux | 3 | 7,224(0.04%)#60 | 14,105,933(0.00%)#12,873 |
| 61. | Clyde Park | 3 | 7,224(0.04%)#61 | 14,105,933(0.00%)#12,981 |
| 62. | Sand Coulee | 3 | 7,224(0.04%)#62 | 14,105,933(0.00%)#13,022 |
| 63. | Bainville | 3 | 7,224(0.04%)#63 | 14,105,933(0.00%)#13,055 |
| 64. | Stockett | 3 | 7,224(0.04%)#64 | 14,105,933(0.00%)#13,056 |
| 65. | Rollins | 3 | 7,224(0.04%)#65 | 14,105,933(0.00%)#13,063 |
| 66. | Belt | 2 | 7,224(0.03%)#66 | 14,105,933(0.00%)#13,357 |
| 67. | Savage | 2 | 7,224(0.03%)#67 | 14,105,933(0.00%)#13,493 |
| 68. | East Glacier Park Village | 2 | 7,224(0.03%)#68 | 14,105,933(0.00%)#13,516 |
| 69. | Medicine Lake | 2 | 7,224(0.03%)#69 | 14,105,933(0.00%)#13,550 |
| 70. | Maverick Mountain | 2 | 7,224(0.03%)#70 | 14,105,933(0.00%)#13,630 |
| 71. | Montana City | 1 | 7,224(0.01%)#71 | 14,105,933(0.00%)#13,673 |
| 72. | Culbertson | 1 | 7,224(0.01%)#72 | 14,105,933(0.00%)#13,827 |
| 73. | Nashua | 1 | 7,224(0.01%)#73 | 14,105,933(0.00%)#13,966 |
| 74. | Drummond | 1 | 7,224(0.01%)#74 | 14,105,933(0.00%)#13,984 |
| 75. | South Glastonbury | 1 | 7,224(0.01%)#75 | 14,105,933(0.00%)#13,985 |
| 76. | Richey | 1 | 7,224(0.01%)#76 | 14,105,933(0.00%)#14,003 |
| 77. | Fox Lake | 1 | 7,224(0.01%)#77 | 14,105,933(0.00%)#14,056 |
Common Questions
What are the Top 10 Cities with the Most Immigrants from Asia in Montana?
Top 10 Cities with the Most Immigrants from Asia in Montana are:
#1
1,131
#2
1,067
#3
811
#4
377
#5
334
#6
302
#7
249
#8
236
#9
100
#10
99
What city has the Most Immigrants from Asia in Montana?
Bozeman has the Most Immigrants from Asia in Montana with 1,131.
What is the Total Immigrants from Asia in the State of Montana?
Total Immigrants from Asia in Montana is 7,224.
What is the Total Immigrants from Asia in the United States?
Total Immigrants from Asia in the United States is 14,105,933.