Cities with the Most Immigrants from Asia in Nevada
RELATED REPORTS & OPTIONS
Asia
Nevada
Compare Cities
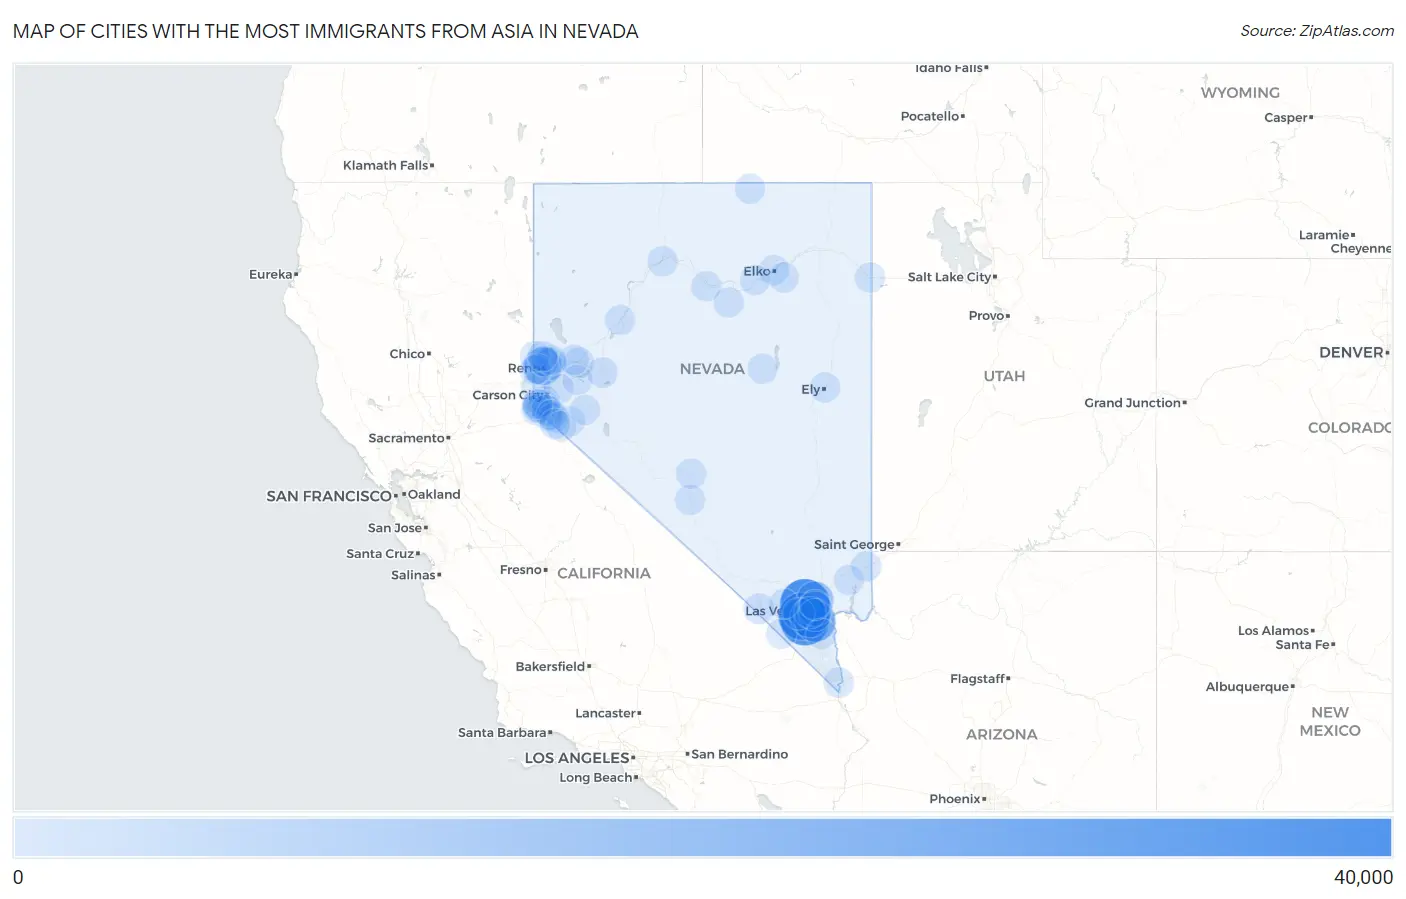
Map of Cities with the Most Immigrants from Asia in Nevada
0
40,000
Cities with the Most Immigrants from Asia in Nevada
| City | Asia | vs State | vs National | |
| 1. | Las Vegas | 34,825 | 188,343(18.49%)#1 | 14,105,933(0.25%)#38 |
| 2. | Enterprise | 32,526 | 188,343(17.27%)#2 | 14,105,933(0.23%)#42 |
| 3. | Spring Valley | 31,649 | 188,343(16.80%)#3 | 14,105,933(0.22%)#45 |
| 4. | Henderson | 19,407 | 188,343(10.30%)#4 | 14,105,933(0.14%)#85 |
| 5. | Paradise | 16,837 | 188,343(8.94%)#5 | 14,105,933(0.12%)#104 |
| 6. | Reno | 13,705 | 188,343(7.28%)#6 | 14,105,933(0.10%)#142 |
| 7. | North Las Vegas | 11,916 | 188,343(6.33%)#7 | 14,105,933(0.08%)#173 |
| 8. | Sunrise Manor | 7,738 | 188,343(4.11%)#8 | 14,105,933(0.05%)#265 |
| 9. | Sparks | 3,863 | 188,343(2.05%)#9 | 14,105,933(0.03%)#544 |
| 10. | Whitney | 3,525 | 188,343(1.87%)#10 | 14,105,933(0.02%)#599 |
| 11. | Summerlin South | 2,590 | 188,343(1.38%)#11 | 14,105,933(0.02%)#783 |
| 12. | Winchester | 2,487 | 188,343(1.32%)#12 | 14,105,933(0.02%)#805 |
| 13. | Carson | 1,117 | 188,343(0.59%)#13 | 14,105,933(0.01%)#1,483 |
| 14. | Pahrump | 688 | 188,343(0.37%)#14 | 14,105,933(0.00%)#2,028 |
| 15. | Mesquite | 366 | 188,343(0.19%)#15 | 14,105,933(0.00%)#2,918 |
| 16. | Fallon | 348 | 188,343(0.18%)#16 | 14,105,933(0.00%)#3,013 |
| 17. | Fernley | 249 | 188,343(0.13%)#17 | 14,105,933(0.00%)#3,562 |
| 18. | Dayton | 228 | 188,343(0.12%)#18 | 14,105,933(0.00%)#3,723 |
| 19. | Boulder City | 191 | 188,343(0.10%)#19 | 14,105,933(0.00%)#4,052 |
| 20. | Indian Hills | 187 | 188,343(0.10%)#20 | 14,105,933(0.00%)#4,090 |
| 21. | Winnemucca | 156 | 188,343(0.08%)#21 | 14,105,933(0.00%)#4,445 |
| 22. | Sun Valley | 140 | 188,343(0.07%)#22 | 14,105,933(0.00%)#4,658 |
| 23. | Spanish Springs | 135 | 188,343(0.07%)#23 | 14,105,933(0.00%)#4,728 |
| 24. | Incline Village | 133 | 188,343(0.07%)#24 | 14,105,933(0.00%)#4,780 |
| 25. | Gardnerville | 126 | 188,343(0.07%)#25 | 14,105,933(0.00%)#4,889 |
| 26. | Nellis Afb | 124 | 188,343(0.07%)#26 | 14,105,933(0.00%)#4,926 |
| 27. | Elko | 116 | 188,343(0.06%)#27 | 14,105,933(0.00%)#5,038 |
| 28. | Cold Springs | 113 | 188,343(0.06%)#28 | 14,105,933(0.00%)#5,090 |
| 29. | Silver Springs | 92 | 188,343(0.05%)#29 | 14,105,933(0.00%)#5,496 |
| 30. | West Wendover | 74 | 188,343(0.04%)#30 | 14,105,933(0.00%)#5,947 |
| 31. | Spring Creek | 73 | 188,343(0.04%)#31 | 14,105,933(0.00%)#5,966 |
| 32. | Kingsbury | 71 | 188,343(0.04%)#32 | 14,105,933(0.00%)#6,040 |
| 33. | Laughlin | 70 | 188,343(0.04%)#33 | 14,105,933(0.00%)#6,056 |
| 34. | Carlin | 59 | 188,343(0.03%)#34 | 14,105,933(0.00%)#6,435 |
| 35. | Lovelock | 53 | 188,343(0.03%)#35 | 14,105,933(0.00%)#6,673 |
| 36. | Sandy Valley | 48 | 188,343(0.03%)#36 | 14,105,933(0.00%)#6,903 |
| 37. | Skyland | 43 | 188,343(0.02%)#37 | 14,105,933(0.00%)#7,169 |
| 38. | Genoa | 41 | 188,343(0.02%)#38 | 14,105,933(0.00%)#7,267 |
| 39. | Gardnerville Ranchos | 32 | 188,343(0.02%)#39 | 14,105,933(0.00%)#7,794 |
| 40. | Verdi | 32 | 188,343(0.02%)#40 | 14,105,933(0.00%)#7,849 |
| 41. | Moapa Valley | 30 | 188,343(0.02%)#41 | 14,105,933(0.00%)#7,938 |
| 42. | Stateline | 29 | 188,343(0.02%)#42 | 14,105,933(0.00%)#8,105 |
| 43. | Mogul | 25 | 188,343(0.01%)#43 | 14,105,933(0.00%)#8,457 |
| 44. | Round Hill Village | 25 | 188,343(0.01%)#44 | 14,105,933(0.00%)#8,467 |
| 45. | Crescent Valley | 25 | 188,343(0.01%)#45 | 14,105,933(0.00%)#8,474 |
| 46. | Battle Mountain | 23 | 188,343(0.01%)#46 | 14,105,933(0.00%)#8,629 |
| 47. | Golden Valley | 23 | 188,343(0.01%)#47 | 14,105,933(0.00%)#8,691 |
| 48. | Carter Springs | 21 | 188,343(0.01%)#48 | 14,105,933(0.00%)#8,939 |
| 49. | Goldfield | 19 | 188,343(0.01%)#49 | 14,105,933(0.00%)#9,161 |
| 50. | Lemmon Valley | 17 | 188,343(0.01%)#50 | 14,105,933(0.00%)#9,326 |
| 51. | Minden | 17 | 188,343(0.01%)#51 | 14,105,933(0.00%)#9,357 |
| 52. | Ely | 13 | 188,343(0.01%)#52 | 14,105,933(0.00%)#9,929 |
| 53. | Lakeridge | 13 | 188,343(0.01%)#53 | 14,105,933(0.00%)#10,062 |
| 54. | Ruhenstroth | 12 | 188,343(0.01%)#54 | 14,105,933(0.00%)#10,179 |
| 55. | Smith Valley | 12 | 188,343(0.01%)#55 | 14,105,933(0.00%)#10,183 |
| 56. | Mount Charleston | 12 | 188,343(0.01%)#56 | 14,105,933(0.00%)#10,253 |
| 57. | Tonopah | 11 | 188,343(0.01%)#57 | 14,105,933(0.00%)#10,362 |
| 58. | Eureka | 9 | 188,343(0.00%)#58 | 14,105,933(0.00%)#10,955 |
| 59. | Topaz Ranch Estates | 5 | 188,343(0.00%)#59 | 14,105,933(0.00%)#11,974 |
| 60. | Owyhee | 3 | 188,343(0.00%)#60 | 14,105,933(0.00%)#12,785 |
| 61. | Wadsworth | 3 | 188,343(0.00%)#61 | 14,105,933(0.00%)#12,850 |
| 62. | Yerington | 1 | 188,343(0.00%)#62 | 14,105,933(0.00%)#13,665 |
| 63. | Double Spring | 1 | 188,343(0.00%)#63 | 14,105,933(0.00%)#13,986 |
1
Common Questions
What are the Top 10 Cities with the Most Immigrants from Asia in Nevada?
Top 10 Cities with the Most Immigrants from Asia in Nevada are:
#1
34,825
#2
32,526
#3
31,649
#4
19,407
#5
16,837
#6
13,705
#7
11,916
#8
7,738
#9
3,863
#10
3,525
What city has the Most Immigrants from Asia in Nevada?
Las Vegas has the Most Immigrants from Asia in Nevada with 34,825.
What is the Total Immigrants from Asia in the State of Nevada?
Total Immigrants from Asia in Nevada is 188,343.
What is the Total Immigrants from Asia in the United States?
Total Immigrants from Asia in the United States is 14,105,933.