Cities with the Most Immigrants from Asia in Georgia
RELATED REPORTS & OPTIONS
Asia
Georgia
Compare Cities
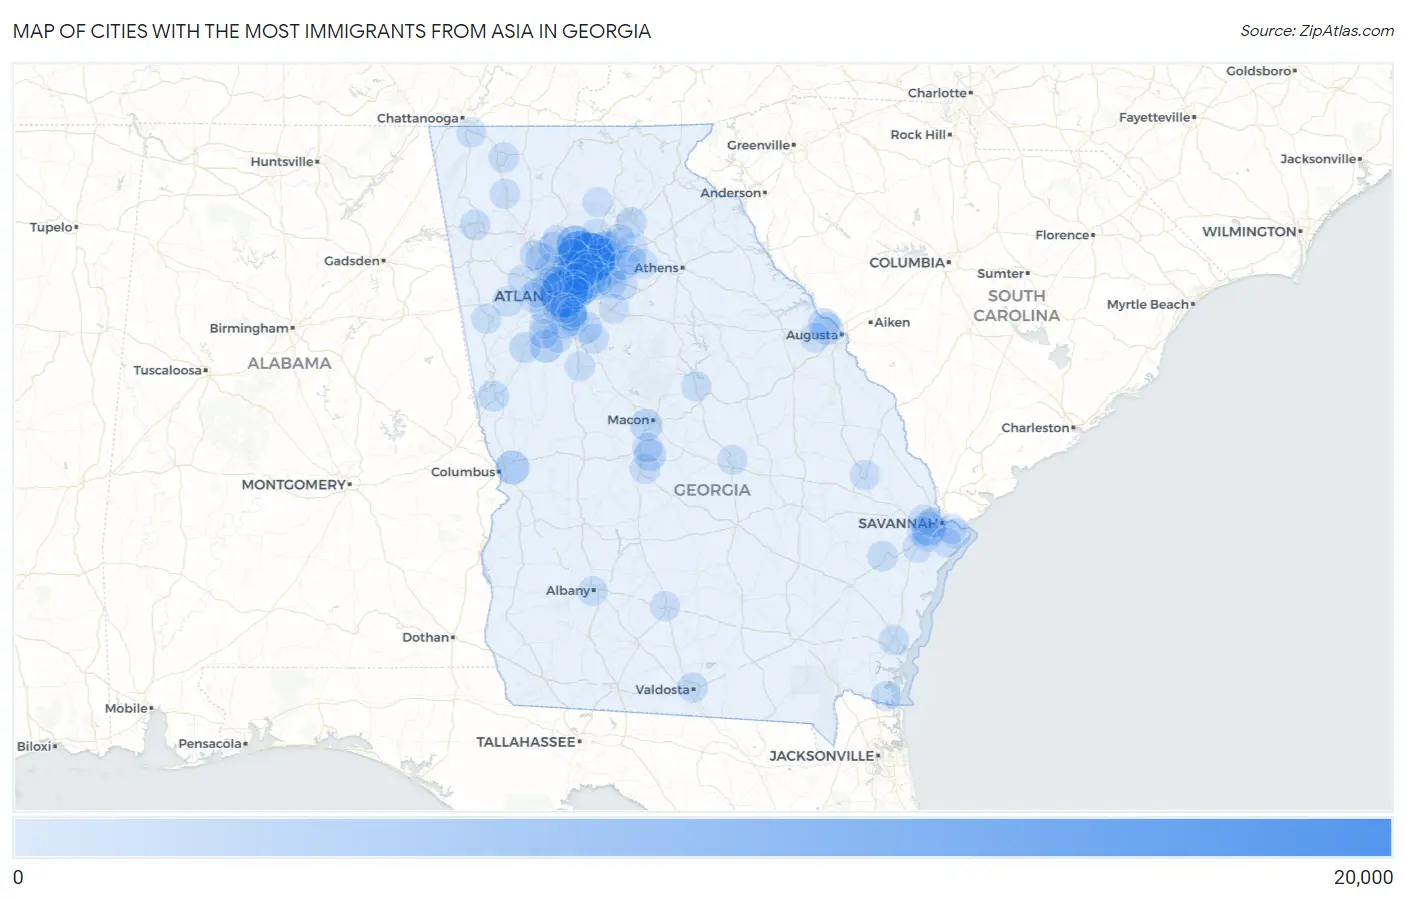
Map of Cities with the Most Immigrants from Asia in Georgia
0
20,000
Cities with the Most Immigrants from Asia in Georgia
| City | Asia | vs State | vs National | |
| 1. | Johns Creek | 18,768 | 349,085(5.38%)#1 | 14,105,933(0.13%)#90 |
| 2. | Atlanta | 16,102 | 349,085(4.61%)#2 | 14,105,933(0.11%)#113 |
| 3. | Alpharetta | 12,468 | 349,085(3.57%)#3 | 14,105,933(0.09%)#163 |
| 4. | Sandy Springs | 6,907 | 349,085(1.98%)#4 | 14,105,933(0.05%)#304 |
| 5. | Dunwoody | 6,859 | 349,085(1.96%)#5 | 14,105,933(0.05%)#307 |
| 6. | Milton | 6,197 | 349,085(1.78%)#6 | 14,105,933(0.04%)#343 |
| 7. | Duluth | 5,898 | 349,085(1.69%)#7 | 14,105,933(0.04%)#362 |
| 8. | Roswell | 4,069 | 349,085(1.17%)#8 | 14,105,933(0.03%)#518 |
| 9. | Athens-Clarke County Unified Government (Balance) | 3,846 | 349,085(1.10%)#9 | 14,105,933(0.03%)#547 |
| 10. | Columbus | 3,821 | 349,085(1.09%)#10 | 14,105,933(0.03%)#552 |
| 11. | Savannah | 3,751 | 349,085(1.07%)#11 | 14,105,933(0.03%)#561 |
| 12. | Suwanee | 3,712 | 349,085(1.06%)#12 | 14,105,933(0.03%)#571 |
| 13. | Peachtree Corners | 3,016 | 349,085(0.86%)#13 | 14,105,933(0.02%)#682 |
| 14. | Brookhaven | 2,935 | 349,085(0.84%)#14 | 14,105,933(0.02%)#699 |
| 15. | Augusta-Richmond County Consolidated Government (Balance) | 2,867 | 349,085(0.82%)#15 | 14,105,933(0.02%)#713 |
| 16. | Peachtree City | 2,742 | 349,085(0.79%)#16 | 14,105,933(0.02%)#747 |
| 17. | Smyrna | 2,469 | 349,085(0.71%)#17 | 14,105,933(0.02%)#810 |
| 18. | Lawrenceville | 2,275 | 349,085(0.65%)#18 | 14,105,933(0.02%)#866 |
| 19. | Clarkston | 2,222 | 349,085(0.64%)#19 | 14,105,933(0.02%)#886 |
| 20. | Macon Bibb County | 2,204 | 349,085(0.63%)#20 | 14,105,933(0.02%)#891 |
| 21. | Tucker | 2,163 | 349,085(0.62%)#21 | 14,105,933(0.02%)#906 |
| 22. | Scottdale | 2,109 | 349,085(0.60%)#22 | 14,105,933(0.01%)#924 |
| 23. | Warner Robins | 2,009 | 349,085(0.58%)#23 | 14,105,933(0.01%)#960 |
| 24. | Sugar Hill | 1,974 | 349,085(0.57%)#24 | 14,105,933(0.01%)#986 |
| 25. | Mountain Park | 1,964 | 349,085(0.56%)#25 | 14,105,933(0.01%)#992 |
| 26. | Chamblee | 1,899 | 349,085(0.54%)#26 | 14,105,933(0.01%)#1,021 |
| 27. | Martinez | 1,820 | 349,085(0.52%)#27 | 14,105,933(0.01%)#1,047 |
| 28. | Lilburn | 1,817 | 349,085(0.52%)#28 | 14,105,933(0.01%)#1,051 |
| 29. | Norcross | 1,771 | 349,085(0.51%)#29 | 14,105,933(0.01%)#1,078 |
| 30. | Evans | 1,712 | 349,085(0.49%)#30 | 14,105,933(0.01%)#1,096 |
| 31. | North Decatur | 1,662 | 349,085(0.48%)#31 | 14,105,933(0.01%)#1,133 |
| 32. | Stockbridge | 1,612 | 349,085(0.46%)#32 | 14,105,933(0.01%)#1,159 |
| 33. | Doraville | 1,478 | 349,085(0.42%)#33 | 14,105,933(0.01%)#1,234 |
| 34. | Kennesaw | 1,431 | 349,085(0.41%)#34 | 14,105,933(0.01%)#1,264 |
| 35. | North Druid Hills | 1,402 | 349,085(0.40%)#35 | 14,105,933(0.01%)#1,284 |
| 36. | Morrow | 1,230 | 349,085(0.35%)#36 | 14,105,933(0.01%)#1,393 |
| 37. | Snellville | 1,218 | 349,085(0.35%)#37 | 14,105,933(0.01%)#1,406 |
| 38. | Newnan | 1,107 | 349,085(0.32%)#38 | 14,105,933(0.01%)#1,491 |
| 39. | Gainesville | 976 | 349,085(0.28%)#39 | 14,105,933(0.01%)#1,620 |
| 40. | Decatur | 968 | 349,085(0.28%)#40 | 14,105,933(0.01%)#1,633 |
| 41. | Forest Park | 887 | 349,085(0.25%)#41 | 14,105,933(0.01%)#1,742 |
| 42. | Woodstock | 878 | 349,085(0.25%)#42 | 14,105,933(0.01%)#1,752 |
| 43. | Marietta | 811 | 349,085(0.23%)#43 | 14,105,933(0.01%)#1,849 |
| 44. | Lake City | 802 | 349,085(0.23%)#44 | 14,105,933(0.01%)#1,859 |
| 45. | Lagrange | 784 | 349,085(0.22%)#45 | 14,105,933(0.01%)#1,885 |
| 46. | Fayetteville | 757 | 349,085(0.22%)#46 | 14,105,933(0.01%)#1,925 |
| 47. | Riverdale | 751 | 349,085(0.22%)#47 | 14,105,933(0.01%)#1,927 |
| 48. | Rome | 729 | 349,085(0.21%)#48 | 14,105,933(0.01%)#1,955 |
| 49. | Acworth | 675 | 349,085(0.19%)#49 | 14,105,933(0.00%)#2,050 |
| 50. | Fairburn | 664 | 349,085(0.19%)#50 | 14,105,933(0.00%)#2,068 |
| 51. | Mableton | 663 | 349,085(0.19%)#51 | 14,105,933(0.00%)#2,070 |
| 52. | Dalton | 633 | 349,085(0.18%)#52 | 14,105,933(0.00%)#2,130 |
| 53. | Pooler | 633 | 349,085(0.18%)#53 | 14,105,933(0.00%)#2,132 |
| 54. | Hinesville | 630 | 349,085(0.18%)#54 | 14,105,933(0.00%)#2,140 |
| 55. | South Fulton | 550 | 349,085(0.16%)#55 | 14,105,933(0.00%)#2,319 |
| 56. | Perry | 544 | 349,085(0.16%)#56 | 14,105,933(0.00%)#2,332 |
| 57. | Valdosta | 543 | 349,085(0.16%)#57 | 14,105,933(0.00%)#2,335 |
| 58. | Druid Hills | 540 | 349,085(0.15%)#58 | 14,105,933(0.00%)#2,343 |
| 59. | Buford | 487 | 349,085(0.14%)#59 | 14,105,933(0.00%)#2,479 |
| 60. | Loganville | 486 | 349,085(0.14%)#60 | 14,105,933(0.00%)#2,487 |
| 61. | Dacula | 451 | 349,085(0.13%)#61 | 14,105,933(0.00%)#2,603 |
| 62. | East Point | 436 | 349,085(0.12%)#62 | 14,105,933(0.00%)#2,651 |
| 63. | Villa Rica | 431 | 349,085(0.12%)#63 | 14,105,933(0.00%)#2,667 |
| 64. | Hiram | 424 | 349,085(0.12%)#64 | 14,105,933(0.00%)#2,694 |
| 65. | Douglasville | 403 | 349,085(0.12%)#65 | 14,105,933(0.00%)#2,759 |
| 66. | Cumming | 349 | 349,085(0.10%)#66 | 14,105,933(0.00%)#3,009 |
| 67. | Centerville | 332 | 349,085(0.10%)#67 | 14,105,933(0.00%)#3,095 |
| 68. | Georgetown | 323 | 349,085(0.09%)#68 | 14,105,933(0.00%)#3,132 |
| 69. | Holly Springs | 320 | 349,085(0.09%)#69 | 14,105,933(0.00%)#3,145 |
| 70. | Griffin | 309 | 349,085(0.09%)#70 | 14,105,933(0.00%)#3,206 |
| 71. | Statesboro | 306 | 349,085(0.09%)#71 | 14,105,933(0.00%)#3,221 |
| 72. | Vinings | 304 | 349,085(0.09%)#72 | 14,105,933(0.00%)#3,240 |
| 73. | Henderson | 304 | 349,085(0.09%)#73 | 14,105,933(0.00%)#3,245 |
| 74. | Mcdonough | 283 | 349,085(0.08%)#74 | 14,105,933(0.00%)#3,360 |
| 75. | Milledgeville | 283 | 349,085(0.08%)#75 | 14,105,933(0.00%)#3,364 |
| 76. | Tifton | 279 | 349,085(0.08%)#76 | 14,105,933(0.00%)#3,387 |
| 77. | Richmond Hill | 272 | 349,085(0.08%)#77 | 14,105,933(0.00%)#3,419 |
| 78. | Dock Junction | 250 | 349,085(0.07%)#78 | 14,105,933(0.00%)#3,555 |
| 79. | Fort Oglethorpe | 247 | 349,085(0.07%)#79 | 14,105,933(0.00%)#3,584 |
| 80. | Albany | 246 | 349,085(0.07%)#80 | 14,105,933(0.00%)#3,586 |
| 81. | Wilmington Island | 236 | 349,085(0.07%)#81 | 14,105,933(0.00%)#3,670 |
| 82. | Braselton | 233 | 349,085(0.07%)#82 | 14,105,933(0.00%)#3,689 |
| 83. | St Marys | 224 | 349,085(0.06%)#83 | 14,105,933(0.00%)#3,748 |
| 84. | Winder | 222 | 349,085(0.06%)#84 | 14,105,933(0.00%)#3,763 |
| 85. | Garden City | 222 | 349,085(0.06%)#85 | 14,105,933(0.00%)#3,766 |
| 86. | Bemiss | 218 | 349,085(0.06%)#86 | 14,105,933(0.00%)#3,808 |
| 87. | Whitemarsh Island | 218 | 349,085(0.06%)#87 | 14,105,933(0.00%)#3,809 |
| 88. | Tyrone | 210 | 349,085(0.06%)#88 | 14,105,933(0.00%)#3,873 |
| 89. | Conyers | 208 | 349,085(0.06%)#89 | 14,105,933(0.00%)#3,883 |
| 90. | Carrollton | 200 | 349,085(0.06%)#90 | 14,105,933(0.00%)#3,964 |
| 91. | Dawsonville | 198 | 349,085(0.06%)#91 | 14,105,933(0.00%)#3,988 |
| 92. | Hapeville | 193 | 349,085(0.06%)#92 | 14,105,933(0.00%)#4,039 |
| 93. | Calhoun | 188 | 349,085(0.05%)#93 | 14,105,933(0.00%)#4,069 |
| 94. | Flowery Branch | 186 | 349,085(0.05%)#94 | 14,105,933(0.00%)#4,102 |
| 95. | Dublin | 185 | 349,085(0.05%)#95 | 14,105,933(0.00%)#4,111 |
| 96. | Auburn | 182 | 349,085(0.05%)#96 | 14,105,933(0.00%)#4,138 |
| 97. | Grovetown | 181 | 349,085(0.05%)#97 | 14,105,933(0.00%)#4,145 |
| 98. | Skidaway Island | 181 | 349,085(0.05%)#98 | 14,105,933(0.00%)#4,147 |
| 99. | Lithia Springs | 179 | 349,085(0.05%)#99 | 14,105,933(0.00%)#4,165 |
| 100. | Conley | 176 | 349,085(0.05%)#100 | 14,105,933(0.00%)#4,212 |
Common Questions
What are the Top 10 Cities with the Most Immigrants from Asia in Georgia?
Top 10 Cities with the Most Immigrants from Asia in Georgia are:
#1
18,768
#2
16,102
#3
12,468
#4
6,907
#5
6,859
#6
6,197
#7
5,898
#8
4,069
#9
3,821
#10
3,751
What city has the Most Immigrants from Asia in Georgia?
Johns Creek has the Most Immigrants from Asia in Georgia with 18,768.
What is the Total Immigrants from Asia in the State of Georgia?
Total Immigrants from Asia in Georgia is 349,085.
What is the Total Immigrants from Asia in the United States?
Total Immigrants from Asia in the United States is 14,105,933.