Nicaraguan vs Immigrants from France Disability
COMPARE
Nicaraguan
Immigrants from France
Disability
Disability Comparison
Nicaraguans
Immigrants from France
11.3%
DISABILITY
96.2/ 100
METRIC RATING
107th/ 347
METRIC RANK
11.0%
DISABILITY
99.4/ 100
METRIC RATING
70th/ 347
METRIC RANK
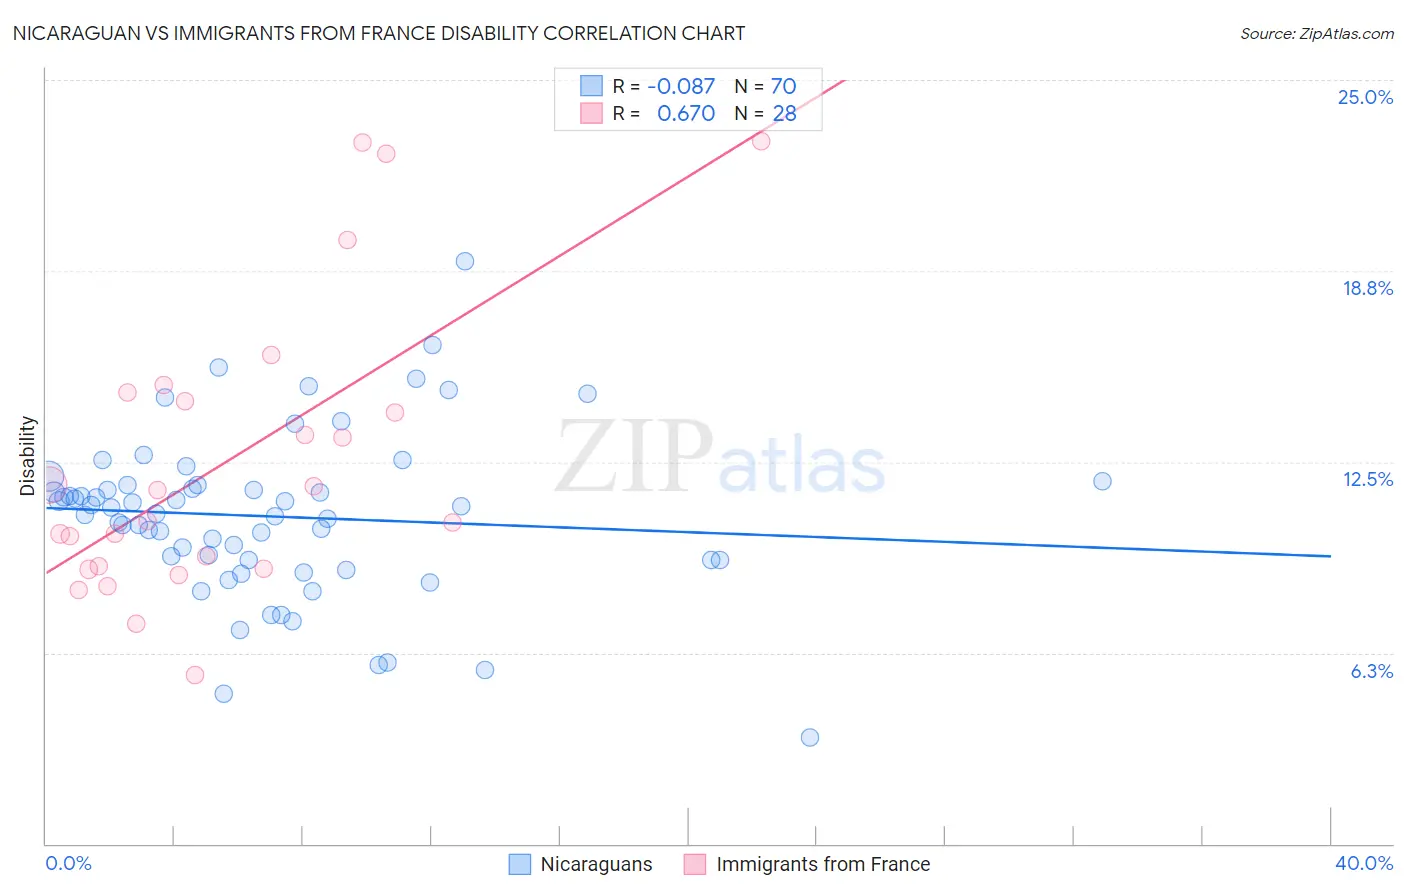
Nicaraguan vs Immigrants from France Disability Correlation Chart
The statistical analysis conducted on geographies consisting of 285,692,565 people shows a slight negative correlation between the proportion of Nicaraguans and percentage of population with a disability in the United States with a correlation coefficient (R) of -0.087 and weighted average of 11.3%. Similarly, the statistical analysis conducted on geographies consisting of 287,909,175 people shows a significant positive correlation between the proportion of Immigrants from France and percentage of population with a disability in the United States with a correlation coefficient (R) of 0.670 and weighted average of 11.0%, a difference of 2.3%.
Disability Correlation Summary
| Measurement | Nicaraguan | Immigrants from France |
| Minimum | 3.5% | 5.5% |
| Maximum | 19.0% | 23.0% |
| Range | 15.6% | 17.5% |
| Mean | 10.7% | 12.5% |
| Median | 10.9% | 11.1% |
| Interquartile 25% (IQ1) | 9.3% | 9.0% |
| Interquartile 75% (IQ3) | 11.7% | 14.6% |
| Interquartile Range (IQR) | 2.5% | 5.6% |
| Standard Deviation (Sample) | 2.7% | 4.7% |
| Standard Deviation (Population) | 2.7% | 4.6% |
Similar Demographics by Disability
Demographics Similar to Nicaraguans by Disability
In terms of disability, the demographic groups most similar to Nicaraguans are Immigrants from Eastern Europe (11.3%, a difference of 0.020%), Immigrants from Kazakhstan (11.3%, a difference of 0.050%), Immigrants from Uruguay (11.3%, a difference of 0.060%), Immigrants (11.3%, a difference of 0.060%), and Immigrants from Nigeria (11.3%, a difference of 0.080%).
| Demographics | Rating | Rank | Disability |
| Immigrants | Greece | 96.9 /100 | #100 | Exceptional 11.3% |
| Immigrants | Nicaragua | 96.8 /100 | #101 | Exceptional 11.3% |
| Immigrants | Eastern Africa | 96.7 /100 | #102 | Exceptional 11.3% |
| Immigrants | Uruguay | 96.4 /100 | #103 | Exceptional 11.3% |
| Immigrants | Immigrants | 96.4 /100 | #104 | Exceptional 11.3% |
| Immigrants | Kazakhstan | 96.4 /100 | #105 | Exceptional 11.3% |
| Immigrants | Eastern Europe | 96.3 /100 | #106 | Exceptional 11.3% |
| Nicaraguans | 96.2 /100 | #107 | Exceptional 11.3% |
| Immigrants | Nigeria | 96.0 /100 | #108 | Exceptional 11.3% |
| Immigrants | Uganda | 95.7 /100 | #109 | Exceptional 11.3% |
| Immigrants | Denmark | 95.6 /100 | #110 | Exceptional 11.3% |
| Immigrants | South Eastern Asia | 95.4 /100 | #111 | Exceptional 11.3% |
| Immigrants | Uzbekistan | 94.9 /100 | #112 | Exceptional 11.3% |
| Guyanese | 94.7 /100 | #113 | Exceptional 11.3% |
| Immigrants | Syria | 94.7 /100 | #114 | Exceptional 11.3% |
Demographics Similar to Immigrants from France by Disability
In terms of disability, the demographic groups most similar to Immigrants from France are Immigrants from Lebanon (11.0%, a difference of 0.020%), Sri Lankan (11.0%, a difference of 0.080%), Immigrants from Chile (11.0%, a difference of 0.10%), Immigrants from Bangladesh (11.0%, a difference of 0.13%), and Immigrants from Serbia (11.0%, a difference of 0.15%).
| Demographics | Rating | Rank | Disability |
| Immigrants | Eritrea | 99.7 /100 | #63 | Exceptional 11.0% |
| Immigrants | Sweden | 99.6 /100 | #64 | Exceptional 11.0% |
| Bulgarians | 99.6 /100 | #65 | Exceptional 11.0% |
| Laotians | 99.6 /100 | #66 | Exceptional 11.0% |
| Colombians | 99.6 /100 | #67 | Exceptional 11.0% |
| Immigrants | Afghanistan | 99.6 /100 | #68 | Exceptional 11.0% |
| Sri Lankans | 99.5 /100 | #69 | Exceptional 11.0% |
| Immigrants | France | 99.4 /100 | #70 | Exceptional 11.0% |
| Immigrants | Lebanon | 99.4 /100 | #71 | Exceptional 11.0% |
| Immigrants | Chile | 99.4 /100 | #72 | Exceptional 11.0% |
| Immigrants | Bangladesh | 99.4 /100 | #73 | Exceptional 11.0% |
| Immigrants | Serbia | 99.4 /100 | #74 | Exceptional 11.0% |
| Immigrants | Vietnam | 99.4 /100 | #75 | Exceptional 11.0% |
| Sierra Leoneans | 99.3 /100 | #76 | Exceptional 11.0% |
| Immigrants | Belgium | 99.3 /100 | #77 | Exceptional 11.0% |