Cities with the Highest Percentage of Immigrants from South Central Asia in Kansas
RELATED REPORTS & OPTIONS
South Central Asia
Kansas
Compare Cities
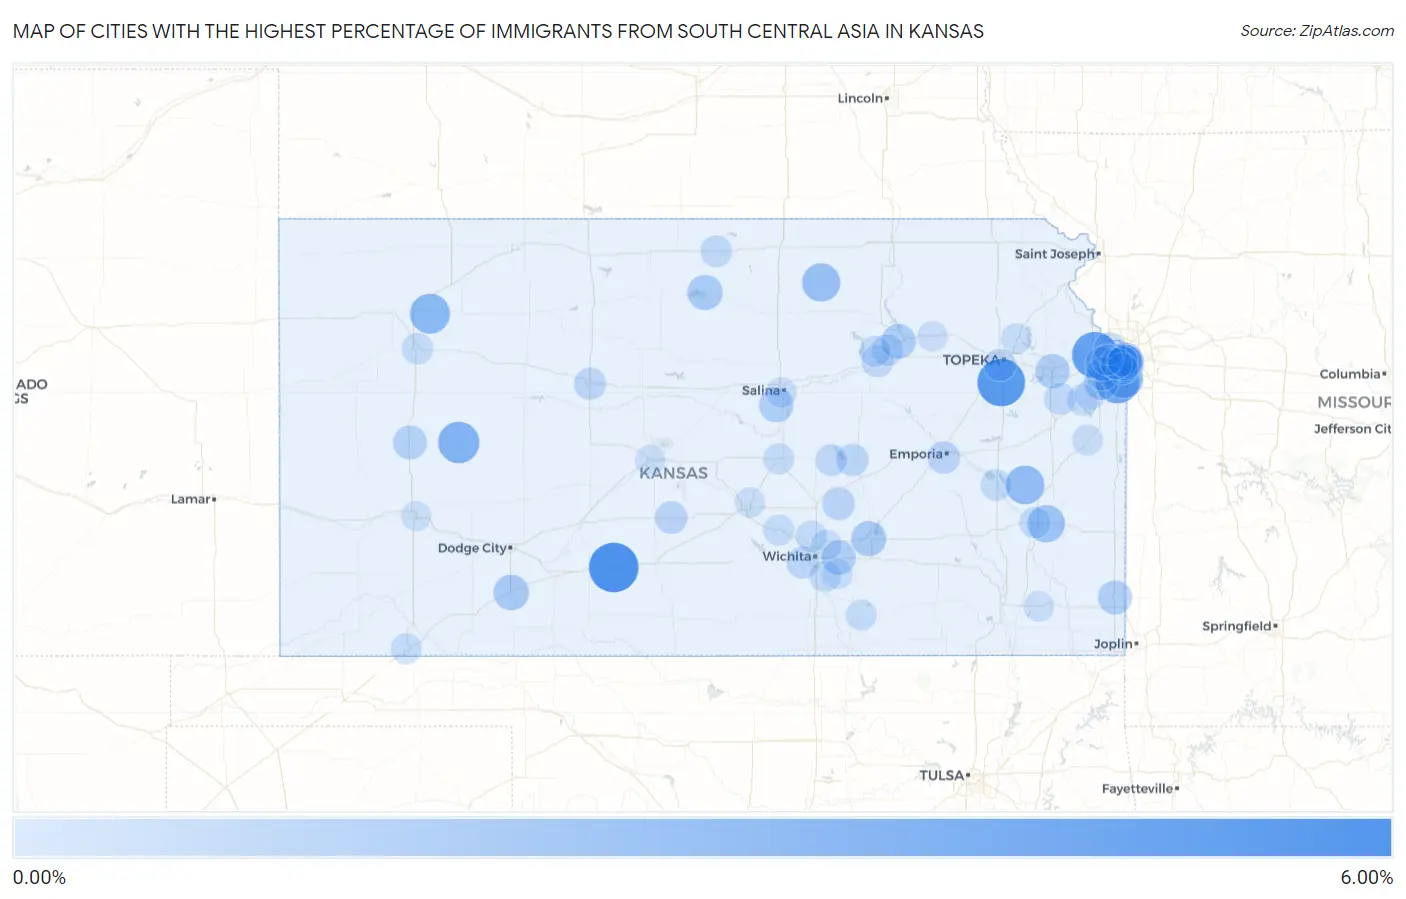
Map of Cities with the Highest Percentage of Immigrants from South Central Asia in Kansas
0.00%
6.00%
Cities with the Highest Percentage of Immigrants from South Central Asia in Kansas
| City | South Central Asia | vs State | vs National | |
| 1. | Haviland | 5.49% | 0.68%(+4.80)#1 | 1.31%(+4.18)#456 |
| 2. | Wakarusa | 4.94% | 0.68%(+4.26)#2 | 1.31%(+3.63)#538 |
| 3. | Bonner Springs | 4.47% | 0.68%(+3.78)#3 | 1.31%(+3.16)#621 |
| 4. | Overland Park | 3.94% | 0.68%(+3.25)#4 | 1.31%(+2.63)#733 |
| 5. | Dighton | 3.13% | 0.68%(+2.45)#5 | 1.31%(+1.82)#1,017 |
| 6. | Menlo | 2.70% | 0.68%(+2.02)#6 | 1.31%(+1.39)#1,188 |
| 7. | Westphalia | 2.34% | 0.68%(+1.66)#7 | 1.31%(+1.03)#1,391 |
| 8. | Leawood | 2.32% | 0.68%(+1.64)#8 | 1.31%(+1.01)#1,401 |
| 9. | Clifton | 2.23% | 0.68%(+1.55)#9 | 1.31%(+0.924)#1,456 |
| 10. | Mission Hills | 2.05% | 0.68%(+1.37)#10 | 1.31%(+0.738)#1,602 |
| 11. | La Harpe | 1.98% | 0.68%(+1.30)#11 | 1.31%(+0.674)#1,658 |
| 12. | Mission Woods | 1.94% | 0.68%(+1.25)#12 | 1.31%(+0.627)#1,700 |
| 13. | Mission | 1.77% | 0.68%(+1.09)#13 | 1.31%(+0.461)#1,842 |
| 14. | Fairway | 1.66% | 0.68%(+0.977)#14 | 1.31%(+0.350)#1,961 |
| 15. | Minneola | 1.44% | 0.68%(+0.758)#15 | 1.31%(+0.131)#2,244 |
| 16. | Glen Elder | 1.40% | 0.68%(+0.715)#16 | 1.31%(+0.088)#2,306 |
| 17. | El Dorado | 1.37% | 0.68%(+0.685)#17 | 1.31%(+0.058)#2,352 |
| 18. | Smolan | 1.21% | 0.68%(+0.531)#18 | 1.31%(-0.096)#2,545 |
| 19. | Manhattan | 1.21% | 0.68%(+0.525)#19 | 1.31%(-0.102)#2,549 |
| 20. | Lawrence | 1.19% | 0.68%(+0.509)#20 | 1.31%(-0.118)#2,583 |
| 21. | Olathe | 1.18% | 0.68%(+0.497)#21 | 1.31%(-0.130)#2,612 |
| 22. | Shawnee | 1.14% | 0.68%(+0.455)#22 | 1.31%(-0.172)#2,677 |
| 23. | Andover | 1.11% | 0.68%(+0.431)#23 | 1.31%(-0.196)#2,728 |
| 24. | Pittsburg | 1.05% | 0.68%(+0.372)#24 | 1.31%(-0.255)#2,837 |
| 25. | Scott City | 1.04% | 0.68%(+0.362)#25 | 1.31%(-0.265)#2,857 |
| 26. | Westwood | 0.98% | 0.68%(+0.303)#26 | 1.31%(-0.324)#2,978 |
| 27. | Lenexa | 0.88% | 0.68%(+0.199)#27 | 1.31%(-0.428)#3,199 |
| 28. | Elbing | 0.74% | 0.68%(+0.057)#28 | 1.31%(-0.570)#3,560 |
| 29. | Emporia | 0.72% | 0.68%(+0.036)#29 | 1.31%(-0.591)#3,623 |
| 30. | Stafford | 0.69% | 0.68%(+0.007)#30 | 1.31%(-0.619)#3,715 |
| 31. | Kansas City | 0.67% | 0.68%(-0.009)#31 | 1.31%(-0.636)#3,761 |
| 32. | Marion | 0.60% | 0.68%(-0.082)#32 | 1.31%(-0.709)#3,995 |
| 33. | Topeka | 0.56% | 0.68%(-0.123)#33 | 1.31%(-0.750)#4,119 |
| 34. | Wichita | 0.56% | 0.68%(-0.125)#34 | 1.31%(-0.752)#4,129 |
| 35. | Hays | 0.54% | 0.68%(-0.141)#35 | 1.31%(-0.768)#4,187 |
| 36. | Grandview Plaza | 0.50% | 0.68%(-0.179)#36 | 1.31%(-0.806)#4,326 |
| 37. | Mankato | 0.49% | 0.68%(-0.196)#37 | 1.31%(-0.823)#4,391 |
| 38. | Baldwin City | 0.47% | 0.68%(-0.207)#38 | 1.31%(-0.833)#4,446 |
| 39. | Hillsboro | 0.47% | 0.68%(-0.207)#39 | 1.31%(-0.834)#4,455 |
| 40. | Ogden | 0.46% | 0.68%(-0.223)#40 | 1.31%(-0.850)#4,527 |
| 41. | Oakley | 0.39% | 0.68%(-0.293)#41 | 1.31%(-0.920)#4,837 |
| 42. | Burlington | 0.38% | 0.68%(-0.299)#42 | 1.31%(-0.926)#4,865 |
| 43. | Derby | 0.37% | 0.68%(-0.313)#43 | 1.31%(-0.940)#4,919 |
| 44. | Iola | 0.35% | 0.68%(-0.329)#44 | 1.31%(-0.956)#5,003 |
| 45. | Valley Center | 0.33% | 0.68%(-0.350)#45 | 1.31%(-0.977)#5,123 |
| 46. | Liberal | 0.32% | 0.68%(-0.362)#46 | 1.31%(-0.989)#5,183 |
| 47. | Edgerton | 0.32% | 0.68%(-0.364)#47 | 1.31%(-0.991)#5,202 |
| 48. | Prairie Village | 0.31% | 0.68%(-0.376)#48 | 1.31%(-1.00)#5,253 |
| 49. | Merriam | 0.30% | 0.68%(-0.383)#49 | 1.31%(-1.01)#5,291 |
| 50. | Mcpherson | 0.27% | 0.68%(-0.409)#50 | 1.31%(-1.04)#5,441 |
| 51. | Mount Hope | 0.24% | 0.68%(-0.437)#51 | 1.31%(-1.06)#5,620 |
| 52. | Fort Riley | 0.24% | 0.68%(-0.438)#52 | 1.31%(-1.06)#5,625 |
| 53. | Winfield | 0.24% | 0.68%(-0.444)#53 | 1.31%(-1.07)#5,663 |
| 54. | Osawatomie | 0.21% | 0.68%(-0.470)#54 | 1.31%(-1.10)#5,856 |
| 55. | Lake Quivira | 0.20% | 0.68%(-0.480)#55 | 1.31%(-1.11)#5,924 |
| 56. | Bel Aire | 0.17% | 0.68%(-0.513)#56 | 1.31%(-1.14)#6,142 |
| 57. | Rose Hill | 0.16% | 0.68%(-0.521)#57 | 1.31%(-1.15)#6,194 |
| 58. | Meriden | 0.14% | 0.68%(-0.542)#58 | 1.31%(-1.17)#6,340 |
| 59. | Gardner | 0.13% | 0.68%(-0.554)#59 | 1.31%(-1.18)#6,422 |
| 60. | Hutchinson | 0.11% | 0.68%(-0.571)#60 | 1.31%(-1.20)#6,540 |
| 61. | Great Bend | 0.11% | 0.68%(-0.573)#61 | 1.31%(-1.20)#6,549 |
| 62. | Parsons | 0.10% | 0.68%(-0.577)#62 | 1.31%(-1.20)#6,584 |
| 63. | Wamego | 0.095% | 0.68%(-0.586)#63 | 1.31%(-1.21)#6,647 |
| 64. | Salina | 0.071% | 0.68%(-0.611)#64 | 1.31%(-1.24)#6,810 |
| 65. | Roeland Park | 0.015% | 0.68%(-0.667)#65 | 1.31%(-1.29)#7,128 |
| 66. | Garden City | 0.0072% | 0.68%(-0.674)#66 | 1.31%(-1.30)#7,152 |
Common Questions
What are the Top 10 Cities with the Highest Percentage of Immigrants from South Central Asia in Kansas?
Top 10 Cities with the Highest Percentage of Immigrants from South Central Asia in Kansas are:
#1
5.49%
#2
4.94%
#3
4.47%
#4
3.94%
#5
3.13%
#6
2.70%
#7
2.34%
#8
2.32%
#9
2.23%
#10
2.05%
What city has the Highest Percentage of Immigrants from South Central Asia in Kansas?
Haviland has the Highest Percentage of Immigrants from South Central Asia in Kansas with 5.49%.
What is the Percentage of Immigrants from South Central Asia in the State of Kansas?
Percentage of Immigrants from South Central Asia in Kansas is 0.68%.
What is the Percentage of Immigrants from South Central Asia in the United States?
Percentage of Immigrants from South Central Asia in the United States is 1.31%.